K-means clustering algorithm
K-means clustering algorithm - ISCAS 2007
K-means clustering algorithm - ISCAS 2007
- No tags were found...

Create successful ePaper yourself
Turn your PDF publications into a flip-book with our unique Google optimized e-Paper software.
K-<strong>means</strong> <strong>clustering</strong> <strong>algorithm</strong><br />
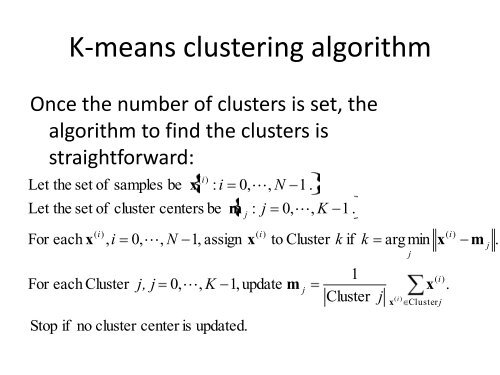
Once the number of clusters is set, the<br />
<strong>algorithm</strong> to find the clusters is<br />
straightforward:<br />
Let the set of<br />
Let the set of<br />
samples<br />
be<br />
x<br />
( i)<br />
: i<br />
cluster centers be<br />
m<br />
0, ,<br />
N<br />
j<br />
:<br />
j<br />
1 .<br />
0, ,<br />
K<br />
1 .<br />
For each x<br />
( i)<br />
, i<br />
For each Cluster<br />
0, ,<br />
N<br />
j, j<br />
1, assign<br />
0, ,<br />
K<br />
x<br />
( i)<br />
1,update<br />
to Cluster<br />
m<br />
j<br />
k<br />
if<br />
k<br />
1<br />
Cluster<br />
j<br />
argmin<br />
x<br />
( i )<br />
j<br />
x<br />
x<br />
( i)<br />
Cluster j<br />
( i)<br />
.<br />
m<br />
j<br />
.<br />
Stop if<br />
no cluster center is<br />
updated.
How to set k in k-<strong>means</strong> <strong>clustering</strong><br />
For K=1, 2, 3, …, run the k-<strong>means</strong> <strong>clustering</strong> <strong>algorithm</strong>.<br />
After the k-<strong>means</strong> <strong>algorithm</strong> has converged, we have cluster assignments for each<br />
sample as well as the locations of the cluster centers.<br />
Compute<br />
as d<br />
K<br />
Let d<br />
K<br />
Let the<br />
1<br />
N<br />
be<br />
the mean squared distance<br />
K<br />
j<br />
1<br />
( i )<br />
0 x Cluster j<br />
the distortion<br />
x<br />
of<br />
( i)<br />
transformed distortion<br />
m<br />
j<br />
2<br />
the <strong>clustering</strong><br />
be d<br />
.<br />
K<br />
of<br />
p / 2<br />
a sample<br />
result.<br />
from its<br />
, where p is the dimension<br />
corresponding<br />
of<br />
cluster center<br />
d K decreases as K increases<br />
the data samples.<br />
The jump value of transformed distortion<br />
(Assume d<br />
0<br />
0 when computing<br />
J<br />
1<br />
.)<br />
is<br />
J<br />
K<br />
d<br />
p / 2<br />
K<br />
d<br />
p / 2<br />
K 1<br />
.<br />
The peak of the jump values corresponds to the K that provides the best description of<br />
the original samples.
How to set k in k-<strong>means</strong> <strong>clustering</strong><br />
• Another example<br />
– Higher dimension data set<br />
In class, I often talk about a training set of 4 billion<br />
vectors, each having 4000 features…<br />
And yet, all the examples we have seen are 2-d or, as<br />
in the case of the “bonus” examples in the Lecture<br />
20 notes, 3-d<br />
Let us look at the results of processing a high<br />
dimensional data set!
How to set k in k-<strong>means</strong> <strong>clustering</strong><br />
• 17-dimensional data set; i.e., p=17<br />
• 12,000 vectors<br />
• The data set has 21 groups<br />
– Group 0 has prior probability 0.20<br />
– The remaining 20 groups have equal probability (0.04)<br />
• Each group has the same Gaussian density that differs only in<br />
the group mean<br />
• The group covariance matrix is the identity matrix; i.e.,<br />
features are pairwise uncorrelated
Results<br />
• Run k-<strong>means</strong> for K=1, 2, …, 25<br />
• After each run,<br />
– Compute the mean squared distance to the<br />
corresponding cluster center as the total<br />
distortion<br />
– Compute transformed distortion<br />
– Compute the jump of the transformed distortion<br />
– Compute the inverse of the distortion (for<br />
comparison)<br />
– Compute the jump of the inverted distortion
Distortion<br />
34<br />
32<br />
30<br />
28<br />
26<br />
24<br />
22<br />
20<br />
18<br />
16<br />
0 5 10 15 20 25<br />
Number of Clusters
Transformed<br />
Distortion<br />
4.5E-11<br />
4E-11<br />
3.5E-11<br />
3E-11<br />
2.5E-11<br />
2E-11<br />
1.5E-11<br />
1E-11<br />
5E-12<br />
0<br />
0 5 10 15 20 25<br />
Number of Clusters<br />
Inverted<br />
Distortion<br />
0.065<br />
0.06<br />
0.055<br />
0.05<br />
0.045<br />
0.04<br />
0.035<br />
0.03<br />
0 5 10 15 20 25<br />
Number of Clusters
0.065<br />
0.06<br />
Inverted<br />
Distortion<br />
0.055<br />
0.05<br />
0.045<br />
0.04<br />
0.035<br />
0.03<br />
Using the inverted distortion,<br />
the best choice is K=1<br />
0.035<br />
0.03<br />
0 5 10 15 20 25<br />
Number of Clusters<br />
Jump of<br />
Inverted<br />
Distortion<br />
0.025<br />
0.02<br />
0.015<br />
0.01<br />
0.005<br />
0<br />
-0.005<br />
0 5 10 15 20 25<br />
Number of Clusters
4.5E-11<br />
4E-11<br />
3.5E-11<br />
Transformed<br />
Distortion<br />
3E-11<br />
2.5E-11<br />
2E-11<br />
1.5E-11<br />
1E-11<br />
5E-12<br />
Using the inverted distortion,<br />
the best choice is K=25!<br />
0<br />
1E-11<br />
0 5 10 15 20 25<br />
Number of Clusters<br />
8E-12<br />
Jump of<br />
Transformed<br />
Distortion<br />
6E-12<br />
4E-12<br />
2E-12<br />
0<br />
-2E-12<br />
0 5 10 15 20 25<br />
-4E-12<br />
Number of Clusters
Results<br />
• I expect to see the jump value of the transformed distortion<br />
to peak at K=21<br />
• I did not get what I expected to see<br />
• Although not shown here, two other examples show similar<br />
results
Discussion<br />
• We note that the results are subject to sampling errors (also<br />
see the “bonus” 4-group 2d example in the Lecture 20 notes)<br />
• The jump value of the transformed distortion does get us to<br />
the neighborhood of correct K (the high values are at K=17,<br />
20, 22, 25)<br />
• Because the peak occurs at K=25, we really should have ran a<br />
few more runs at larger values of K<br />
• By comparison, the jump value of the inverted distortion<br />
selected a one-cluster result as best description