Full Text - Chemical Science Transactions
Full Text - Chemical Science Transactions
Full Text - Chemical Science Transactions

Create successful ePaper yourself
Turn your PDF publications into a flip-book with our unique Google optimized e-Paper software.
418 Chem Sci Trans., 2013, 2(2), 413-422<br />
The surface of the acrylic acid (AA) treated fiber appears to be moderately roughened<br />
by the chemical treatments. Besides, the individual ultimate fibers also show a slight<br />
separation. This is possibly due to the removal of fibers external surface layer through<br />
dissolution in sodium hydroxide and acrylic acid during the stage of treatment.<br />
IR spectra<br />
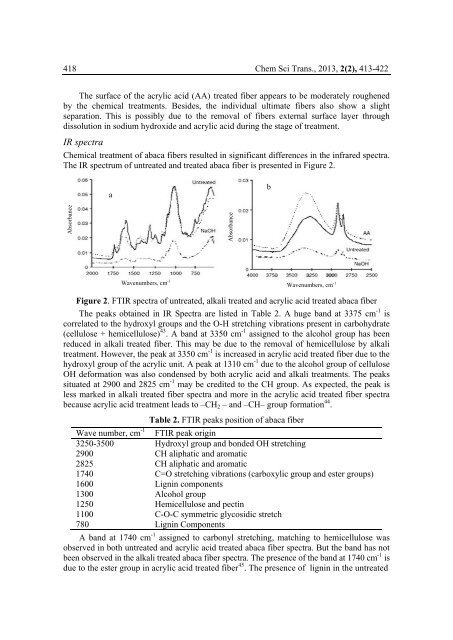
<strong>Chemical</strong> treatment of abaca fibers resulted in significant differences in the infrared spectra.<br />
The IR spectrum of untreated and treated abaca fiber is presented in Figure 2.<br />
a<br />
b<br />
Absorbance<br />
Absorbance<br />
Wavenumbers, cm -1 Wavenumbers, cm -1<br />
Figure 2. FTIR spectra of untreated, alkali treated and acrylic acid treated abaca fiber<br />
The peaks obtained in IR Spectra are listed in Table 2. A huge band at 3375 cm -1 is<br />
correlated to the hydroxyl groups and the O-H stretching vibrations present in carbohydrate<br />
(cellulose + hemicellulose) 43 . A band at 3350 cm -1 assigned to the alcohol group has been<br />
reduced in alkali treated fiber. This may be due to the removal of hemicellulose by alkali<br />
treatment. However, the peak at 3350 cm -1 is increased in acrylic acid treated fiber due to the<br />
hydroxyl group of the acrylic unit. A peak at 1310 cm -1 due to the alcohol group of cellulose<br />
OH deformation was also condensed by both acrylic acid and alkali treatments. The peaks<br />
situated at 2900 and 2825 cm -1 may be credited to the CH group. As expected, the peak is<br />
less marked in alkali treated fiber spectra and more in the acrylic acid treated fiber spectra<br />
because acrylic acid treatment leads to –CH 2 – and –CH– group formation 44 .<br />
Table 2. FTIR peaks position of abaca fiber<br />
Wave number, cm -1 FTIR peak origin<br />
3250-3500 Hydroxyl group and bonded OH stretching<br />
2900 CH aliphatic and aromatic<br />
2825 CH aliphatic and aromatic<br />
1740 C=O stretching vibrations (carboxylic group and ester groups)<br />
1600 Lignin components<br />
1300 Alcohol group<br />
1250 Hemicellulose and pectin<br />
1100 C-O-C symmetric glycosidic stretch<br />
780 Lignin Components<br />
A band at 1740 cm -1 assigned to carbonyl stretching, matching to hemicellulose was<br />
observed in both untreated and acrylic acid treated abaca fiber spectra. But the band has not<br />
been observed in the alkali treated abaca fiber spectra. The presence of the band at 1740 cm -1 is<br />
due to the ester group in acrylic acid treated fiber 45 . The presence of lignin in the untreated