novel spectrophotometric methods for the quantitative analysis of ...
novel spectrophotometric methods for the quantitative analysis of ...
novel spectrophotometric methods for the quantitative analysis of ...
- No tags were found...

Create successful ePaper yourself
Turn your PDF publications into a flip-book with our unique Google optimized e-Paper software.
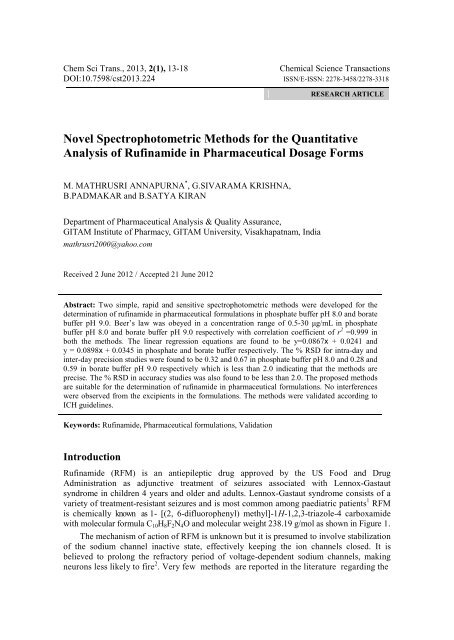
Chem Sci Trans., 2013, 2(1), 13-18<br />
Chemical Science Transactions<br />
DOI:10.7598/cst2013.224 ISSN/E-ISSN: 2278-3458/2278-3318<br />
RESEARCH ARTICLE<br />
Novel Spectrophotometric Methods <strong>for</strong> <strong>the</strong> Quantitative<br />
Analysis <strong>of</strong> Rufinamide in Pharmaceutical Dosage Forms<br />
M. MATHRUSRI ANNAPURNA * , G.SIVARAMA KRISHNA,<br />
B.PADMAKAR and B.SATYA KIRAN<br />
Department <strong>of</strong> Pharmaceutical Analysis & Quality Assurance,<br />
GITAM Institute <strong>of</strong> Pharmacy, GITAM University, Visakhapatnam, India<br />
mathrusri2000@yahoo.com<br />
Received 2 June 2012 / Accepted 21 June 2012<br />
Abstract: Two simple, rapid and sensitive <strong>spectrophotometric</strong> <strong>methods</strong> were developed <strong>for</strong> <strong>the</strong><br />
determination <strong>of</strong> rufinamide in pharmaceutical <strong>for</strong>mulations in phosphate buffer pH 8.0 and borate<br />
buffer pH 9.0. Beer’s law was obeyed in a concentration range <strong>of</strong> 0.5-30 μg/mL in phosphate<br />
buffer pH 8.0 and borate buffer pH 9.0 respectively with correlation coefficient <strong>of</strong> r 2 =0.999 in<br />
both <strong>the</strong> <strong>methods</strong>. The linear regression equations are found to be y=0.0867x + 0.0241 and<br />
y = 0.0898x + 0.0345 in phosphate and borate buffer respectively. The % RSD <strong>for</strong> intra-day and<br />
inter-day precision studies were found to be 0.32 and 0.67 in phosphate buffer pH 8.0 and 0.28 and<br />
0.59 in borate buffer pH 9.0 respectively which is less than 2.0 indicating that <strong>the</strong> <strong>methods</strong> are<br />
precise. The % RSD in accuracy studies was also found to be less than 2.0. The proposed <strong>methods</strong><br />
are suitable <strong>for</strong> <strong>the</strong> determination <strong>of</strong> rufinamide in pharmaceutical <strong>for</strong>mulations. No interferences<br />
were observed from <strong>the</strong> excipients in <strong>the</strong> <strong>for</strong>mulations. The <strong>methods</strong> were validated according to<br />
ICH guidelines.<br />
Keywords: Rufinamide, Pharmaceutical <strong>for</strong>mulations, Validation<br />
Introduction<br />
Rufinamide (RFM) is an antiepileptic drug approved by <strong>the</strong> US Food and Drug<br />
Administration as adjunctive treatment <strong>of</strong> seizures associated with Lennox-Gastaut<br />
syndrome in children 4 years and older and adults. Lennox-Gastaut syndrome consists <strong>of</strong> a<br />
variety <strong>of</strong> treatment-resistant seizures and is most common among paediatric patients 1 RFM<br />
is chemically known as 1- [(2, 6-difluorophenyl) methyl]-1H-1,2,3-triazole-4 carboxamide<br />
with molecular <strong>for</strong>mula C 10 H 8 F 2 N 4 O and molecular weight 238.19 g/mol as shown in Figure 1.<br />
The mechanism <strong>of</strong> action <strong>of</strong> RFM is unknown but it is presumed to involve stabilization<br />
<strong>of</strong> <strong>the</strong> sodium channel inactive state, effectively keeping <strong>the</strong> ion channels closed. It is<br />
believed to prolong <strong>the</strong> refractory period <strong>of</strong> voltage-dependent sodium channels, making<br />
neurons less likely to fire 2 . Very few <strong>methods</strong> are reported in <strong>the</strong> literature regarding <strong>the</strong>
14 Chem Sci Trans., 2013, 2(1), 13-18<br />
clinical studies and no stability indicating method is available in <strong>the</strong> <strong>of</strong>ficial compendia<br />
using HPLC <strong>for</strong> analysing RFM in dosage <strong>for</strong>ms. Analytical <strong>methods</strong> <strong>for</strong> RFM from<br />
pharmaceutical dosage <strong>for</strong>m should be developed and validated. To date, all analytical<br />
<strong>methods</strong> described in literature <strong>for</strong> <strong>the</strong> determination <strong>of</strong> RFM in biological fluids involve<br />
liquid chromatography 3-7 and liquid chromatography–mass spectrometry <strong>methods</strong> 8-9 .<br />
Figure 1. Chemical structure <strong>of</strong> rufinamide<br />
Experimental<br />
A double beam UV-Vis spectrophotometer (UV-1800, Shimadzu, Japan) connected to<br />
computer loaded with spectra manager s<strong>of</strong>tware UV Probe was employed with spectral<br />
bandwidth <strong>of</strong> 1nm and wavelength accuracy <strong>of</strong> ±0.3 nm with a pair <strong>of</strong> 10 mm matched<br />
quartz cells. All weights were taken on electronic balance (Denver, Germany). For scanning,<br />
<strong>the</strong> wavelength range selected was from 400 nm to 200 nm with medium scanning speed.<br />
All experiments were per<strong>for</strong>med at room temperature (25±1) °C.<br />
Reagents and chemicals<br />
Rufinamide standard (purity ≥ 98.0%) was obtained from Eisai Pharmaceuticals<br />
(Visakhapatnam, India). Rufinamide is available commercially with brand names<br />
Pr BANZEL ® and BANZEL ® (containing 100, 200 and 400 mg <strong>of</strong> <strong>the</strong> drug content)<br />
respectively and were procured from <strong>the</strong> local market.<br />
Preparation <strong>of</strong> stock and sample solution<br />
The standard solution <strong>of</strong> rufinamide was prepared by dissolving accurately about 25 mg <strong>of</strong><br />
<strong>the</strong> rufinamide with acetonitrile in a 25 mL volumetric flask.<br />
Preparation <strong>of</strong> phosphate buffer (0.02 M) pH 8.0<br />
50 mL <strong>of</strong> 0.2 M potassium di hydrogen phosphate was mixed with 46.8 mL <strong>of</strong> 0.2 M sodium<br />
hydroxide and sufficient water to make up to volume in a 500 volumetric flask.<br />
Preparation <strong>of</strong> borate buffer (pH 9.0)<br />
6.2 g <strong>of</strong> Boric acid was dissolved in 500 mL <strong>of</strong> water and pH was adjusted to 9.0 with 1.0 M<br />
sodium hydroxide and diluted with water in a 1000 mL volumetric flask. The stock solution<br />
was fur<strong>the</strong>r diluted with phosphate buffer pH 8.0 and borate buffer pH 9.0 <strong>for</strong> method A and<br />
method B (0.5-30 µg/mL) to obtain required sample solutions.<br />
Procedure<br />
Method A<br />
The drug solution was scanned (200-400 nm) against reagent blank (phosphate buffer pH<br />
8.0) and <strong>the</strong> absorption spectrum (Figure 2) was recorded. The absorption maximum (λ max )<br />
was observed at 206 nm. A series <strong>of</strong> solutions (0.5-30 µg/mL) were prepared and <strong>the</strong><br />
absorbance <strong>of</strong> <strong>the</strong>se solutions was recorded at that λ max .
Chem Sci Trans., 2013, 2(1), 13-18 15<br />
1.800<br />
1.500<br />
Abs<br />
1.000<br />
0.500<br />
0.000<br />
200.00 220.00 240.00 260.00 275.00<br />
nm<br />
Figure 2. Absorption spectrum <strong>of</strong> rufinamide (20 µg/mL) in phosphate buffer (pH 8.0)<br />
A graph was plotted by taking <strong>the</strong> concentration <strong>of</strong> <strong>the</strong> solutions on <strong>the</strong> x-axis and <strong>the</strong><br />
corresponding absorbance values on <strong>the</strong> y-axis (Figure 3).<br />
Absorbance<br />
Figure 3. Calibration curve <strong>of</strong> rufinamide (Phosphate buffer pH 8.0)<br />
Method B<br />
The drug solution was scanned (200-400 nm) against reagent blank (borate buffer pH 9.0)<br />
and <strong>the</strong> absorption spectrum was recorded (Figure 4). A series <strong>of</strong> solutions (0.5-30 µg/mL)<br />
were prepared and <strong>the</strong> absorbance <strong>of</strong> <strong>the</strong>se solutions was recorded at that λ max .<br />
1.900<br />
Conc, µg/mL<br />
1.500<br />
Abs<br />
1.000<br />
0.500<br />
0.000<br />
200.00 220.00 240.00 260.00 280.00<br />
nm<br />
Figure 4. Absorption spectrum <strong>of</strong> rufinamide (20 µg/mL) in borate buffer (pH 9.0)
16 Chem Sci Trans., 2013, 2(1), 13-18<br />
A graph was plotted by taking <strong>the</strong> concentration <strong>of</strong> <strong>the</strong> solutions on <strong>the</strong> x-axis and <strong>the</strong><br />
corresponding absorbance values on <strong>the</strong> y-axis (Figure 5).<br />
Absorbance<br />
Conc, µg/mL<br />
Figure 5. Calibration curve <strong>of</strong> rufinamide (Borate buffer pH 9.0)<br />
Assay <strong>of</strong> commercial <strong>for</strong>mulations (Tablets)<br />
Rufinamide is available in <strong>the</strong> local market with brand names BANZEL (100, 200 and 400 mg.)<br />
and Pr BANZEL ® (100, 200 and 400 mg.) were purchased. Twenty tablets were collected<br />
each brand, powdered and powder equivalent to 25 mg <strong>of</strong> <strong>the</strong> drug was weighed, extracted<br />
with acetonitrile separately, sonicated and make up to volume in two different 25 mL<br />
volumetric flasks (1 mg/mL) and filtered. Fur<strong>the</strong>r dilutions were made from this stock<br />
solution with phosphate buffer and borate buffer <strong>for</strong> method A and B and analyzed<br />
according to <strong>the</strong> recommended procedure.<br />
Precision and accuracy<br />
The precision study was done by recording <strong>the</strong> absorbance <strong>of</strong> six replicates (20 μg/mL)<br />
<strong>for</strong> method A and B and <strong>the</strong> % RSD was calculated. Accuracy was evaluated by <strong>the</strong><br />
recovery studies by <strong>the</strong> addition <strong>of</strong> 80%, 100% and 120% <strong>of</strong> pure drug solution to <strong>the</strong><br />
pre-analysed <strong>for</strong>mulation solution. For <strong>the</strong> present study RFM drug solution extracted<br />
from <strong>the</strong> <strong>for</strong>mulation was taken and 80%, 100% and 120% <strong>of</strong> pure drug solution (i.e. 8,<br />
10 and 12 μg/mL) were added to <strong>the</strong> 10 μg/mL and <strong>the</strong> % RSD was calculated.<br />
Results and Discussion<br />
The optical characteristics <strong>of</strong> <strong>the</strong> proposed <strong>methods</strong> were shown in Table 1. Beer’s law was<br />
obeyed in <strong>the</strong> concentration range <strong>of</strong> 0.5-30 µg/mL and 0.5-30 µg/mL <strong>for</strong> <strong>the</strong> <strong>methods</strong> A and<br />
B respectively. The linear regression equations were found to be y = 0.0867x + 0.0241 and y<br />
= 0.0898x + 0.0345 <strong>for</strong> method A and B respectively with correlation coefficient 0.9998 and<br />
0.9996 respectively <strong>for</strong> both <strong>methods</strong>.<br />
The % RSD values <strong>for</strong> precision and accuracy studies <strong>of</strong> both <strong>the</strong> <strong>methods</strong> were found<br />
to be (RSD
Chem Sci Trans., 2013, 2(1), 13-18 17<br />
Brand<br />
Table 1. Optical characteristics <strong>of</strong> rufinamide<br />
Parameters<br />
A<br />
Method<br />
Beer’s Law limit, µg/mL 0.5-30 0.5-30<br />
λ, nm 206 206<br />
Molar extinction coefficient<br />
(Litre/mol -1 .cm -1 )<br />
2.172292×10 4 2.227076×10 4<br />
Sandell’s sensitivity<br />
(µg/cm 2 /0.001absorbance unit)<br />
0.01096 0.01069<br />
Regression equation (Y*)<br />
Slope (a) 0.0867 0.0898<br />
Intercept (b) 0.0241 0.0345<br />
Correlation coefficient 0.9998 0.9996<br />
Table 2 Analysis <strong>of</strong> rufinamide commercial <strong>for</strong>mulation (Tablets)<br />
Labeled<br />
Amount<br />
mg<br />
* Amount obtained, mg % Recovery * % RSD *<br />
Method Method Method<br />
A B A B A B<br />
Pr BANZEL ® 400 386.6 389.4 96.65 97.35 0.35 0.46<br />
BANZEL ® 400 388.5 389.6 97.12 97.4 0.28 0.65<br />
Conclusion<br />
* Mean <strong>of</strong> three determinations<br />
The present <strong>methods</strong> can be employed <strong>for</strong> <strong>the</strong> determination <strong>of</strong> rufinamide in pharmaceutical<br />
<strong>for</strong>mulations successfully and <strong>the</strong>re is no interference <strong>of</strong> excipients during <strong>the</strong> study.<br />
Acknowledgement<br />
The authors are grateful <strong>of</strong> M/S GITAM Institute <strong>of</strong> Pharmacy, GITAM University,<br />
Visakhapatnam, India <strong>for</strong> providing research facilities and also to Eisai Pharmaceuticals<br />
(India) <strong>for</strong> providing <strong>the</strong> gift samples <strong>of</strong> <strong>the</strong> drug.<br />
References<br />
1. The Merck Index, Merck Research Laboratories, Whitehouse Station, NJ, 2006.<br />
2. McLean M J, Schmutz M, Pozza M and Wamil A, Epilepsia., 2005. 46(Suppl 8), 296.<br />
3. Brunner L A and Powell M L, Biomed Chromatogr., 1992, 6, 278-282.<br />
4. Rouan M C, Souppart C, Alif L, Moes D, Lecaillon J B and Gobillon J, J Chromatogr<br />
B Biomed Appl., 1995, 667(2), 307-313.<br />
5. Rouan M C, Buffet C, Masson L, Marfil F, Humbert H and Maurer G, J Chromatogr<br />
B Biomed Sci Appl., 2001, 754, 45.<br />
6. Contin M, Mohamed S, Candela C, Albani F, Riva R and Baruzzi A, J Chromatogr<br />
B Analyt Technol Biomed Life Sci., 2010, 878, 461.<br />
7. Iolanda Mazzucchelli, Manuela Rapetti, Cinzia Fattore, Valentina Franco, Giuliana<br />
Gatti and Emilio Perucca Anal Bioanal Chem., 2011, 401(3), 1013-1021.<br />
B
18 Chem Sci Trans., 2013, 2(1), 13-18<br />
8. Giancarlo la Marca, Sabrina Malvagia, Luca Filippi, Marzia Innocenti, Anna Rosati,<br />
Melania Falchi, Simona Pellacani, Gloriano Moneti and Renzo Guerrini, J Pharm<br />
Biomed Anal., 2011, 54(1), 192-197.<br />
9. Kwon-Bok Kim, Kyung-Ah. Seo, Sung-Eun Kim, Soo Kyung Bae, Dong-Hyun Kim<br />
and Jae-Gook Shin, J Pharm Biomed Anal., 2011, 56(4), 771-777.<br />
10. ICH Stability Testing <strong>of</strong> New Drug Substances and Products Q1A (R2), International<br />
Conference on Harmonization, 2003.<br />
11. ICH Validation <strong>of</strong> analytical procedures: Text and methodology Q2(R1),<br />
International Conference on Harmonization, 2005.