Fuzzy Models for Teaching Assessment
- No tags were found...

You also want an ePaper? Increase the reach of your titles
YUMPU automatically turns print PDFs into web optimized ePapers that Google loves.
Research Inventy: International Journal of Engineering And Science<br />
Vol.5, Issue 8 (August 2015), PP -06-12<br />
Issn (e): 2278-4721, Issn (p):2319-6483, www.researchinventy.com<br />
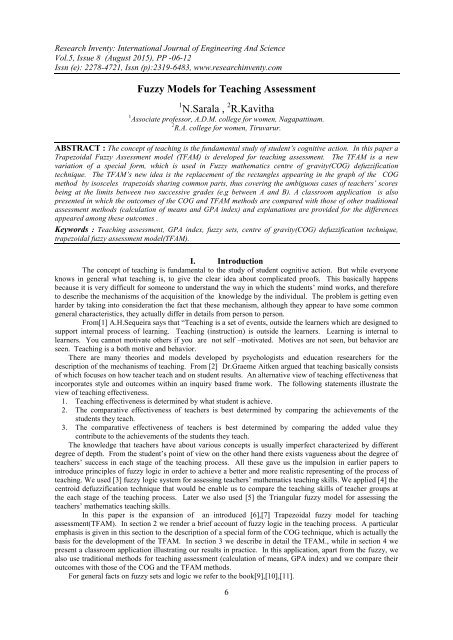
<strong>Fuzzy</strong> <strong>Models</strong> <strong>for</strong> <strong>Teaching</strong> <strong>Assessment</strong><br />
1 N.Sarala , 2 R.Kavitha<br />
1 Associate professor, A.D.M. college <strong>for</strong> women, Nagapattinam.<br />
2 R.A. college <strong>for</strong> women, Tiruvarur.<br />
ABSTRACT : The concept of teaching is the fundamental study of student’s cognitive action. In this paper a<br />
Trapezoidal <strong>Fuzzy</strong> <strong>Assessment</strong> model (TFAM) is developed <strong>for</strong> teaching assessment. The TFAM is a new<br />
variation of a special <strong>for</strong>m, which is used in <strong>Fuzzy</strong> mathematics centre of gravity(COG) defuzzification<br />
technique. The TFAM’s new idea is the replacement of the rectangles appearing in the graph of the COG<br />
method by isosceles trapezoids sharing common parts, thus covering the ambiguous cases of teachers’ scores<br />
being at the limits between two successive grades (e.g between A and B). A classroom application is also<br />
presented in which the outcomes of the COG and TFAM methods are compared with those of other traditional<br />
assessment methods (calculation of means and GPA index) and explanations are provided <strong>for</strong> the differences<br />
appeared among these outcomes .<br />
Keywords : <strong>Teaching</strong> assessment, GPA index, fuzzy sets, centre of gravity(COG) defuzzification technique,<br />
trapezoidal fuzzy assessment model(TFAM).<br />
I. Introduction<br />
The concept of teaching is fundamental to the study of student cognitive action. But while everyone<br />
knows in general what teaching is, to give the clear idea about complicated proofs. This basically happens<br />
because it is very difficult <strong>for</strong> someone to understand the way in which the students’ mind works, and there<strong>for</strong>e<br />
to describe the mechanisms of the acquisition of the knowledge by the individual. The problem is getting even<br />
harder by taking into consideration the fact that these mechanism, although they appear to have some common<br />
general characteristics, they actually differ in details from person to person.<br />
From[1] A.H.Sequeira says that “<strong>Teaching</strong> is a set of events, outside the learners which are designed to<br />
support internal process of learning. <strong>Teaching</strong> (instruction) is outside the learners. Learning is internal to<br />
learners. You cannot motivate others if you are not self –motivated. Motives are not seen, but behavior are<br />
seen. <strong>Teaching</strong> is a both motive and behavior.<br />
There are many theories and models developed by psychologists and education researchers <strong>for</strong> the<br />
description of the mechanisms of teaching. From [2] Dr.Graeme Aitken argued that teaching basically consists<br />
of which focuses on how teacher teach and on student results. An alternative view of teaching effectiveness that<br />
incorporates style and outcomes within an inquiry based frame work. The following statements illustrate the<br />
view of teaching effectiveness.<br />
1. <strong>Teaching</strong> effectiveness is determined by what student is achieve.<br />
2. The comparative effectiveness of teachers is best determined by comparing the achievements of the<br />
students they teach.<br />
3. The comparative effectiveness of teachers is best determined by comparing the added value they<br />
contribute to the achievements of the students they teach.<br />
The knowledge that teachers have about various concepts is usually imperfect characterized by different<br />
degree of depth. From the student’s point of view on the other hand there exists vagueness about the degree of<br />
teachers’ success in each stage of the teaching process. All these gave us the impulsion in earlier papers to<br />
introduce principles of fuzzy logic in order to achieve a better and more realistic representing of the process of<br />
teaching. We used [3] fuzzy logic system <strong>for</strong> assessing teachers’ mathematics teaching skills. We applied [4] the<br />
centroid defuzzification technique that would be enable us to compare the teaching skills of teacher groups at<br />
the each stage of the teaching process. Later we also used [5] the Triangular fuzzy model <strong>for</strong> assessing the<br />
teachers’ mathematics teaching skills.<br />
In this paper is the expansion of an introduced [6],[7] Trapezoidal fuzzy model <strong>for</strong> teaching<br />
assessment(TFAM). In section 2 we render a brief account of fuzzy logic in the teaching process. A particular<br />
emphasis is given in this section to the description of a special <strong>for</strong>m of the COG technique, which is actually the<br />
basis <strong>for</strong> the development of the TFAM. In section 3 we describe in detail the TFAM., while in section 4 we<br />
present a classroom application illustrating our results in practice. In this application, apart from the fuzzy, we<br />
also use traditional methods <strong>for</strong> teaching assessment (calculation of means, GPA index) and we compare their<br />
outcomes with those of the COG and the TFAM methods.<br />
For general facts on fuzzy sets and logic we refer to the book[9],[10],[11].<br />
6
<strong>Fuzzy</strong> <strong>Models</strong> For <strong>Teaching</strong>…<br />
II.<strong>Fuzzy</strong> models <strong>for</strong> the learning process<br />
Kuhs and Ball (1986) [8] developed a model <strong>for</strong> teaching mathematics. We used this model [3] to<br />
apply the fuzzy system <strong>for</strong> assessing the teachers’ mathematics teaching skills using possibilities and<br />
probabilities of teachers’ profile. Later we applied [4] total possibilistic uncertainty and centre of gravity(COG)<br />
defuzzification technique to provide an alternative measure <strong>for</strong> the teaching assessment. According to the COG<br />
technique the defuzzification of a fuzzy situation’s data is succeeded through the calculation of the coordinates<br />
of the COG of the level’s area contained between the graph of the membership function associated with this<br />
situation and the OX axis. In order to be able to design the graph of the membership function we correspond to<br />
each an interval of values from a prefixed numerical distribution, which actually means that we replace<br />
with a set of real intervals. A brief description of the special <strong>for</strong>m of the COG method applied <strong>for</strong> the learning<br />
assessment [3],[4] is the following:<br />
Let<br />
be a set of linguistic characterizing <strong>for</strong> the faculties’ per<strong>for</strong>mance, when A<br />
stands <strong>for</strong> excellent, B <strong>for</strong> very good, C <strong>for</strong> good, D <strong>for</strong> mediocre and F <strong>for</strong> unsatisfactory respectively.<br />
Obviously, the above characterizations are fuzzy depending on the modeler’s personal criteria, which<br />
however must be compatible to the common logic, in order to model the teaching situation in a worthy of credit<br />
way. We have adopted Bhavika tailor et.al’s model [12] <strong>for</strong> marking the faculty per<strong>for</strong>mance. For example,<br />
these criteria can be <strong>for</strong>med by marking the faculties’ per<strong>for</strong>mance in the corresponding students’ feedback and<br />
questioners within a scale from 0 to 100 and by assigning to their scores the above characterizations as follows:<br />
and less than 50. Assume now that we want to<br />
assess the general per<strong>for</strong>mance of a group, say G, of n faculties, where n is an integer, . For this, we<br />
represent G as a fuzzy subset of U. In fact, if , and denote the number of faculties that<br />
demonstrated excellent, very good, good, mediocre and unsatisfactory per<strong>for</strong>mance respectively, we define the<br />
in terms of the frequencies, i.e., by<br />
<strong>for</strong> each x in U. Then G<br />
can be written as a fuzzy subset of U in the <strong>for</strong>m:<br />
Next we replace U with a set of real intervals as follows:<br />
Consequently, we have that<br />
<strong>for</strong> all x in <strong>for</strong> all lx in <strong>for</strong> all x in<br />
<strong>for</strong> all x in <strong>for</strong> all x in Since the membership<br />
values of the elements of U in G have been defined in terms of the corresponding frequencies, we obviously<br />
have that<br />
(1)<br />
We are now in position to construct the graph of the membership function , which has the<br />
<strong>for</strong>m of the bar graph shown in ;Figure 1. From Figure 1 one can easily observe that the level’s area, say S,<br />
contained between the bar graph of and the OX axis is equal to the sum of the areas of five rectangles<br />
The one side of each one of these rectangles has length 1 unit and lies on the OX axis.<br />
Figure 1 : Bar graphical data representation<br />
It is well known (e.g. see[13]) that the coordinates of the COG, say of the level’s area S are<br />
calculated by the <strong>for</strong>mulas:<br />
Taking into account the situation presented by figure 1 and equation (1) it is straight<strong>for</strong>ward to check that in our<br />
case <strong>for</strong>mulas (2) can be trans<strong>for</strong>med to the <strong>for</strong>m:<br />
7
<strong>Fuzzy</strong> <strong>Models</strong> For <strong>Teaching</strong>…<br />
In fact, is the area of S which is in our case is equal to<br />
(3)<br />
Also<br />
Now using elementary algebraic inequalities it is easy to check that there is a unique minimum <strong>for</strong><br />
corresponding COG<br />
(an analogous process <strong>for</strong> TFAM is described in detail in section 3). Further, the<br />
ideal case is when = Then from <strong>for</strong>mulas (3) we get and<br />
There<strong>for</strong>e the COG in this case is the point On the other hand the worst case is when and<br />
. Then from <strong>for</strong>mulas (3) we find that the COG is the point . There<strong>for</strong>e the<br />
COG of the level’s section F lies in the area of the triangle<br />
Then by elementary geometric observations (an analogous process <strong>for</strong> TFAM is described in detail in section<br />
3) one can obtain the following criterion:<br />
Between two faculty groups the group with the bigger per<strong>for</strong>ms better.<br />
If the two groups have the same , then the group with the bigger per<strong>for</strong>ms better.<br />
If the two groups have the same , then the group with the lower per<strong>for</strong>ms better.<br />
Recently we [5] developed a new variation of the COG method <strong>for</strong> teaching assessment, which they called<br />
Triangular <strong>Fuzzy</strong> Model(TFM). The main idea of TFM is to replace the rectangles appearing in the graph of<br />
the COG method (figure 1) by isosceles triangles sharing common parts, so that to cover the ambiguous cases<br />
of faculty scores being at the limits between two successive grades.<br />
III. The trapezoidal fuzzy assessment model(TFAM)<br />
The TFAM is a new variation of the presented in the previous section COG method. The novelty of the<br />
approach is in the replacement of the rectangles appearing in the graph of the membership function of the COG<br />
method (figure1) by isosceles trapezoids sharing common parts, so that to cover the ambiguous cases of<br />
faculties scores being at the limits between two successive grades. Here we shall present an enhanced version of<br />
the TFAM. In the TFAM’s scheme (figure 2) we have five trapezoids, corresponding to the faculties’ grades<br />
F,D,C,B and A respectively defined in the previous section. Without loss of generality and <strong>for</strong> making our<br />
calculations easier we consider isosceles trapezoids with the bases of length 10 units lying on the OX axis. The<br />
height of the each trapezoid is equal to the percentage of faculties who achieved the corresponding grade , while<br />
the parallel to its base side is equal to 4 units. We allow <strong>for</strong> any two adjacent trapezoids to have 30% of their<br />
bases (3 units) belonging to both of them. In this way we cover the ambiguous cases of faculties scores being at<br />
the limits between two successive grades. It is a very common approach to divide the interval of the specific<br />
grades in three parts and to assign the corresponding grade using + and -. For example, 75-77=B-, 78-81=B, 82-<br />
84=B+. however, this consideration does not reflect the common situation, where the student is not sure about<br />
the grading of the faculties whose per<strong>for</strong>mance could be assessed as marginal between and close to two adjacent<br />
grades; <strong>for</strong> example, something like 84-85 being between B+ and A. The TFAM fits this situation.<br />
8
<strong>Fuzzy</strong> <strong>Models</strong> For <strong>Teaching</strong>…<br />
Figure 2:The TFAM’s schemes<br />
A faculty group can be represented, as in the COG method, as a fuzzy set bin U, whose membership<br />
function has the graph the line of figure 2, which is the<br />
union of the line segments<br />
However, in case of the TFAM the analytical <strong>for</strong>m<br />
of is not needed <strong>for</strong> calculating the COG of the resulting area. In fact, since the marginal cases of the<br />
faculties scores are considered as common parts <strong>for</strong> any pair of the adjacent trapezoids, it is logical to count<br />
these parts twice; e.g. placing the ambiguous cases B+ and A- in both regions B and A. In other words, the<br />
COG methods, which calculates the coordinates of the COG of the area between the graph of the membership<br />
function and the OX axis, thus considering the areas of the “common “ triangles<br />
, only once, is not the proper one to be applied in the above<br />
situation.<br />
Instead , in this case we represent each one of the five trapezoids of figure 2 by its COG<br />
and we consider the entire area, i.e. the sum of the areas of the five trapezoids, as the system of these pointscenters.<br />
More explicitly, the steps of the whole construction of the TFAM are the following:<br />
1.Let<br />
be the percentage of the faculties whose per<strong>for</strong>mance was<br />
characterized by the grades F,D,C, and A respectively; then<br />
2. We consider the isosceles trapezoids with heights being equal to , in the way that has<br />
been illustrated in figure 2.<br />
3.We calculate the coordinates ( of the COG of each trapezoid as follows: It is well<br />
known that the COG of a trapezoid lies along the line segment joining the midpoints of its parallel sides a and b<br />
at a distance d from the longer side b given by<br />
, where h is the height (e.g. see[14]). There<strong>for</strong>e in our<br />
case we have = Also, since the abscissa of the COG of each trapezoid is equal to the abscissa<br />
of the midpoint of its base, it is easy to observe that<br />
4.We consider the system of COG’s i= 1, 2, 3, 4, 5 and we calculate the coordinates ( of the COG<br />
of the whole area S considered in figure 2 by the following <strong>for</strong>mulas ,derived from the commonly used in<br />
such a cases definition(e.g. see [15]):<br />
(4).<br />
In <strong>for</strong>mulas (4) ,I = 1, 2, 3, 4, 5 denote the areas of the corresponding trapezoids. Thus<br />
and<br />
There<strong>for</strong>e, from <strong>for</strong>mulas(4) we finally get that<br />
(5)<br />
5.We determine the area of COG lies as follows: For I j = 1, 2, 3, 4, 5, we have that<br />
, there<strong>for</strong>e , with the equality holding if, and only if .<br />
There<strong>for</strong>e<br />
+2<br />
=5 (6),<br />
9
<strong>Fuzzy</strong> <strong>Models</strong> For <strong>Teaching</strong>…<br />
with the equality holding if, and only if, = = In the case equality the first of<br />
<strong>for</strong>mulas (5) gives that .<br />
Further, combining the inequality (6) with the second of <strong>for</strong>mulas(5) one finds that . There<strong>for</strong>e the<br />
unique minimum <strong>for</strong> corresponds to COG . The ideal case is when =<br />
= . Then from <strong>for</strong>mulas (5) we get that and . There<strong>for</strong>e the COG in<br />
this case is the point (33, ). On the other hand, the worst case is when = 1 and = .<br />
Then from <strong>for</strong>mulas (3), we find that the COG is the point (5, ). There<strong>for</strong>e the area where the COG lies<br />
in the area of the triangle (see figure 3)<br />
1/2 F w F i<br />
F 2 ' F 2<br />
1/10<br />
F 1 ' F 1<br />
F m<br />
0 ½ x c ' 5/2 x c 9/2 x<br />
Figure 3: The area where the COG lies<br />
6.We <strong>for</strong>mulate our criterion <strong>for</strong> comparing the per<strong>for</strong>mances of two (or more) teacher groups’ as follows:<br />
From elementary geometric observations (see figure 3) it follows that <strong>for</strong> two teacher groups the group having<br />
the greater per<strong>for</strong>ms better. Further, if the two groups have the same , then the group having the<br />
COG which is situated closer to is the group with the greater . Also, if the two groups have the same<br />
, then the group having the COG which is situated the farther to is the group with the smaller .<br />
Based on the above considerations it is logical to <strong>for</strong>mulate our criterion <strong>for</strong> comparing the two groups’<br />
per<strong>for</strong>mance in the following <strong>for</strong>m:<br />
Between two teacher groups the group with the greater value of demonstrates the better<br />
per<strong>for</strong>mance.<br />
If two teacher groups have the same , then the group with the greater value of<br />
demonstrates the better per<strong>for</strong>mance.<br />
If two teacher groups have the same , then the group with the smaller value of<br />
demonstrates the better per<strong>for</strong>mance.<br />
IV. A class room application<br />
The faculties of two different departments ( Business administration and Mathematics) of the R.A.<br />
college <strong>for</strong> women, Thiruvarur, handled the classes <strong>for</strong> bachelor of business administration . Both of the faculty<br />
members were taken the papers such as Business mathematics, Business Statistics, Operations research and<br />
Quantitative techniques. We have adopted Bhavika Tailor et.al’s model [12], from that we got the marks <strong>for</strong><br />
both department faculty members which are given below:<br />
Department 1(D1- Mathematics):<br />
10
85,85,75,77,79 ,60,61,63,51,51,50,40,42.<br />
Department 2(D2- Business administration):<br />
90,84,82,74,73,70,59,58,48,45,45.<br />
The results of the faculties’ per<strong>for</strong>mance are summarized in table 1 below:<br />
Table 1: Results of D1and D2<br />
Grade D1 D2<br />
A 2 1<br />
B 3 2<br />
C 3 3<br />
D 3 2<br />
F 2 3<br />
Total 13 11<br />
11<br />
<strong>Fuzzy</strong> <strong>Models</strong> For <strong>Teaching</strong>…<br />
The evaluation of the above results will be per<strong>for</strong>med below using both traditional methods, based on principles<br />
of the classical (bivalent) logic, and fuzzy logic methods.<br />
4.1 Traditional methods<br />
i) Calculations of the means: A straight<strong>for</strong>ward calculation gives that the means of the faculties’ scores<br />
are approximately 63 and 66.18 <strong>for</strong> D1 and D2 respectively. This shows that the mean per<strong>for</strong>mance was good<br />
(C) <strong>for</strong> the both department D1 and D2.<br />
Comparing D1 and D2 ,D2 is better than D1.<br />
ii) Calculation of the GPA index: We recall that the Great Point Average (GPA) index is a weighted<br />
mean, where more importance is given to the higher scores by attaching greater coefficients (weights) to them<br />
(e.g. see [16]). In other words, the GPA index focuses on the quality per<strong>for</strong>mance of a faculty group.<br />
Let us denote by , , , and the numbers of faculties of a given group whose per<strong>for</strong>mance is<br />
characterized by A, B, C, D and F respectively and by n the total number of faculties of the group. Then, the<br />
GPA index is calculated by the <strong>for</strong>mula<br />
GPA = .<br />
Obviously we that 0<br />
. In our case the above <strong>for</strong>mula can be written as GPA=<br />
(7). Then, using the data of table 1 it is easy to check that the GPA <strong>for</strong> D1 is equal to<br />
and <strong>for</strong> D2 is equal to<br />
. There<strong>for</strong>e, since the values of the GPA index are less than the half of<br />
its maximal possible value , which is equal to 4, the quality per<strong>for</strong>mance of D1 was satisfactory and D2 was<br />
less than satisfactory. However, in contrast to their mean per<strong>for</strong>mances, the quality per<strong>for</strong>mance of both D1 and<br />
D2 were good.<br />
4.2 <strong>Fuzzy</strong> logic methods<br />
In this paragraph we shall apply the fuzzy logic methods described in sections 2 and 3 of this paper<br />
as follows:<br />
iii) The COG method: Observing the coefficients of the s, i = 1, 2, 3, 4, 5 in the first of <strong>for</strong>mulas (3) and<br />
taking into account that, according to the criterion stated in section 2, the COG abscissa measures a faculty<br />
group’ per<strong>for</strong>mance, it becomes evident that the COG method is also focused , as the GPA index does, on the<br />
faculty groups’ quality per<strong>for</strong>mance.<br />
In case of our classroom application taking into account the data of table 1 and using the first of<br />
<strong>for</strong>mulas (3) we find that <strong>for</strong> D1 and <strong>for</strong> D2. Since the above value of are<br />
more than the half of its value in the ideal case, which is equal to (see section 2), the quality per<strong>for</strong>mance of<br />
both department according was more than the satisfactory. Further, D1 demonstrated a better quality<br />
per<strong>for</strong>mance than D2.<br />
iv) Application of TFAM: Observing the coefficients of the s, i = 1, 2, 3, 4, 5 in the first of <strong>for</strong>mulas (5)<br />
it is easy to conclude that the COG method is also focused on the faculty groups’ quality per<strong>for</strong>mance.<br />
In case of our classroom application taking into account the data of table 1 and using the first of<br />
<strong>for</strong>mulas (5) we find that <strong>for</strong> D1 and <strong>for</strong> D2. In this case the value of<br />
are more than the half of its value in the ideal case, which is equal to 33 (see section 3), the quality per<strong>for</strong>mance<br />
of both department according was more than the satisfactory. Further, D1 demonstrated a better quality<br />
per<strong>for</strong>mance than D2.<br />
4.3 Comparison of the assessment method used
12<br />
<strong>Fuzzy</strong> <strong>Models</strong> For <strong>Teaching</strong>…<br />
In paragraphs 4.1 and 4.2 we have applied four in total methods <strong>for</strong> learning assessment. The<br />
first of these methods measures the mean per<strong>for</strong>mances of a faculty group, while the other three methods (GPA,<br />
COG, TFAM) measure its quality per<strong>for</strong>mance by assessing greater coefficients (weights) to the higher scores.<br />
The coefficients attached to the ’s in these three methods – see <strong>for</strong>mula(7) and the first of <strong>for</strong>mulas (3) and (5)<br />
respectively are present in the following table 2:<br />
Table2: Weights coefficients of the ’s<br />
GPA COG( ) TFAM( )<br />
0 ½ 7<br />
1 3/2 14<br />
2 5/2 21<br />
3 7/2 28<br />
4 9/2 35<br />
From table 2 becomes evident that TFAM assigns greater coefficients to the higher with respect to the<br />
lower scores than COG and also COG does the same thing with respect to GPA. In other words TFAM is more<br />
accurate than COG, and COG is more accurate than GPA <strong>for</strong> measuring the quality per<strong>for</strong>mance of a faculty<br />
group. This explains why in our classroom application the quality per<strong>for</strong>mance of D1 and D2 were found to<br />
be different. One should also mention that , while D1 demonstrated in all cases(GPA, COG, TFAM) a better<br />
per<strong>for</strong>mance than D2, in contrast to the mean per<strong>for</strong>mance of D2 , which was found to be better than the<br />
corresponding per<strong>for</strong>mance of D1.<br />
In concluding , it is suggested to the user of the above four assessment methods to choose the one that<br />
fits better to his/her personal goals.<br />
V. Conclusion and discussion<br />
The methods <strong>for</strong> assessing a group’s per<strong>for</strong>mance (<strong>for</strong> human activities) usually applied in practice are based<br />
on principles of the bivalent logic (yes-no). However, fuzzy logic, due to its nature of characterizing a situation<br />
with multiple values by using linguistic variables, offers a wider and richer field of resources <strong>for</strong> this purpose.<br />
This gave us the impulsion to introduce in this paper principles of fuzzy logic <strong>for</strong> developing an expanded<br />
version of the TFAM approach <strong>for</strong> teaching assessment. The TFAM is actually a more sensitive version of the<br />
COG fitting better to the ambiguous cases of faculties’ scores lying at the limits between two different grades.<br />
We also presented a classroom application in which we have compared the outcomes of TFAM approach with<br />
the corresponding outcomes of the COG technique and of other traditional assessment methods(calculations<br />
of the means and GPA index).<br />
However, there is a need <strong>for</strong> more classroom applications to be per<strong>for</strong>med in future <strong>for</strong> obtaining safer<br />
statistical data. On the other hand, since the TFAM approach appears to have a potential of general assessment<br />
method , our future research plans include also the ef<strong>for</strong>t to apply this approach <strong>for</strong> assessing the individuals’<br />
per<strong>for</strong>mance in several other human activities.<br />
References<br />
[1] http://ssrn.com/abstract 2150166.<br />
[2] http://www.tki.org.nz/r/governance/ftpp/module2/index_e.php., Gr.Aitken,s The inquiring teacher: clarifying the conceptof<br />
teaching effectiveness<br />
[3] N.Sarala, R.Kavitha, Model Of Mathematics <strong>Teaching</strong>: A <strong>Fuzzy</strong> Set Approach<br />
[4] International organization of scientific research – journal of mathematics ,Jan-Feb 2015,Vol.11,Ver.1 Issue 1, 19-22.<br />
N.Sarala, R.Kavitha, Application of centroid technique and fuzzy measure <strong>for</strong> measuring mathematics teaching<br />
skill,International Journal ofSscience and Research , March 2015, Vol 4 Issue 3,1749-1755<br />
[5] N.Sarala, R.Kavitha, A triangular fuzzy model <strong>for</strong> assessing teachers’ mathematics teaching skills, International journal of<br />
mathematics trends and technology, June 2015, Vol 22, No 1,9-12.<br />
[6] Subbotin, I.Ya. Trapezoidal <strong>Fuzzy</strong> logic model <strong>for</strong> learning assessment, ar XIV 1407.0823[Math .GM], submitted on July 2014.<br />
[7] Subbotin, I.Ya, Michael Gr.k Voskoglou, fuzzy <strong>Models</strong> <strong>for</strong> learning assessment<br />
[8] <strong>Models</strong> of mathematics teaching – CCSU www.math.ccsu.edu/.../ models of mathematics Tea.<br />
[9] Klir. G.j & folger,t.a. (1988), <strong>Fuzzy</strong> sets and uncertainty and in<strong>for</strong>mation, Prentice Hall London.<br />
[10] Klir. G.j/bo yuan, <strong>Fuzzy</strong> sets and fuzzy logic, Theory and applications, Prentice Hall London.(2010)<br />
[11] h.j. zimmermann, <strong>Fuzzy</strong> set theory and its applications, Fourth edition, Springer, New Delhi.<br />
[12] Bhavika Tailor,Rasik shah, Dr.Jayesh Dhodiya, Dr.Dilip Joshi, An evalutation of faculty per<strong>for</strong>mance in teaching using fuzzy<br />
modeling approach, International journal of advance engineering and research development, Volume 1, Issue 3, April 2014,1-6.<br />
[13] Wikipedia, Center of mass: Definition, available in the Web at:http://en.wikipedia.org/wiki/center of mass#definition.<br />
[14] Wikipedia, Trapezoid: Other properties, available in the Web at:http://en.wikipedia.org/wiki/trapezoid# other properties 15.<br />
[15] Wikipedia, Center of mass: A system of particles, available in the Web at:http://en.wikipedia.org/wiki/center of mass#A system<br />
of particles.<br />
[16] Grade point average assessment, available in the web at: http://www.swinburne.edu.au/student-<br />
[17] administration/assessment/gpa.html.