

Siemens CyPT
SJFqg
SJFqg
- No tags were found...

You also want an ePaper? Increase the reach of your titles
YUMPU automatically turns print PDFs into web optimized ePapers that Google loves.
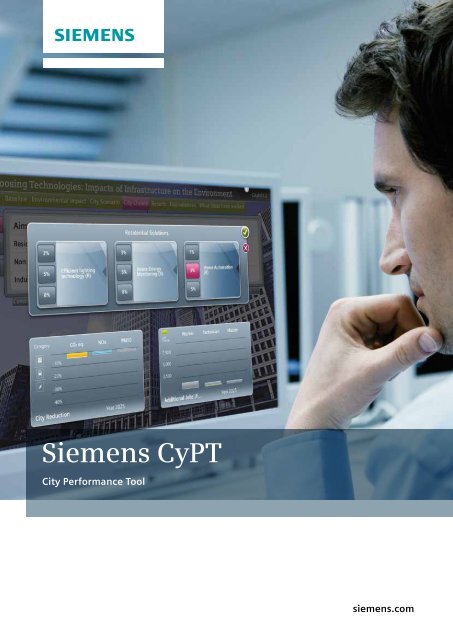
<strong>Siemens</strong> <strong>CyPT</strong><br />
City Performance Tool<br />
siemens.com
<strong>CyPT</strong>: Identifies the right<br />
technologies for your city<br />
Modern cities have an increasingly vital role to play in<br />
finding new ways to protect the environment. Now<br />
urban decision makers can use the City Performance<br />
Tool (<strong>CyPT</strong>) by <strong>Siemens</strong> to select bespoke technologies<br />
that offer their own cities maximum environmental and<br />
economic benefits.<br />
Using exclusive <strong>Siemens</strong> data on more than 70 transport,<br />
building and energy technologies, <strong>CyPT</strong> delivers a detailed<br />
insight into the CO2 and air quality improvements you can<br />
achieve. It also identifies new local jobs each technology<br />
can create in your city.<br />
The tool tracks reductions in emissions from any reference year as a result<br />
of technology implementations<br />
What is the <strong>CyPT</strong>?<br />
The City Performance Tool is a dynamic simulation tool<br />
which studies a series of more than 70 technologies from<br />
Building, Transport and Energy Technologies – at different<br />
time periods and implementation rates. It is designed to<br />
reduce the environmental impact of everyday activities in<br />
your city. It covers greenhouse gas emissions from<br />
buildings and transport, as well as air pollutants such as<br />
particulate matter (PM) and nitrogen oxides (NOx). It also<br />
looks at the creation of new local jobs to install, operate<br />
and maintain city solutions.<br />
parking search traffic), shift the mode (public transport<br />
instead of cars) or improve efficiency (automated trains).<br />
The model is based on life cycle assessment methodology<br />
and builds upon <strong>Siemens</strong>’ technology expertise and global<br />
databases of deep vertical process knowledge. New jobs<br />
that would be created are based on reference projects or<br />
economic studies in the transport, building and energy<br />
sectors of different regions.<br />
Where can it be used?<br />
This versatile leading-edge simulation tool can be used in<br />
many different decision-making scenarios. It can determine<br />
the implementation rate needed for your city to meet its<br />
future environmental targets. It can also measure the<br />
impacts of a city’s strategic plans, and compare traditional<br />
methods with state-of-the-art technologies for their benefits<br />
and value for money.<br />
<strong>CyPT</strong> takes city leaders beyond best practice technology<br />
solutions. It works from your city’s individual baseline to<br />
identify technologies to match specific needs. No need to<br />
follow the rest of the market: the <strong>CyPT</strong> approach empowers<br />
city leaders to focus on appropriate technologies that will<br />
provide win-win solutions for your unique urban challenges.<br />
<strong>CyPT</strong> identifies the exact technologies you need to improve<br />
and enhance your city for Buildings, Transport and Energy.<br />
Who can use it?<br />
The dynamic <strong>CyPT</strong> tool can illustrate to city decision makers,<br />
from the mayor to the most junior city staffer in the<br />
planning, transport, economic development or<br />
environmental policy departments, the impacts that their<br />
collective decisions could have on their city’s environment<br />
and ability to create local jobs. The <strong>CyPT</strong> provides<br />
environmental results relative to the amount invested, and<br />
it can enable city managers to prioritise projects based upon<br />
their likely environmental and economic impacts. It can<br />
offer city managers a roadmap towards meeting carbon<br />
emission targets, clean air standards and local job growth.<br />
The model calculates the environmental and economic<br />
impacts of individual technologies at different<br />
implementation levels. In transport, for example, <strong>CyPT</strong><br />
assesses how a technology would reduce demand (reduce<br />
2 – City Performance Tool
Total: 2,853.0<br />
Baseline – Reductions: 2,138.0<br />
City & Utilities: 348.4<br />
Reductions: 716.0<br />
Wind Power: 202.0<br />
Households & Businesses: 368.0<br />
PV: 113.0<br />
Electric Car Sharing: 16.0<br />
e-Highway: 8.0<br />
Street Car: 6.0<br />
Bike Sharing: 0.4<br />
e-BRT: 3.0<br />
Electric Cars: 125.0<br />
Residential Glazing: 47.0<br />
Commercial Glazing: 45.0<br />
Home Automation: 40.0<br />
Residential Efficient Lighting Technology: 33.0<br />
Commercial Efficient Lighting Technology: 22.0<br />
CNG Cars: 24.0<br />
Building Performance Optimisation: 21.0<br />
Example one of technology levers: In the example<br />
above, a city’s annual greenhouse gas emissions can be<br />
reduced from 2.8Mt of CO2e to 2.1Mt using 15<br />
technologies. The <strong>CyPT</strong> can help a city identify which<br />
technology has the greatest greenhouse gas reduction<br />
potential.<br />
Finally the third category of technologies create modal<br />
shifts in transport. For example, by implementing public<br />
transport solutions such as new metro lines or e-buses,<br />
the city can reduce energy consumption by removing cars<br />
from the roads.<br />
The technologies are presented in three<br />
categories related to their capacity to<br />
reduce energy demand in cities.<br />
The first category works at the energy<br />
production level, demonstrating how<br />
photovoltaic installations, combined<br />
heat and power, and wind power can<br />
replace more carbon intensive energy<br />
sources such as coal.<br />
The second category includes LED<br />
street lighting and commercial efficient<br />
lighting, reducing energy demand by<br />
replacing less efficient technologies<br />
such as standard street lamps.<br />
Over 400 data points are collected for the city’s baseline in either metric<br />
or imperial units<br />
City Performance Tool – 3
Example two of technology levers: The chart below is used to compare the cost efficiency of a technology saving CO2<br />
compared to wall insulation. Wall insulation is used as a benchmark in this illustration and set at the 0% mark in the<br />
middle of the diagram. Technologies in light blue – to the right of the zero benchmark line – save more kilograms of CO2<br />
per euro than wall insulation. In this situation there are 10 technologies that save CO2 more cheaply than wall insulation.<br />
Less CO2 saved per € spent<br />
More CO2 saved per € spent<br />
Residential glazing<br />
Commercial wall insulation<br />
Commercial glazing<br />
LED street lighting<br />
ATO metro<br />
Hybrid electric cars<br />
Intermodal traffic management<br />
CNG cars<br />
CHP<br />
Residential efficient lighting<br />
Home energy monitoring<br />
Commercial efficient lighting<br />
Demand orientated lighting<br />
Building efficiency monitoring<br />
Building performance optimisation<br />
Demand controlled ventilation<br />
Metro new line<br />
Bike sharing<br />
Electric buses<br />
Plug-in hybrid electric cars<br />
Intelligent traffic light management<br />
Photovoltaic<br />
Home automation<br />
Heat recovery<br />
Hybrid electric bus<br />
Electric cars<br />
Electric taxis<br />
Demand oriented street lighting<br />
Electric cars sharing<br />
-100%<br />
-69%<br />
-68%<br />
-89%<br />
-100%<br />
-90%<br />
-72%<br />
-96%<br />
-79%<br />
-64%<br />
-27%<br />
-91%<br />
-82%<br />
-97%<br />
-59%<br />
-51%<br />
-106%<br />
-13%<br />
-100%<br />
-89%<br />
0% 100% 200% 300% 400% 500%<br />
6%<br />
174%<br />
500%<br />
346%<br />
38%<br />
265%<br />
173%<br />
10%<br />
27%<br />
85%<br />
4 – City Performance Tool
Interactive and impact-driven<br />
The city’s baseline is assembled with over 400 data points such as the<br />
city’s transport modalities and its electricity generation mix<br />
The <strong>CyPT</strong> process<br />
At the beginning of the process, data is collected on your<br />
city’s energy, buildings and transport infrastructure to<br />
customise the <strong>CyPT</strong> model. This is at a very generic level<br />
using city data publicly available mostly from statistics,<br />
studies, and transport or household surveys.<br />
Around 300 city-specific data points are used for three<br />
main sectors: electricity, heating, and cooling demand for<br />
buildings; passenger and freight transport demand; and<br />
the transport network. The <strong>Siemens</strong> <strong>CyPT</strong> Manager prefills<br />
data from public city’s or <strong>Siemens</strong>’ sources, working<br />
closely with city officials.<br />
Once all the data is collected, the <strong>CyPT</strong> Manager<br />
calculates the environmental baseline for your city based<br />
on activities in the three sectors.<br />
This baseline has three KPIs – PM10 and NOx (air quality)<br />
and CO2e emissions – which are also projected into the<br />
future based on a business-as-usual scenario and your<br />
own city’s demand projection (if available).<br />
This calculation delivers a basic understanding of the root<br />
causes of emissions in your city’s buildings and transport.<br />
Comparing the results with your own targets it identifies<br />
future needs and improvement areas. The <strong>CyPT</strong> Manager<br />
also calculates the city-specific impacts of individual<br />
technologies.<br />
Users can select low or high implementation rates for each technology<br />
and track the economic and environmental benefits that accrue<br />
Benefits for Cities<br />
The impact-driven tool delivers real numbers and works<br />
based on already existing infrastructure in each city.<br />
In workshops the impacts of energy, buildings and<br />
transport levers on improving air quality, reducing CO2e<br />
emissions, and creating local jobs in installation,<br />
operation and maintenance are studied.<br />
Levers can be applied at different implementation rates<br />
for specific building categories (residential, nonresidential<br />
– hospitals, education, public administration,<br />
etc.), passenger and goods transport (bikes, cars, buses,<br />
trams, metro, trucks, etc.), transport infrastructure<br />
(lighting, traffic and parking management, etc.), or<br />
energy (generation, transmission and distribution).<br />
Building levers apply an annual implementation rate to a<br />
city’s existing building stock. Energy and transport levers<br />
are applied at a certain rate aimed at a specified target.<br />
Levers can be pre-selected based on results, and cityspecific<br />
plans and policy can also be considered to<br />
generate a valuable mix of solutions. A range of impacts<br />
can be studied based on a single lever and its<br />
implementation rates, comparing options, or combining<br />
several levers in one or more sectors.<br />
City Performance Tool – 5
A specially developed <strong>CyPT</strong> app visualizes the effects of<br />
individual levers on a city, its buildings and its transport<br />
system. It also provides excellent support for the<br />
workshops by comparing scenarios created using different<br />
technologies and implementation rates.<br />
Reports both long and short term benefits<br />
Modern cities constantly need to balance long-term targets<br />
such as reducing greenhouse gas emissions with shorterterm<br />
aims such as improving air quality and creating jobs.<br />
All too often, lack of public support means long-term<br />
objectives are sacrificed for more immediate needs.<br />
<strong>CyPT</strong> takes on the challenges of this balancing act by<br />
helping decision makers to recognise and select<br />
technologies that offer win-win solutions. <strong>CyPT</strong> highlights<br />
the benefits from key performance indicators to enable<br />
city leaders to deliver long-term advantages strongly linked<br />
to short-term gains.<br />
Cities can maximise <strong>CyPT</strong> results by identifying the most<br />
cost effective solutions for improving air quality and<br />
reducing greenhouse gas emissions. By studying capital<br />
and operational investments across the lifespan of each<br />
technology, <strong>CyPT</strong> can report on kilograms of CO2e as well<br />
as PM10 and NOx levels for every euro spent.<br />
The <strong>CyPT</strong> helps you avoid investing in technologies that<br />
work on paper but cannot deliver the same results in your<br />
city. By carrying out a <strong>CyPT</strong> assessment, you can find<br />
exactly the right technologies for your city’s needs, both<br />
long and short term.<br />
Infrastructure strategy report<br />
When data collection, baseline and impact calculation, scenario definition and modelling are complete, the <strong>CyPT</strong><br />
Manager drives the writing process for the infrastructure strategy report.<br />
This comprehensive illustrated report explains in detail the benefits of different infrastructure scenarios on a city’s<br />
carbon emissions, air quality and new jobs. The report type is governed by findings and priorities set during the <strong>CyPT</strong><br />
process and refined in the workshop, as these four questions demonstrate:<br />
One:<br />
“What is the optimal mix of technologies to get<br />
balanced KPI improvements?” – report focuses on a<br />
benefit-based conclusion.<br />
Two:<br />
“What technology implementation rates are<br />
needed to meet air quality targets?” – focuses on<br />
recommended implementations for selected KPIs.<br />
Three:<br />
“What are the job and carbon emission impacts of a<br />
city’s transport plan and how do these compare<br />
with other sector plans?” – tests planning options.<br />
Four:<br />
“How do traditional city technologies compare with<br />
the latest solutions?” – compares existing<br />
technologies with the next wave.<br />
A ‘deep dive’ analysis of selected levers or urban districts may follow the infrastructure strategy report on a consulting<br />
or project basis.<br />
6 – City Performance Tool
Moving beyond carbon<br />
“There is growing anecdotal evidence from cities across<br />
the world that comprehensive, publicly accountable and<br />
integrated efforts to improve environmental performance<br />
go hand-in-hand with enhanced economic dynamism. The<br />
City Performance Tool uses an extensive dataset to<br />
quantify some of those causal relationships. It uses<br />
applied economic tools to capture whole-economy<br />
dynamic effects pertinent to the evolution and<br />
development of high performing world cities.”<br />
“There is currently no perfect tool for measuring the<br />
sustainable development of cities due to the inherent<br />
complexity of the task. The City Performance Tool of<br />
<strong>Siemens</strong> shows a way forward by going beyond a simple<br />
carbon footprint. The inclusion of further pollutants (PM10<br />
and NOx) and further sustainability dimensions (cost<br />
efficiency and job creation) goes definitely in the right<br />
direction.”<br />
Professor Dimitri Zenghelis, Co-Head of Climate<br />
Policy, Grantham Research Institute, London School<br />
of Economics<br />
Professor Dr. Matthias Finkbeiner, Chair of<br />
Sustainable Engineering, Technical University, Berlin<br />
City Performance Tool – 7
<strong>Siemens</strong><br />
Global Centre of Competence Cities<br />
<strong>Siemens</strong> Brothers Way<br />
London E16 1GB, United Kingdom<br />
klaus.heidinger@siemens.com<br />
www.siemens.com<br />
© 2014 <strong>Siemens</strong><br />
Right of modifications reserved