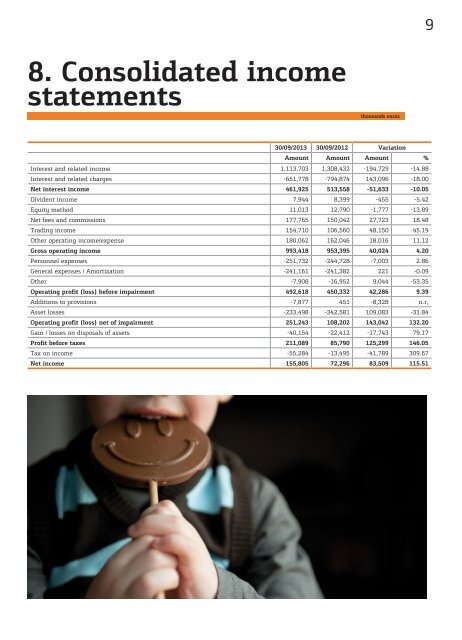
9 8. Consolidated income statements thousands euros 30/09/2013 30/09/2012 Variation Amount Amount Amount % Interest and related income 1,113,703 1,308,432 -194,729 -14.88 Interest and related charges -651,778 -794,874 143,096 -18.00 Net interest income 461,925 513,558 -51,633 -10.05 Divident income 7,944 8,399 -455 -5.42 Equity method 11,013 12,790 -1,777 -13.89 Net fees and commissions 177,765 150,042 27,723 18.48 Trading income 154,710 106,560 48,150 45.19 Other operating income/expense 180,062 162,046 18,016 11.12 Gross operating income 993,418 953,395 40,024 4.20 Personnel expenses -251,732 -244,728 -7,003 2.86 General expenses / Amortization -241,161 -241,382 221 -0.09 Other -7,908 -16,952 9,044 -53.35 Operating profit (loss) before impairment 492,618 450,332 42,286 9.39 Additions to provisions -7,877 451 -8,328 n.r, Asset losses -233,498 -342,581 109,083 -31.84 Operating profit (loss) net of impairment 251,243 108,202 143,042 132.20 Gain / losses on disposals of assets -40,154 -22,412 -17,743 79.17 Profit before taxes 211,089 85,790 125,299 146.05 Tax on income -55,284 -13,495 -41,789 309.67 Net income 155,805 72,296 83,509 115.51
10 9. Quarterly statements of income thousands euros Variation (%) 2013 2012 3Q13 3Q13/3Q12 3Q13/2Q13 2Q13 1Q13 4Q12 3Q12 Interest and related income 370,103 -13.76 0.73 367,436 376,164 399,265 429,165 Interest and related charges -196,626 -22.66 -7.08 -211,614 -243,539 -252,567 -254,252 Net interest income 173,477 -0.82 11.33 155,822 132,625 146,697 174,913 Divident income 1,949 19.85 -48.67 3,796 2,199 3,392 1,626 Equity method 4,046 -6.08 18.47 3,415 3,553 4,887 4,307 Net fees and commissions 61,477 19.41 1.88 60,345 55,943 53,798 51,483 Trading income 36,060 41.02 -30.67 52,014 66,636 38,570 25,571 Other operating income/expenses 58,973 10.14 -4.03 61,451 59,639 53,301 53,542 Gross operating income 335,981 7.88 -0.26 336,844 320,594 300,646 311,443 Personnel expenses -82,830 3.76 -1.66 -84,226 -84,676 -78,351 -79,825 General expenses / Amortization -80,166 2.52 -0.97 -80,948 -80,047 -80,989 -78,196 Other -2,654 -60.66 -13.63 -3,073 -2,181 -2,466 -6,746 Operating profit (loss) before 170,331 16.13 1.03 168,597 153,690 138,840 146,676 impairment Additions to provisions -4,940 n.r 61.99 -3,050 113 -472 26 Asset losses -81,925 14.48 6.52 -76,911 -74,662 -76,447 -71,562 Operating profit (loss) net of 83,465 11.08 -5.83 88,637 79,142 61,921 75,140 impairment Gain / losses on disposals of assets -11,517 15.91 -33.39 -17,289 -11,348 6,468 -9,936 Profit before taxes 71,948 10.34 0.84 71,347 67,794 68,389 65,204 Tax on profit -18,440 18.62 -5.06 -19,422 -17,423 -16,031 -15,546 Net income 53,509 7.75 3.05 51,926 50,371 52,358 49,658 Gross margin and cost to income (%) Operating income before provisions (million €) 337 336 321 180 160 140 311 120 100 301 80 60 45.8 46.2 46.5 45.4 44.8 40 20 0 3Q12 4Q12 1Q13 2Q13 3Q13 3Q12 4Q12 1Q13 2Q13 3Q13 l Gross margin l Cost to income