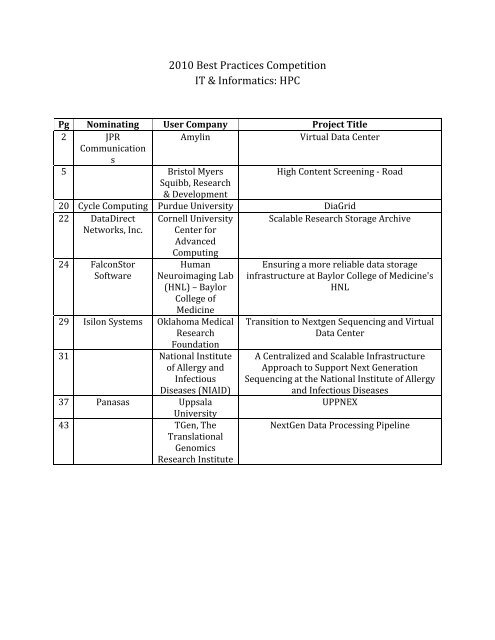
2010 Best Practices Competition IT & Informatics HPC
IT Informatics - Cambridge Healthtech Institute
IT Informatics - Cambridge Healthtech Institute
- No tags were found...

You also want an ePaper? Increase the reach of your titles
YUMPU automatically turns print PDFs into web optimized ePapers that Google loves.
<strong>2010</strong> <strong>Best</strong> <strong>Practices</strong> <strong>Competition</strong><br />
<strong>IT</strong> & <strong>Informatics</strong>: <strong>HPC</strong><br />
Pg Nominating User Company<br />
Project Title<br />
2 JPR<br />
Amylin<br />
Virtual Data Center<br />
Communication<br />
s<br />
5 Bristol Myers<br />
High Content Screening ‐ Road<br />
Squibb, Research<br />
& Development<br />
20 C ycle Computing Purdue University DiaGrid<br />
22 DataDirect Cornell University Scalable Research Storage Archive<br />
Networks, Inc. Center for<br />
A dvanced<br />
Computing<br />
24 FalconStor<br />
Software<br />
Human<br />
Neuroimaging Lab<br />
(HNL) – Baylor<br />
College of<br />
Medicine<br />
29 Isilon Systems Oklahoma Medical<br />
Research<br />
Foundation<br />
31 National Institute<br />
of Allergy and<br />
I nfectious<br />
Diseases (NIAID)<br />
37 Panasas Uppsala<br />
University<br />
43 TGen, The<br />
Translational<br />
Genomics<br />
Research Institute<br />
Ensuring a more reliable data storage<br />
infrastructure at Baylor College of Medicine's<br />
HNL<br />
Transition to Nextgen Sequencing and Virtual<br />
Data Center<br />
A Centralized and Scalable Infrastructure<br />
Approach to Support Next Generation<br />
Sequencing at the National Institute of Allergy<br />
and Infectious Diseases<br />
UPPNEX<br />
NextGen Data Processing Pipeline
<strong>2010</strong> Bio <strong>IT</strong> Award<br />
1. Nominating Organization<br />
Organization name: JPR Communications<br />
Address: 20750 Ventura blvd Ste.350<br />
City: Woodland Hills<br />
State: CA<br />
2. Nominating Contact Person<br />
Name: Judy Smith<br />
Title: President<br />
Phone:8188848282<br />
Email: judys@jprcom.com<br />
3. User Organization<br />
Organization name: Amylin Pharmaceuticals<br />
Address: 9360 Towne Centre Drive<br />
City: San Diego<br />
State: CA<br />
Zip: 92121<br />
4. Contact Person<br />
Name: Steve Phillpott<br />
Title: CIO<br />
Phone: 858-309-7585<br />
Email: Steve.Phillpott@amylin.com<br />
5. Project<br />
Project Title: Amylin Virtual Data Center<br />
Category: <strong>IT</strong> and <strong>Informatics</strong><br />
6. Description of project (4 FIGURES MAXIMUM):<br />
See slide presentation<br />
A. ABSTRACT/SUMMARY of the project and results (800 characters max.)<br />
Amylin Pharmaceuticals is a San Diego-based biopharma company, focused on providing first in<br />
class therapies for diabetes and obesity. Accomplishing Amylin’s mission of “Challenging<br />
Science and Changing Lives” requires tremendous <strong>IT</strong> capabilities, and the company has a history<br />
of being an early adopter of technology.<br />
In 2008, the company’s need for additional technology investment ran headlong into the<br />
economic realities of the time. Additionally, Amylin began to pursue a more flexible business<br />
model, emphasizing partnerships and virtualization over doing everything itself. In short, a core<br />
philosophy became “access tremendous capabilities, without owning those capabilities”.<br />
Amylin’s CIO, Steve Phillpott, and his <strong>IT</strong> leadership team applied this new strategy, developing an<br />
operating model they called the “Amylin Virtual Data Center”, which utilizes detailed service<br />
costing and cloud and SaaS capabilities to dramatically lower the cost of <strong>IT</strong>.
B. INTRODUCTION/background/objectives<br />
Amylin <strong>IT</strong> set out to move to a flexible technology model that would allow access to world-class <strong>IT</strong><br />
capabilities, without having to operate each of those capabilities. First, the team spent several<br />
months preparing detailed cost analysis for every service they provide. This “cost by service”<br />
model included the labor, licensing, maintenance, hardware, data center cost and even power<br />
usage for each service and application allowed the team to do more accurate comparisons of<br />
costs between delivering services internally or externally.<br />
The result was a list of <strong>IT</strong> services or applications provided by Amylin <strong>IT</strong>, each of which would be<br />
assessed to determine whether the same service could be provided at lower cost through utility<br />
services. Besides cost, other factors were also considered, including security, performance,<br />
architectural appropriateness for the cloud, and vendor capability. Importantly, the team actively<br />
looked for opportunities where SaaS and the Cloud would work, rather than enumerating all the<br />
reasons why cloud doesn’t work.<br />
Amylin built-out a “toolkit” of Cloud and SaaS offerings that their <strong>IT</strong> staff could make use of to<br />
enable flexible <strong>IT</strong>. For Infrastructure as a service (IAAS), they chose Amazon Web Service<br />
(AWS) and vertical offerings built on AWS. For Platform as a Service (PaaS), they use<br />
Force.com. For cloud storage, they started a relationship with Nirvanix. And finally they began a<br />
deep investigation of Software as a Service (SaaS) capabilities to meet their application needs.<br />
In each case, internal <strong>IT</strong> teams would begin pilot projects, have personal “sandboxes”, and get to<br />
understand these capabilities on a technical level. In the case of Amazon, Force.com, and<br />
Nirvanix, initial skepticism turned into a positive response, as the capabilities of these tools were<br />
understood. Getting tools in the hands of technical people was key to gaining their understanding<br />
an buy-in.<br />
C. RESULTS (highlight major R&D/<strong>IT</strong> tools deployed; innovative uses of technology).<br />
As Amylin rolled out their cloud initiatives, they first focused on Amazon EC2 to host a limited<br />
number of application use cases. Amazon EC2 will continue to grow as a hosting platform for<br />
Amylin, and additional migrations are planned for this year and 2011.<br />
Amylin has a number of internal legacy applications, often without the internal resources to<br />
manage or upgrade them. As initial pilot applications were successful, the team is now planning<br />
to move legacy applications to Force.com. The component reusability and rich platform led<br />
Amylin developers to determine they could be more productive in such an environment.<br />
The third focus was storage and disaster recovery capabilities. Rather then building out an inhouse<br />
system, Amylin called upon Nirvanix, a cloud storage partner. Amylin server images and<br />
data is now stored in the Nirvanix cloud, meeting compliance requirements and providing disaster<br />
recovery and backup capability for Amylin’s data.<br />
Finally, Amylin invested significant time understanding the wide range of SaaS offerings<br />
available. Frequently, they discovered that SaaS offerings were more feature-rich and easier to<br />
use than internally hosted applications. Currently, Amylin utilized over a half a dozen SaaS<br />
applications, and migrations to several more are in progress. These include Workday, Microsoft<br />
Hosted Exchange, LiveOffice, and Saba.<br />
Amylin used the following tools (cloud services) to meet their business needs:<br />
Nirvanix: Nirvanix Storage Delivery Network (SDN) for enterprise cloud storage. The project involved<br />
moving critical validated server images that are used for all business and manufacturing applications<br />
and drugs simulation process such as Blast, C‐Path and other genomics simulations. Since these are
critical images and are frequently used, they are stored on tier I storage platform to ensure high<br />
availability and safety. Nirvanix provided better capabilities and provided additional level of protection<br />
as the images are now stored on the Cloud and are protected against any datacenter/localized<br />
infrastructure failures within Amylin. Further, Nirvanix’s “Plug and Play” architecture enabled them to<br />
seamlessly integrate the “CloudNAS” into their environment without any overhaul of their existing setup.<br />
Further, the new release of the product ties into their existing Netbackup and Commvault set‐up<br />
further simplifying backup, recovery and e‐discovery process.<br />
Amazon: Amylin leveraged Amazon for their compute infrastructure services (EC2). Several applications<br />
have been piloted in EC2, and some are now in full production. Additionally, Amylin expects to<br />
leverage EC2 and Cycle Computing’s CycleCloud for high performance research computing in the coming<br />
years.<br />
LiveOffice: Amylin implemented LiveOffice Mail Archive to store all Amylin email archives, for<br />
compliance purposes. This saved the significant investment in an in‐house email eDiscovery capability,<br />
and was available to the business much sooner than building a software solution.<br />
Symplified: Amylin deployed Symplified’s SaaS identify management package. Amylin found that<br />
deploying SaaS and cloud applications increased the problem of user account management and logins,<br />
and Symplified provided a fast to deploy and affordable solution.<br />
D. ROI achieved or expected (1000 characters max.):<br />
The storage cloud strategy resulted in a significant reduction in costs compared to the Tier I<br />
solution by approx 50+%. In many cases, ROI was achieved within couple of months into<br />
production use. Further, Cloud Storage enabled Amylin to achieve a significant business mile<br />
stone of having a basic data DR solution by storing and protecting data in the cloud.<br />
E. CONCLUSIONS/implications for the field (800 characters max.)<br />
Amylin implemented cloud solutions early, did extensive research, and selected some of the<br />
leaders in the cloud computing market. Starting a new infrastructure is a learning experience and<br />
Amylin continues to educate itself on recent cloud advancements and test its current plans.<br />
Amylin is looking ahead and into possibly launching an internal virtualization and private cloud<br />
with VMware, thus further complementing their current cloud deployments.<br />
With their four layers of the cloud in place, Amylin is in a solid position and can make sound<br />
selections based upon cost, control, performance and best fit.<br />
6. REFERENCES/testimonials/supporting internal documents<br />
See power point presentation.
Published Resources for the Life Sciences<br />
250 First Avenue, Suite 300, Needham, MA 02494 | phone: 781‐972‐5400 | fax: 781‐972‐5425<br />
BMS is submitting nomination for <strong>Best</strong> practices at BIO-<strong>IT</strong> World <strong>2010</strong>.<br />
The category for <strong>Best</strong> practices is:<br />
<strong>IT</strong> & <strong>Informatics</strong>: LIMS, High Performance Computing, storage, data visualization,<br />
imaging technologies<br />
Following is the nomination form that will be filled on line at the<br />
conference Website.<br />
_____________________________________________________________<br />
Bio-<strong>IT</strong> World <strong>2010</strong> <strong>Best</strong> <strong>Practices</strong> Awards<br />
Celebrating Excellence in Innovation<br />
INSTRUCTIONS and ENTRY FORM<br />
www.bio‐itworld.com/bestpractices<br />
DEADLINE FOR ENTRY: January 18, <strong>2010</strong> (Updated deadline: February 19, <strong>2010</strong>)<br />
Bio‐<strong>IT</strong> World is seeking submissions to its <strong>2010</strong> <strong>Best</strong> <strong>Practices</strong> Awards. This prestigious awards<br />
program is designed to recognize outstanding examples of technology and strategic innovation—<br />
initiatives and collaborations that manifestly improve some facet of the R&D/drug<br />
development/clinical trial process.<br />
The awards attract an elite group of life science professionals: executives, entrepreneurs, innovators,<br />
researchers and clinicians responsible for developing and implementing innovative solutions for<br />
streamlining the drug development and clinical trial process. All entries will be reviewed and assessed<br />
by a distinguished peer‐review panel of judges.<br />
The winners will receive a unique crystal award to be presented at the <strong>Best</strong> <strong>Practices</strong> Awards dinner,<br />
on Wednesday, April 21, <strong>2010</strong>, in conjunction with the Bio‐<strong>IT</strong> World Conference & Expo in Boston.<br />
Winners and entrants will also be featured in Bio‐<strong>IT</strong> World.<br />
INSTRUCTIONS<br />
1. Review criteria for entry and authorization statement (below).
Published Resources for the Life Sciences<br />
250 First Avenue, Suite 300, Needham, MA 02494 | phone: 781‐972‐5400 | fax: 781‐972‐5425<br />
A. Nominating Organization<br />
Organization name: Bristol‐Myers Squibb<br />
Address:<br />
B. Nominating Contact Person<br />
Name: Mohammad Shaikh<br />
Title: Associate Director<br />
Tel: (609) 818 3480<br />
Email: mohammad.shaikh@bms.com<br />
2. User Organization (Organization at which the solution was deployed/applied)<br />
A. User Organization<br />
Organization name: Bristol Myers Squibb, Research & Development<br />
Address: 311 Pennington‐Rocky hill Road<br />
Pennington. NJ 08534<br />
B. User Organization Contact Person<br />
Name: Donald Jackson<br />
Title: Sr. Research Investigator II<br />
Tel: 609‐818‐5139<br />
Email: Donald.jackson@bms.com<br />
3. Project<br />
Project Title: High Content Screening ‐ Road<br />
Team Leader:<br />
Name: James Gill<br />
Title: Director<br />
Tel: 203.677.5708<br />
Email: james.gill@bms.com<br />
Team members – Michael Lenard, James Scharpf, Russell Towell, Richard Shaginaw, Normand Cloutier<br />
4. Category in which entry is being submitted (1 category per entry, highlight your choice)<br />
Basic Research & Biological Research: Disease pathway research, applied and basic research<br />
Drug Discovery & Development: Compound‐focused research, drug safety<br />
Clinical Trials & Research: Trial design, eCTD<br />
Translational Medicine: Feedback loops, predictive technologies<br />
Personalized Medicine: Responders/non‐responders, biomarkers<br />
<strong>IT</strong> & <strong>Informatics</strong>: LIMS, High Performance Computing, storage, data visualization, imaging<br />
technologies
Published Resources for the Life Sciences<br />
250 First Avenue, Suite 300, Needham, MA 02494 | phone: 781‐972‐5400 | fax: 781‐972‐5425<br />
Knowledge Management: Data mining, idea/expertise mining, text mining, collaboration,<br />
resource optimization<br />
Health‐<strong>IT</strong>: ePrescribing, RHIOs, EMR/PHR<br />
Manufacturing & Bioprocessing: Mass production, continuous manufacturing<br />
(Bio‐<strong>IT</strong> World reserves the right to re‐categorize submissions based on submission or in the event that<br />
a category is refined.)<br />
6. Description of project (4 FIGURES MAXIMUM):<br />
A. ABSTRACT/SUMMARY of the project and results (150 words max.)<br />
High-content screening (HCS) data has unique requirements that are not supported by<br />
traditional high-throughput screening databases. Effective analysis and interpretation of<br />
the screen data requires ability to designate separate positive and negative controls for<br />
different measurements in multiplexed assays.<br />
The fundamental requirements are the ability to capture information on the cell lines,<br />
fluorescent reagents and treatments in each assay; the ability to store and utilize<br />
individual-cell and image data; and the ability to support HCS readers and software from<br />
multiple vendors along with third-party image analysis tools. The system supports target<br />
identification, lead discovery, lead evaluation and lead profiling activities.<br />
The solution was designed using a combination of complimentary technologies that later<br />
became part of best practices at Bristol-Myers Squibb’s Research <strong>Informatics</strong>. The image<br />
data generated by HCS processes is over 50 TB over five years and has seen exponential<br />
growth trends. Database and data logistics were built using Oracle (11g) partitioning<br />
techniques, Isilon storage was used to handle unstructured data and EMC for relational<br />
data. Application was built using techniques like external tables, caching, materialized<br />
views, parallel queries and used .Net framework for business rules and visualizations.<br />
Statistical functions in Oracle API libraries were leveraged for analysis.<br />
INTRODUCTION/background/objectives<br />
High content screening (HCS) has demonstrated utility at multiple points in the drug<br />
discovery process including target identification, target validation, lead identification, lead<br />
evaluation and profiling 1 , mechanism of action determination 2 and toxicology<br />
assessment 3 . Within a single organization, HCS may be used for multiple purposes with<br />
distinct groups and even instruments supporting different stages of drug discovery. The
Published Resources for the Life Sciences<br />
250 First Avenue, Suite 300, Needham, MA 02494 | phone: 781‐972‐5400 | fax: 781‐972‐5425<br />
scope of HCS projects can range from large-scale compound and RNAi collections tested<br />
in high-throughput screens to the detailed characterization of small numbers of<br />
compounds in multiple assays and cell lines. Despite their different roles, each group has<br />
common needs for data analysis including: deriving numeric measurements from images;<br />
connecting results with treatments, cell lines and assay readouts; identifying positive and<br />
negative controls to normalize data; rejecting failed data points; and selecting hits or<br />
fitting concentration-response curves. Establishing a common framework for HCS data<br />
allows users from different groups to analyze their results and share best practices and<br />
algorithms between users and instruments.<br />
HCS data can be divided into three types: image data, derived data (e.g. single cell<br />
measurements and well-level summary statistics), and metadata 4 . This last data type<br />
includes both procedural information (e.g., how the images were acquired and analyzed)<br />
and experimental annotation (what cell lines, fluorescent probes and treatments were<br />
used). Procedural metadata is captured by most HCS platforms and by open-source<br />
projects such as the Open Microscopy Environment (OME) 5 . Experimental annotation<br />
metadata is less well supported even though it is essential for the interpretation and<br />
analysis of HCS results. The Minimum Information About a Cellular Assay (MIACA)<br />
standard established guidelines for what experimental annotation should be included in<br />
scientific publications 6 but is not intended for laboratory data management.<br />
HCS data shares many requirements with other types of high-throughput screening data,<br />
especially from cell-based assays. In particular, the need to capture assay design<br />
information in a structured and consistent manner is essential for the analysis and<br />
reporting of experimental results 7 . Other essential components include a reagent registry<br />
(for compounds, RNAi reagents, and other reagent types), a reagent inventory database<br />
(with information on plate maps), and tools for hit selection and concentration-response<br />
analysis 8 .<br />
Despite the parallels to HTS data, managing and analyzing HCS data presents distinct<br />
challenges not encountered with other assay platforms, including single-endpoint cell<br />
based assays. First, HCS is image-based. Access to the underlying images is essential to<br />
troubleshoot problems, confirm and understand results, and communicate results to<br />
colleagues. Second, HCS produces large amounts of data. For example, a single 384-well<br />
plate can produce over 2 GB of images and millions of records of derived data 4 ; this scale<br />
of data requires support from information technology experts along with mechanisms to<br />
systematically identify and delete unneeded data. Third, HCS assays often multiplex<br />
several distinct biological readouts in the same well. This requires the ability to designate<br />
separate positive and negative controls for different channels or even measurements so
Published Resources for the Life Sciences<br />
250 First Avenue, Suite 300, Needham, MA 02494 | phone: 781‐972‐5400 | fax: 781‐972‐5425<br />
that assay performance and result normalization can generate meaningful values. Fourth,<br />
multiple vendors produce HCS readers and image analysis packages, along with thirdparty<br />
analysis packages such as CellProfiler 9 . Results and images must be converted to a<br />
common format so data and analysis tools can be shared between groups. Finally, HCS<br />
assays are inherently cell-based. Consistent identification of the cell lines, fluorescent<br />
dyes or antibody conjugates, and fluorescent proteins used in each assay is essential for<br />
the proper documentation and long-term mining of HCS results.<br />
To address these requirements we developed HCS Road, a data management system<br />
specifically designed for HCS. As the name indicates, HCS Road provides a smooth,<br />
well-defined route from image quantification to data analysis and reporting. The system<br />
combines an experiment definition tool, a relational database for results storage, assay<br />
performance reports, data normalization, and analysis capabilities. HCS Road currently<br />
supports multiple imaging platforms and provides a common repository for HCS data<br />
across instruments and user groups. In this work, we describe the approaches we took for<br />
data storage, experimental annotation, and data analysis and the scientific and business<br />
reasons for those decisions. We also present a XML schema for HCS data that supports<br />
multiple HCS platforms.<br />
RESULTS (highlight major R&D/<strong>IT</strong> tools deployed; innovative uses of technology).<br />
System Architecture<br />
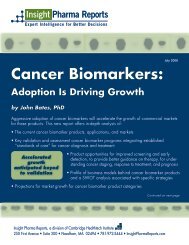
Figure 1 shows an overview of the architecture of HCS Road. HCS Road currently<br />
supports three platforms: the Cellomics Arrayscan, the InCell 1000 (GE Healthcare,<br />
Parsippany, NJ), or the Evotec Opera. Images are analyzed with the appropriate software<br />
and the results are collected in platform-specific files or a platform database such as<br />
Cellomics Store. An HCS Road service converts data to a common XML format for<br />
import into the HCS Road database. Once the data is loaded into HCS Road it is merged<br />
with experimental annotation and treatment plate maps. Data import and merging can be<br />
performed manually or automatically based on previously registered plate barcodes. QC<br />
metrics and normalized results are calculated automatically and can be reviewed and<br />
analyzed using the HCS Road client or exported to third-party applications such as TIBCO<br />
Spotfire (TIBCO Software, Cambridge, MA).<br />
Users interact with HCS Road through two client applications. The Data Import<br />
application enables users to select plates for import from the platform-specific data<br />
repository (Cellomics database, Opera or InCell file share). Multiple plates can be
Published Resources for the Life Sciences<br />
250 First Avenue, Suite 300, Needham, MA 02494 | phone: 781‐972‐5400 | fax: 781‐972‐5425<br />
transferred in parallel for faster import, and well summary results are imported separately<br />
from cell-level measurements so users can review well-level results more quickly. A webbased<br />
administration tool controls the number of threaded processes and other data import<br />
settings. Experimental annotation, data mining and visualization are supported by the<br />
dedicated Data Explorer client application. Data-intensive operations, including data<br />
extraction and updates, QC and data analysis are implemented on the servers and the<br />
database to reduce the amount of data transferred from server to client. The Data Explorer<br />
also allows users to view images for selected wells or as a ‘poster’ of images for an entire<br />
plate. Images can also be viewed in third-party applications such as TIBCO Spotfire using<br />
a web page (Fig. 1). In either case, the image conversion server retrieves images from the<br />
appropriate platform repository and converts them from proprietary formats to standard<br />
TIFF or JPEG formats as needed.<br />
<strong>IT</strong> Tools & Techniques<br />
The large volumes of data generated by HCS require particular attention to image and data<br />
storage and management.<br />
Storage: HCS system provides scalable and extensible storage that is well suited for<br />
managing large numbers of images. The distributed nature of the system means that input<br />
and output bandwidth grow in parallel with capacity, avoiding a potential bottleneck.<br />
Images are stored at or near the site where they were acquired (and where they are likely<br />
to be analyzed or viewed) to reduce network latency issues. This approach reduced<br />
storage costs while increasing the bandwidth for image transfer.<br />
After extensive product evaluation, we decided on Isilon Systems clustered networkattached<br />
storage appliances. We deployed these as a file service, exposing several<br />
Windows networking file shares to the HCS readers, as well as to researcher workstations.<br />
Key Differentiators influencing our decision for Isilon NAS cluster were: True unified<br />
name space, robust data protection algorithms, straightforward scalability using building<br />
block nodes, ease of administration – FreeBSD CLI and lower-cost SATA disks.<br />
Data Management<br />
The large number of data records generated by HCS also presents an informatics<br />
challenge. We store HCS results in Oracle relational databases, as do other HCS users 10 .<br />
These databases can become very large, primarily because of cell level data. We observed<br />
that as the size of our databases grew, performance deteriorated. To address this, we used<br />
Oracle’s database partitioning capabilities. We focused our efforts on the two largest<br />
tables in the database, which both contain cell-level data. Our partitioning scheme
Published Resources for the Life Sciences<br />
250 First Avenue, Suite 300, Needham, MA 02494 | phone: 781‐972‐5400 | fax: 781‐972‐5425<br />
exploits the fact that, once written, cell level data is unlikely to change. Partitioning the<br />
tables in a coordinated fashion provided 10-fold reductions in data load times and 20-fold<br />
reductions in query times. Historical partitions are accessed in read-only mode which<br />
helps to protect data integrity and speeds up database backup and recovery.<br />
Experimental annotation<br />
HCS Road captures information on experimental treatments and conditions in a way that<br />
enables long-term mining of results across assays and users and enforces consistent<br />
nomenclature for cell lines, detection reagents, and control or experimental treatments.<br />
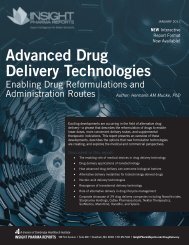
Figure 2 shows the workflow for assay definition, treatment selection, and data import and<br />
analysis. Much of this information is referenced or imported from other databases. Thus,<br />
HCS Road imports or references treatment information such as compound structures,<br />
RNAi targets and sequences, and library plate from existing enterprise databases (green<br />
box in Fig. 2). Similarly, cell line information is linked to an enterprise registry that tracks<br />
information on source, tissue type, transgenic constructs, passages and other relevant<br />
information. This reduces the data entry burden on users, reduces errors, and ensures<br />
consistency within HCS Road and with data from other platforms. Annotation that cannot<br />
be imported or referenced is stored in the Road database. For example, information on<br />
fluorescent probes including probe name, vendor and catalog number, fluorescent<br />
characteristics and molecular or cellular targets is stored within HCS Road in a way that<br />
supports re-use across multiple assays.<br />
The creation of a new assay begins with the selection of the cell line(s) and fluorescent<br />
probes used in an experiment (yellow box in Fig. 2). Control and reference compounds<br />
can be selected from the reagent registry or entered manually (as for commercially<br />
purchased reagents). Business metadata is also collected to enable reports of results<br />
across multiple assays and to support data retention decisions. Next, one or more ‘master’<br />
plates are created with information on cell seeding along with locations and concentrations<br />
of control and reference treatments and fluorescent probes. HCS Road supports multiple<br />
plate layouts including 96, 384 and 1536-well; additional custom layouts can be quickly<br />
defined as needed. Finally, multiple copies of this master plate are created to correspond<br />
to the physical plates in the assay. Reagents tested in the assay can be entered manually<br />
(as during assay development) or automatically from existing reagent databases (green<br />
box in Fig. 2). Assays and plates can also be copied to streamline small changes to<br />
experimental designs or plate layouts.<br />
The last step in experimental annotation is the assignment of positive and negative control<br />
treatments (blue box in Fig. 2). Different treatments can be designated as positive and<br />
negative controls for different measurements. This provides the flexibility needed to
Published Resources for the Life Sciences<br />
250 First Avenue, Suite 300, Needham, MA 02494 | phone: 781‐972‐5400 | fax: 781‐972‐5425<br />
support multiplexed, multi-parameter HCS assays and provide meaningful performance<br />
metrics and normalized results. Control status is assigned to treatments (or treatment<br />
combinations) rather than to well locations. Any wells that receive the control<br />
treatment(s) become controls for the specified measurement(s). This reduces the amount<br />
of data users must enter, allows a single analysis protocol to support multiple plate layouts<br />
(for example, in screening multiple existing reagent collections with different layouts),<br />
and facilitates the re-use of assay definitions.<br />
Data loading and analysis<br />
Once images have been collected and analyzed, the results are loaded into HCS road for<br />
analysis (pink box in Fig. 2). Images and numeric results are imported from platform<br />
repositories using a dedicated, internally developed application. Data can be loaded<br />
automatically using pre-defined criteria or selected manually after image acquisition and<br />
analysis are complete. Multiple sets of images and results can be loaded for a single assay<br />
plate to support kinetic imaging and re-imaging or re-analysis of plates using different<br />
objectives, filters or analysis algorithms. Results are associated with assay plates<br />
manually or using barcodes on the assay plates.<br />
HCS Road calculates multiple quality control metrics and provides tools for rejecting<br />
failed wells or plates. In addition to the Z’ metric of Zhang et al 11 , the plate mean,<br />
median, standard deviation, minimum and maximum are reported for negative control,<br />
positive control and sample wells for each plate in a run. Users can review individual<br />
plates and may choose to reject all measurements from a well or only reject selected<br />
measurements. The ability to selectively reject measurements is necessary because of the<br />
multi-parameter nature of HCS assays. For example, a treatment may reduce cell count in<br />
a multiplexed assay; this is a legitimate result but measurements in other channels may not<br />
be reliable.<br />
Data analysis<br />
Commonly used analyses are implemented as fixed workflows within the HCS Road Data<br />
Explorer application. HCS Road automatically performs multiple normalizations when<br />
data is loaded. The calculations include percent control, percent inhibition, signal to<br />
background and z-score 12 . The first analysis we implemented was concentration-response<br />
curve fitting. Curves are fit using a 4-parameter logistic regression with XLF<strong>IT</strong> equation<br />
205 (IDBS Business Solutions, Guilford, UK). A graphic view shows the fit line and data<br />
points for an individual compound. Data points are linked to the corresponding images so<br />
users can review the images for a well and choose to reject it and recalculate the fit. The<br />
resulting IC50 values were consistent with those produced by our existing HTS analysis<br />
tools (not shown).
Published Resources for the Life Sciences<br />
250 First Avenue, Suite 300, Needham, MA 02494 | phone: 781‐972‐5400 | fax: 781‐972‐5425<br />
We also identified a need to export results and annotation from HCS Road to third party<br />
applications so researchers can perform calculations and generate visualizations that are<br />
not part of a common workflow. We use TIBCO Spotfire for many of our external<br />
visualizations because: it can retrieve data directly from the HCS Road database; it<br />
supports multiple user-configurable visualizations; it provides tools for filtering and<br />
annotating data, and it can perform additional analyses using internal calculations or by<br />
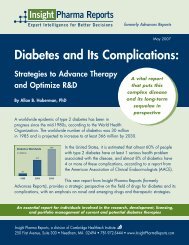
communicating with Accelerys PipelinePilot (SanDiego, CA). Figure 3 shows a Spotfire<br />
visualization for analyzing RNAi screening results. This workflow retrieves results and<br />
treatment information from the HCS Road database. The user is presented with<br />
information on the distribution of normalized values for each endpoint and can select<br />
wells that pass the desired activity threshold. Additional panels identify RNAi reagents<br />
where multiple replicate wells pass the threshold and genes where multiple different RNAi<br />
reagents scored as hits, an analysis that is unique to RNAi screening. Within Spotfire,<br />
HCS assay results can be cross-referenced with other information such as mRNA<br />
expression profiling to identify RNAi reagents whose phenotype correlates with levels of<br />
target expression in the assay cell line (not shown).<br />
Cell-level data<br />
Managing and analyzing cell-level data was a high priority in the development of HCS<br />
Road. Cell level data enables the analysis of correlations between measurements at the<br />
cellular level, the use of alternative data reduction algorithms such as the Kolmogorov-<br />
Smirnov distance 13; 14 , classification of subpopulations by cell cycle phase 15 , and other<br />
approaches beyond basic well-level statistics 16 . However, the volume of cell data in an<br />
HCS experiment can be very large. Storing cell data as one row per measurement per cell<br />
creates a table with large numbers of records and slows down data loading and retrieval.<br />
Because cell data is typically used on a per-plate/feature basis for automated analyses and<br />
for manual inspection, we chose to store it in files on the HCS Road file share (Fig. 1)<br />
rather than in the database. When cell data is needed, it is automatically imported into a<br />
database table using Oracle’s bulk data loading tools. When the cell measurements are no<br />
longer needed the records are deleted from the Road database (but are still retained in<br />
files). This controls database growth and improves performance compared to retaining<br />
large numbers of records in the database.<br />
ROI achieved:<br />
HCS Road currently supports target identification, lead identification and lead profiling<br />
efforts across multiple groups within BMS Applied Biotechnology. Scientists can analyze<br />
their experiments more rapidly and the time needed to load, annotate and review<br />
experiments has been reduced from days to hours. Integration with existing databases
Published Resources for the Life Sciences<br />
250 First Avenue, Suite 300, Needham, MA 02494 | phone: 781‐972‐5400 | fax: 781‐972‐5425<br />
reduces the amount of data users must enter, reduces errors and facilitates integration with<br />
results from other assay platforms. HCS Road enables new types of experiments that were<br />
not supported by our previous data management tools, including 1536-well HCS assays<br />
and cell cycle analysis based on DNA content measures for individual cells. HCS Road<br />
provides a single source for data from Cellomics Arrayscan, GE InCell and Evotec Opera<br />
instruments. Finally, HCS Road facilitates the sharing of assays and analysis tools<br />
between groups. Users can review assay data from other groups, determine whether a cell<br />
line or fluorescent probe has been used before, and see how a hit from their assay<br />
performed in previous experiments.<br />
The data management solutions we implemented allow us to handle the large volumes of<br />
data that HCS generates. Database partitioning reduces backup times and improves query<br />
performance; network attached storage systems enable the storage and management of<br />
large numbers of images; and the use of file-based storage with transient database loading<br />
for cell level data allows us to analyze this unique result type while minimizing database<br />
size.<br />
CONCLUSIONS.<br />
Successfully developing an enterprise-wide data management system for HCS results<br />
presents challenges. The diversity of instruments, users and projects begs the question of<br />
whether it is better to develop isolated systems tailored to the requirements of a single<br />
group or instrument type. We concluded that the benefits of an integrated system were<br />
worth the effort required. HCS Road currently supports multiple imaging platforms and<br />
research groups and provides a single point of access for results and experimental<br />
annotation. It facilitates the sharing of assays and data analysis methods between groups<br />
and provides a rich and structured model for annotating cell-based assays.<br />
We chose to develop our own system for HCS data management so that we could<br />
accommodate our needs and workflows and could integrate it with other enterprise<br />
databases. A consequence of this integration is that no two organization’s solutions will<br />
look exactly the same. Large organizations will wish to accommodate their existing<br />
workflows and databases whereas smaller organizations may need to implement some of<br />
those functions within their HCS data management system. We believe that the<br />
requirements and solutions we identified will be informative to other HCS users looking to<br />
develop or purchase their own data management solution.<br />
The system was built using technologies by multiple vendors who made several updates to<br />
their architectures to make optimize the performance and reliability of the solution. The
Published Resources for the Life Sciences<br />
250 First Avenue, Suite 300, Needham, MA 02494 | phone: 781‐972‐5400 | fax: 781‐972‐5425<br />
partitioning techniques first deployed at BMS for this application was later adopted and<br />
standardized by Cellomics.<br />
BMS was one of the first in the Pharmaceutical industry to use Isilon storage for managing<br />
structured as well as unstructured Lab data. Isilon systems accommodated several<br />
suggestions by BMS design team to it’s firmware and architecture which benefited many<br />
other use cases. At BMS, use of Isilon storage was later extended to manage Neuroscience<br />
video files, Mass spectrometry raw & result files, NMR data, Bright field images, HPLC<br />
LIMS contents, Non-chrome LIMS contents and Oracle recovery files generated by<br />
RMAN and Flash recovery systems.
Published Resources for the Life Sciences<br />
250 First Avenue, Suite 300, Needham, MA 02494 | phone: 781‐972‐5400 | fax: 781‐972‐5425<br />
Instruments and<br />
platform data<br />
repositories<br />
Cellomics<br />
Store<br />
database<br />
Reagent and cell<br />
line registries<br />
Enterprise<br />
results<br />
repository<br />
HCS Road Data<br />
Explorer<br />
ArrayScan<br />
Image<br />
share<br />
Image +<br />
Data<br />
share<br />
Services<br />
Image<br />
Conversion<br />
Third-party tools<br />
(TIBCO Spotfire)<br />
Opera<br />
InCell 1000<br />
Image +<br />
Data<br />
share<br />
File<br />
share<br />
Database<br />
HCS Road<br />
FIG. 1. Overview of HCS Road components showing data flow from HCS instruments through<br />
the HCS Road database and file share to data analysis and visualization tools. Blue icons<br />
designate instrument-specific databases and file shares. Green arrows and green box indicate<br />
HCS Road components. Gray arrows indicate data import or export to existing enterprise<br />
databases or third-party analysis tools.
Published Resources for the Life Sciences<br />
250 First Avenue, Suite 300, Needham, MA 02494 | phone: 781‐972‐5400 | fax: 781‐972‐5425<br />
Library<br />
Definition<br />
(external)<br />
Register<br />
Reagents<br />
Define<br />
Plate maps<br />
Register<br />
Barcodes<br />
Assay<br />
Definition<br />
Define or<br />
Select<br />
select<br />
Cell Line<br />
fluorescent<br />
probes<br />
Enter Business<br />
Define or<br />
Metadata<br />
select<br />
• Client group<br />
additional<br />
• Program<br />
compounds<br />
Define master plate layout<br />
• Cell line(s)<br />
• Seeding density<br />
•Probes<br />
• Control/reference treatments<br />
Create<br />
Assay Plates<br />
Analysis<br />
Definition<br />
Select<br />
Measurements<br />
for analysis<br />
Designate<br />
control<br />
treatments for<br />
measurement<br />
• Well-level<br />
•Cell-level<br />
Data<br />
Loading &<br />
Analysis<br />
Create<br />
Imaged<br />
Plates<br />
Calculate<br />
QC Metrics<br />
• Z’<br />
•Mean<br />
•CV<br />
Review results<br />
Reject outliers<br />
Images & Data<br />
from HCS<br />
reader/software<br />
Analyze<br />
Data<br />
Publish results to<br />
enterprise results<br />
database<br />
FIG. 2. Workflow for experiment definition, data import and analysis. White boxes show<br />
workflow steps and colored boxes indicate functional subsets of the process. Black arrows<br />
indicate workflow progression and dependencies between steps.
Published Resources for the Life Sciences<br />
250 First Avenue, Suite 300, Needham, MA 02494 | phone: 781‐972‐5400 | fax: 781‐972‐5425<br />
Available Measurements<br />
Normalized data distribution<br />
Measurement name<br />
TargetActivationV3Well:SelectedObjectCount…<br />
TargetActivationV3Well:MEAN_ObjectAreaCh1<br />
Run 47 Run 48 Run 55<br />
TargetActivationV3Well:MEAN_ObjectShapeP2ACh1<br />
TargetActivationV3Well:MEAN_ObjectTotalIntenCh1<br />
100<br />
TargetActivationV3Well:SelectedObjectCount<br />
TargetActivationV3Well:SelectedObjectCountPerValidF<br />
80<br />
TargetActivationV3Well:ValidObjectCount<br />
60<br />
Value PctInh<br />
40<br />
20<br />
0<br />
-20<br />
-40<br />
-60<br />
Distribution of<br />
ALL normalized<br />
data across all<br />
plates<br />
Data table:<br />
SHADOW results<br />
Color by<br />
Status<br />
NEG<br />
POS<br />
SAMPLE<br />
Reference points<br />
Median<br />
Normalized data statistics<br />
Measurement name, Treatment role<br />
TargetActivationV3Well:Selecte<br />
dObjectCountPerValidField<br />
(Column Names)<br />
NEG POS SAMPLE<br />
UAV 34.45 102.24 103.86<br />
Q3 9.26 100.60 63.69<br />
Median -0.04 100.09 42.43<br />
Q1 -9.05 99.49 23.39<br />
LAV -35.25 97.84 -36.96<br />
Mean + 3SD 40.94 103.30 126.89<br />
Mean 0.00 100.00 43.18<br />
Mean - 3SD -40.94 96.70 -40.54<br />
Summary<br />
statistics for<br />
ALL<br />
normalized<br />
data across all<br />
plates.<br />
Data table:<br />
SHADOW res<br />
NEG POS SAM… NEG POS SAM… NEG POS SAM…<br />
Status<br />
UAV, Q3, Median, Q1, LAV, Mean + 3SD, Mean, Mea…<br />
Wells per treatment<br />
Normalized results for hits<br />
Measurement name, siRNA index<br />
Number of wells that match<br />
6<br />
current filters for each<br />
TargetActivationV3Well:SelectedObjectCountPerV… Grand<br />
Median<br />
treatment<br />
1 2 3 4 (Empty) total<br />
normalized<br />
value for<br />
Data limited by:<br />
5<br />
Gene579 100.37 99.73 99.39 45.73 - - - 99.50<br />
each siRNA<br />
Active measurement<br />
Gene59 83.49 66.61 89.87 58.68 84.88 84.87<br />
for hits<br />
4<br />
Data table:<br />
Gene735 94.31 87.21 82.25 66.20 - - - 84.37<br />
Data table:<br />
Results by well and measure<br />
Gene672 84.69 13.92 96.64 80.50 - - - 84.24<br />
SHADOW r<br />
3<br />
Marking:<br />
Gene254 83.56 94.82 18.03 82.87 - - - 83.56<br />
Color by<br />
Hit treatments<br />
Gene597 79.00 85.68 81.44 55.55 - - - 79.65<br />
Median(Valu<br />
2<br />
Color by<br />
Gene694 81.13 72.30 86.55 53.80 - - - 79.30<br />
Min (5.9<br />
Treatment role<br />
Max (10<br />
Gene195 75.64 71.84 95.17 69.35 - - - 77.26<br />
SAMPLE<br />
1<br />
Gene536 77.07 87.20 78.93 27.19 - - - 77.02<br />
0<br />
Gene150 84.23 91.17 70.13 60.68 - - - 76.60<br />
N NU NU NU NU NU NU NU NU NU NU NU NU NU NU…<br />
Gene109 81.08 62.99 85.96 75.22 - - - 76.29<br />
S SA SA SA SA SA…<br />
SA SA SA SA SA SA SA SA SA<br />
Gene43 86.84 76.77 50.12 75.52 - - - 75.46<br />
Treatment role, treatment,1 Value<br />
Gene98 89.32 76.14 71.90 5.93 - - - 75.15<br />
Treatments per gene<br />
Gene406 80.80 25.61 77.28 75.79 - - - 74.33<br />
Gene611 69.31 72.58 76.66 62.55 - - - 72.13<br />
Gene550 79.76 70.80 71.10 40.41 - - - 71.99<br />
Data limited by:<br />
3<br />
Gene707 74.31 70.90 92.75 28.29 - - - 71.83<br />
Active measurement<br />
Hit treatments<br />
Gene180 71.11 62.81 96.32 71.82 - - - 71.58<br />
Gene335 71.76 83.26 69.17 52.51 - - - 70.30<br />
Data table:<br />
2<br />
Results by well and measure<br />
Gene433 63.75 92.22 41.97 70.78 - - - 66.79<br />
Marking:<br />
Median(Value PctInh)<br />
Hit genes<br />
1<br />
Number of hits<br />
Color by<br />
Treatment role<br />
Count(Well id) 338<br />
Data limited by:<br />
SAMPLE<br />
UniqueCount(treatment… 61<br />
Active measurement<br />
0<br />
UniqueCount(Gene id) 20<br />
Hit genes<br />
5 230 100 597 285 115 167 555 232 185 381 139 687 844 5604<br />
S SA SA SA SA SA SA SA SA SA SA SA SA SA SA…<br />
Data table:<br />
Treatment role, Gene id<br />
UniqueCount(Well id)<br />
UniqueCount(treatment,1 Value)<br />
Gene<br />
(Column N…<br />
Figure 3: TIBCO Spotfire workflow for hit selection from RNAi screens from HCS Road<br />
showing: (top left) table of available measurements; (top center) histograms of cell count percent<br />
inhibition for control and library wells across multiple runs; (top right) table of summary<br />
statistics for normalized cell count for control and library reagents; (middle left) bar chart of<br />
numbers of wells per RNAi reagent with normalized values above a user-defined threshold (blue<br />
shading indicates hit reagents where at least 4 of 6 replicate wells passed the threshold); (bottom<br />
left) bar chart of numbers of individual RNAi reagents per gene where 4 or more replicate wells<br />
passed the normalized value threshold (red shading indicates hit genes where 3 or more<br />
independent RNAi reagents for the same gene were selected as hits); (middle right) table of<br />
median cell count percent inhibition values for all hit genes; (bottom left) numbers of wells,<br />
RNAi reagents and genes selected as hits.
Published Resources for the Life Sciences<br />
250 First Avenue, Suite 300, Needham, MA 02494 | phone: 781‐972‐5400 | fax: 781‐972‐5425<br />
7. REFERENCES/testimonials/supporting internal documents (If necessary; 5 pages max.)<br />
1. Agler M, Prack M, Zhu Y, Kolb J, Nowak K, Ryseck R, Shen D, Cvijic ME, Somerville J, Nadler S, Chen<br />
T: A high-content glucocorticoid receptor translocation assay for compound mechanism-of-action<br />
evaluation. J Biomol Screen 2007; 12:1029-1041.<br />
2. Ross-Macdonald P, de Silva H, Guo Q, Xiao H, Hung CY, Penhallow B, Markwalder J, He L, Attar RM,<br />
Lin TA, Seitz S, Tilford C, Wardwell-Swanson J, Jackson D: Identification of a nonkinase target mediating<br />
cytotoxicity of novel kinase inhibitors. Molecular cancer therapeutics 2008; 7:3490-3498.<br />
3. Zock JM: Applications of high content screening in life science research. Combinatorial chemistry & high<br />
throughput screening 2009; 12:870-876.<br />
4. Dunlay RT, Czekalski WJ, Collins MA: Overview of informatics for high content screening. Methods in<br />
molecular biology (Clifton, NJ 2007; 356:269-280.<br />
5. Goldberg IG, Allan C, Burel JM, Creager D, Falconi A, Hochheiser H, Johnston J, Mellen J, Sorger PK,<br />
Swedlow JR: The Open Microscopy Environment (OME) Data Model and XML file: open tools for<br />
informatics and quantitative analysis in biological imaging. Genome biology 2005; 6:R47.<br />
6. Miaca Draft Specification Retrieved from http://cdnetworks-us-<br />
2.dl.sourceforge.net/project/miaca/Documentation/MIACA_080404/MIACA_080404.pdf.<br />
7. Palmer M, Kremer A, Terstappen GC: A primer on screening data management. J Biomol Screen 2009;<br />
14:999-1007.<br />
8. Ling XB: High throughput screening informatics. Combinatorial chemistry & high throughput screening<br />
2008; 11:249-257.<br />
9. Carpenter AE, Jones TR, Lamprecht MR, Clarke C, Kang IH, Friman O, Guertin DA, Chang JH, Lindquist<br />
RA, Moffat J, Golland P, Sabatini DM: CellProfiler: image analysis software for identifying and quantifying<br />
cell phenotypes. Genome biology 2006; 7:R100.<br />
10. Garfinkel LS: Large-scale data management for high content screening. Methods in molecular biology<br />
(Clifton, NJ 2007; 356:281-291.<br />
11. Zhang JH, Chung TD, Oldenburg KR: A Simple Statistical Parameter for Use in Evaluation and Validation<br />
of High Throughput Screening Assays. J Biomol Screen 1999; 4:67-73.<br />
12. Malo N, Hanley JA, Cerquozzi S, Pelletier J, Nadon R: Statistical practice in high-throughput screening data<br />
analysis. Nature biotechnology 2006; 24:167-175.<br />
13. Giuliano KA, Chen YT, Taylor DL: High-content screening with siRNA optimizes a cell biological<br />
approach to drug discovery: defining the role of P53 activation in the cellular response to anticancer drugs. J<br />
Biomol Screen 2004; 9:557-568.<br />
14. Perlman ZE, Slack MD, Feng Y, Mitchison TJ, Wu LF, Altschuler SJ: Multidimensional drug profiling by<br />
automated microscopy. Science (New York, NY 2004; 306:1194-1198.<br />
15. Low J, Huang S, Blosser W, Dowless M, Burch J, Neubauer B, Stancato L: High-content imaging<br />
characterization of cell cycle therapeutics through in vitro and in vivo subpopulation analysis. Molecular<br />
cancer therapeutics 2008; 7:2455-2463.<br />
16. Collins MA: Generating 'omic knowledge': the role of informatics in high content screening. Combinatorial<br />
chemistry & high throughput screening 2009; 12:917-925.
Bio‐<strong>IT</strong> World <strong>2010</strong> <strong>Best</strong> <strong>Practices</strong> Awards<br />
Nominating Organization name: Cycle Computing<br />
Nominating Organization address: 456 Main Street<br />
Nominating Organization city: Wethersfield<br />
Nominating Organization state: CT<br />
Nominating Organization zip: 06109<br />
Nominating Contact Person: Ashleigh Egan<br />
Nominating Contact Person Title: Account Executive, Articulate<br />
Communications<br />
Nominating Contact Person Phone: 212‐255‐0080 x12<br />
Nominating Contact Person Email: aegan@articulatepr.com<br />
User Organization name: Purdue University<br />
User Organization address: 504 Northwestern Ave.<br />
User Organization city: West Lafayette<br />
User Organization state: IN<br />
User Organization zip: 47907<br />
User Organization Contact Person: John Campbell<br />
User Organization Contact Person Title: Associate Vice President of<br />
Information Technology<br />
User Organization Contact Person Phone: 212‐255‐0080 x12<br />
User Organization Contact Person Email: aegan@articulatepr.com<br />
Project Title:<br />
DiaGrid<br />
Team Leaders name:<br />
Team Leaders title:<br />
Team Leaders Company:<br />
Team Leaders Contact Info:<br />
Team Members name:<br />
Team Members title:<br />
Team Members Company:<br />
Entry Category:<br />
<strong>IT</strong> & <strong>Informatics</strong><br />
Abstract Summary:<br />
Introduction: The demand for computational power at Purdue for<br />
scientific, quantitative and engineering research was rapidly outpacing the<br />
budget for new space, power and servers to run them. At the same time, most<br />
machines across campuses, enterprises or government agencies are only used less<br />
than half of the time. The challenge was to harness these unused computational<br />
cycles for multiple colleges/departments while building a framework that<br />
maintains scalability, management and ease of use.<br />
Purdue wanted to build a grid of idle campus computers/servers and provide the<br />
computational capacity to researchers throughout the nation. By collaborating<br />
with several other campuses, including Indiana University, University of Notre<br />
Dame (Ind.), Indiana State University, Purdue’s Calumet and North Central<br />
campuses and Indiana University‐Purdue University Fort Wayne, Purdue was able to<br />
increase the total capacity to more than 177 teraflops – the equivalent of a $3<br />
million supercomputer requiring several thousand square feet of datacenter space.
Results: Purdue selected the free, open‐source Condor distributed<br />
computing system developed by the University of Wisconsin and the CycleServer<br />
compute management tool from Cycle Computing. Computers in the pool run client<br />
software and efficiently and securely connect them to front‐end servers, to which<br />
jobs are submitted and parceled out to various pool machines when idle. In this<br />
way, tens of thousands of processors can be brought to bear on problems from<br />
various researchers. The work is automatically reshuffled when the owner of a<br />
machine needs it. Using Condor’s flexible policy features, technical staff can<br />
control over when and how their machines are used (on idle, evenings only, etc.).<br />
Today, with more than 28,000 processors, DiaGrid offers more than two million<br />
compute hours per month. The research clusters within the DiaGrid pool average<br />
about 1‐2 percent idle – providing one of the highest utilization levels.<br />
Purdue was able to:<br />
• Squeeze every bit of performance out of each hardware dollar already<br />
spent. Desktop machines are continually providing computational cycles during<br />
off hours and the research clusters average only 1‐2 percent idle.<br />
• Avoid purchasing additional computational capacity by harvesting more<br />
than 177 Teraflops, for two million compute hours a month using hardware it<br />
already owns. Purchasing equivalent cycles would cost more than $3 million.<br />
• Build installation packages that easily pull information from the<br />
CycleServer centralized management tool.<br />
• Achieve something no one has tried before: pooling the variety of<br />
hardware represented in DiaGrid, including computers in campus computer labs,<br />
offices, server rooms and high‐performance research computing clusters running a<br />
variety of operating systems.<br />
• Easily manage policy configuration information with CycleServer, using<br />
repeated templates for machines across various pools of resources with more than<br />
28,000 processors – and a goal of eventually hitting 120,000 processors across<br />
many universities.<br />
• Put owner’s policies in place for when machines could run calculations.<br />
• Get status, reporting and management capabilities across pools of<br />
resources on many campuses.<br />
• Enable creative uses of computation. For example, DiaGrid is used in<br />
creating a virtual pharmacy clean room for training student pharmacists;<br />
rendering fly‐through animation of a proposed satellite city to serve as a refuge<br />
for Istanbul, Turkey, in the event of a catastrophic earthquake; and animating<br />
scenes for “Nano Factor,” a game designed to for junior‐high‐aged kids interested<br />
in science and engineering.<br />
ROI achieved:<br />
Conclusions:<br />
References:
Bio‐<strong>IT</strong> World <strong>2010</strong> <strong>Best</strong> <strong>Practices</strong> Awards<br />
Nominating Organization name: DataDirect Networks, Inc.<br />
Nominating Organization address: 9351 Deering Avenue<br />
Nominating Organization city: Chatsworth<br />
Nominating Organization state: CA<br />
Nominating Organization zip: 91311<br />
Nominating Contact Person: Jeffrey Denworth<br />
Nominating Contact Person Title: VP, Marketing<br />
Nominating Contact Person Phone: 1‐856‐383‐8849<br />
Nominating Contact Person Email: jeffdenworth@hotmail.com<br />
User Organization name: Cornell University Center for Advanced<br />
Computing<br />
User Organization address: 512 Frank H. T. Rhodes Hall<br />
User Organization city: Ithaca<br />
User Organization state: NY<br />
User Organization zip: 14853<br />
User Organization Contact Person: David A. Lifka, PhD<br />
User Organization Contact Person Title: Director, Cornell University<br />
Center for Advanced Computing<br />
User Organization Contact Person Phone: 607‐254‐8621<br />
User Organization Contact Person Email: lifka@cac.cornell.edu<br />
Project Title:<br />
Scalable Research Storage Archive<br />
Team Leaders name:<br />
Team Leaders title:<br />
Team Leaders Company:<br />
Team Leaders Contact Info:<br />
Team Members name: Dr. Jaroslaw Pillardy<br />
Team Members title: Sr. Researcher at Cornell’s Computational Biology<br />
Service Unit<br />
Team Members Company: Cornell University<br />
Entry Category:<br />
<strong>IT</strong> & <strong>Informatics</strong><br />
Abstract Summary:<br />
Introduction: The Cornell Center for Advanced Computing (CAC) is a<br />
leader in high‐performance computing system, application, and data solutions that<br />
enable research success. As an early technology adopter and rapid prototyper, CAC<br />
helps researchers accelerate scientific discovery.<br />
Located on the Ithaca, New York campus of Cornell University, CAC serves faculty<br />
and industry researchers from dozens of disciplines, including biology,<br />
behavioral and social sciences, computer science, engineering, geosciences,<br />
mathematics, physical sciences, and business.<br />
The center operates Linux, Windows, and Mac‐based <strong>HPC</strong> clusters and the staff<br />
provides expertise in <strong>HPC</strong> systems and storage; application porting, tuning, and<br />
optimization; computer programming; database systems; data analysis and workflow<br />
management; Web portal design, and visualization.
CAC network connectivity includes the national NSF TeraGrid and New York State<br />
Grid.<br />
The DataDirect Networks S2A9700 storage system is used as the central storage<br />
platform for a number of departments and applications. Initially deployed for<br />
backup and archival storage, CAC is increasingly using the S2A9700 as front‐line<br />
storage for applications such as genome sequencing.<br />
Since CAC provides services to a wide range of Cornell departments and<br />
applications, implementing centralized storage platforms is critical in ensuring<br />
an efficient, reliable and cost‐effective infrastructure.<br />
Cornell researchers were considering buying commodity, off‐the‐shelf storage<br />
solutions to locally store their research data. While the cost of such technology<br />
appeared initially low – the lack of coordination, data protection and system<br />
reliability detracted from the long‐term value of this approach. As research<br />
productivity and access to data are directly correlated – the primary focus of<br />
the storage solution had to be high reliability and scalability.<br />
It was clear that an affordable, centrally managed, highly available research<br />
storage system was needed in order to control costs and also to ensure that<br />
researchers remained productive. Accommodating a variety of applications and<br />
departments would prove a challenge for ordinary storage systems, but the DDN<br />
S2A9700 proved capable even beyond the initial scope of the project.<br />
Results: The center selected an S2A9700 storage system from DDN with<br />
40TB unformatted capacity in RAID‐ 6 configurations. DDN partnered with Ocarina<br />
Networks to provide transparent, content‐aware storage optimization at CAC,<br />
reducing the overall capacity need by more than 50 percent. For some Microsoft<br />
SQL database applications, a compression rate of up to 82 percent was achieved.<br />
DDN storage technology enables massive scalability and capacity optimization<br />
through storage collaboration. As compared to other storage technologies in it's<br />
class ‐ the S2A9700 features industry leading throughput (at over 2.5GB/s per<br />
system), capacity (scalable to hold up to<br />
2.4 Petabytes in a single system) and data center efficiency (DDN systems are the<br />
densest in the industry, housing up to 600 hard drives in a single data center<br />
rack ‐ also featuring Dynamic MAID power management technology). The combination<br />
of the S2A9700 system scale and the data center optimized configuration proved to<br />
Cornell that installing and adding capacity could be done very cost‐effectively<br />
and the system could scale to meet the Center's evolving storage volume<br />
requirements without a forklift upgrade.<br />
"We have been very impressed with the performance DDN's S2A9700 delivers,"<br />
said David A. Lifka, CAC director. "For genomics research ‐ Cornell uses Solexa<br />
Sequencers and the DDN storage system is directly connected to the compute<br />
cluster, while at the same time continuing to provide backup and archive storage<br />
for our other projects and departments."<br />
‐ David A. Lifka, CAC Director<br />
Ocarina’s ECOsystem platform uses an innovative approach to data reduction. The<br />
ECOsystem first extracts files into raw binary data and applies object boundaries
to the data. It then applies object dedupe and content‐aware compression to the<br />
natural semantic objects found within.<br />
The object dedupe approach finds object duplicates in compressed, encoded data<br />
that would never be found using standard block dedupe. After processing object<br />
duplicates, the ECOsystem then applies content specific compression to the<br />
remaining unique object. This dual approach provides better space savings than<br />
either block dedupe or generic compression alone would. Ocarina’s ECOsystem<br />
includes multiple data compressors for the types of files commonly found in<br />
research computing environments and includes over 100 algorithms that support 600<br />
file types.<br />
> ROI achieved:<br />
As compared to the alternative of disparate storage "islands" managed by various<br />
independent departments, Cornell experienced a substantial ROI through the<br />
consolidation and optimization of a globally accessible storage pool.<br />
By deploying scalable, high‐speed DDN S2A Storage with intelligent Ocarina data<br />
optimization software, Cornell projected a nearly full return on investment<br />
within as little as one year. Aggregate capacity requirements were reduced,<br />
administration was consolidated and economies of scale were gained. It is<br />
expected that the savings associated with a cost‐effective<br />
(capacity‐optimized) petabyte‐scalable storage pool, in addition to the FTE<br />
savings the University realized, will have fully paid for the new system within<br />
12 months time.<br />
> Conclusions:<br />
As multi‐departmental and multi‐application organizations adopt higher fidelity<br />
research tools and engage in high‐throughput research, storage requirements will<br />
balloon across the enterprise. As evidenced at Cornell, a well planned storage<br />
consolidation, optimization and deployment strategy can not only allow<br />
researchers to focus on research, but also aids organizations through substantial<br />
cross‐departmental budgetary relief. Scalable storage systems from DataDirect<br />
Networks, coupled with intelligent file‐format‐aware Ocarina Networks storage<br />
optimization software, have proven to enable consolidation, savings and<br />
simplification with tools optimized for the life sciences researcher.<br />
References: DDN Case Study:<br />
http://www.datadirectnet.com/index.php?id=246<br />
Drug Discovery News Article:<br />
http://www.drugdiscoverynews.com/index.php?newsarticle=2787<br />
GenomeWeb Article:<br />
http://www.genomeweb.com/informatics/ocarina‐pitches‐content‐aware‐compressionapproach‐storing‐life‐science‐data?page=1
Published Resources for the Life Sciences<br />
250 First Avenue, Suite 300, Needham, MA 02494 | phone: 781‐972‐5400 | fax: 781‐972‐5425<br />
Bio‐<strong>IT</strong> World <strong>2010</strong> <strong>Best</strong> <strong>Practices</strong> Awards<br />
1. Nominating Organization (Fill this out only if you<br />
are nominating a group other than your own.)<br />
A. Nominating<br />
Organization<br />
Organization name:<br />
FalconStor Software<br />
Address:<br />
B. Nominating Contact Person<br />
Name:<br />
Kathryn Ghita<br />
Title:<br />
PR<br />
Tel:<br />
617‐236‐0500<br />
Email:<br />
Kathryn.ghita@<br />
@metiscomm.com<br />
2. User Organization (Organization at which the solution was deployed/applied)<br />
A. User Organization<br />
Organization name:<br />
Address:<br />
Human Neuroimaging Lab – Baylor Collegee of Medicine<br />
1 Baylor Place, Houston, TX 77030<br />
B. User Organization Contact Person<br />
Name:<br />
Justin King<br />
Title:<br />
Systems Administrator<br />
Tel:<br />
713‐798‐4035<br />
Email: jking@hnl. .bcm.edu<br />
3. Project<br />
Project Title:<br />
Team Leader Name:<br />
Justin King<br />
Title: Systems Administrator<br />
Tel:<br />
713‐798‐4035<br />
Email: jking@hnl. .bcm.edu<br />
Team members – name(s), title(s) and company (optional):<br />
4. Category in which entry is being<br />
submitted (1 category per entry, highlight your choice)<br />
Basic Research & Biological Research: Disease pathway research, applied and basic research<br />
Drug Discovery & Development: Compound‐focused research, drug<br />
safety<br />
Clinical Trials & Research: Trial design, eCTD<br />
Translational Medicine: Feedback loops, predictive technologies<br />
Personalized Medicine: Responders/non‐responders,<br />
biomarkers
Published Resources for the Life Sciences<br />
250 First Avenue, Suite 300, Needham, MA 02494 | phone: 781‐972‐5400 | fax: 781‐972‐5425<br />
<strong>IT</strong> & <strong>Informatics</strong>: LIMS, High<br />
Performancee Computing, storage, data visualization,<br />
imaging technologies<br />
Knowledge Management: Data mining, idea/expertisee mining, text mining, collaboration, resource<br />
optimization<br />
Health‐<strong>IT</strong>: ePrescribing, RHIOs, EMR/PHRR<br />
Manufacturing & Bioprocessing: Mass production, continuous manufacturing<br />
(Bio‐<strong>IT</strong> World reserves the right to re‐categorize submissions based on submission or in the<br />
event that a category<br />
is refined.)<br />
5. Description of project (4 FIGURES MAXIMUM) ):<br />
A. ABSTRACT/SUMMARY<br />
of the project<br />
and results (150 words max.)<br />
The Human Neuroimaging Laboratory (HNL) is part of the Department of Neuroscience at Baylor<br />
College of<br />
Medicine thatt concentrates on research projects covering<br />
neuroscience, psychology, political<br />
science and economics. This groundbreaking research requires a reliable infrastructure to match<br />
the<br />
speed of discovery. Previously relying<br />
on standard tape and disk-to-disk backups, the HNL was<br />
handcuffedd by cumbersome management and disk space constraints. With a small <strong>IT</strong> staff, the HNL set<br />
out to enhance its storage<br />
management processes, without disruption, to accomplish the goals of<br />
improving<br />
reliability, increasing retention and becoming less dependent on tape. Through the use of<br />
technologies such as virtual tape libraries (VTL) and data deduplication, the HNL<br />
was able to protect the<br />
invaluable<br />
data and more<br />
efficiently to keep up with the daily demand of cutting-edge neuroscience<br />
research.<br />
B. INTRODUCTION/background/objectives<br />
As one the<br />
top 10 medical and research institutions, the HNL focuses on researching social<br />
interaction through hyperscanning, a method by which multiple subjects, each in a separate MRI<br />
scanners, can interact with one another<br />
while their brains are simultaneously scanned. Scientistss use the<br />
Internet to<br />
control multiple scanners, even if they are located thousands of miles apart in different centers,<br />
to scan and<br />
monitor brain<br />
activity simultaneously while they are interacting with each other.<br />
Researchers at The HNL<br />
are running hyperscans at the same time and the solution<br />
was needed to<br />
take<br />
each of these scans as they were done and consistently back them up. Experiments are extremely difficult,<br />
time consuming and expensive to reproduce, so the data storage solution needed to<br />
save it quickly and<br />
reliability. Once the scans were completed, three copies of each file<br />
would be made to do three different<br />
types of analysis, creating a glut of similar data on the<br />
system.<br />
The HNL needed a more<br />
reliable data storage infrastructure to store<br />
these multiple<br />
scans during data<br />
analysis, as well as ensure that no of the information was lost. Previously, The HNL was using a physical<br />
tape backup solution thatt required swapping out of tapes during a backup as well as putting a limit on the<br />
length any<br />
data may be retained.<br />
In addition, Systems Administrator, Justin King, was<br />
often called upon to fix tape<br />
backup issues, as well<br />
as constantly switch out the various tapes. As a result, King lost valuable research<br />
time on updating and<br />
perfecting the hyperscanning software. King was determined to find a simpler solution that could run
Published Resources for the Life Sciences<br />
250 First Avenue, Suite 300, Needham, MA 02494 | phone: 781‐972‐5400 | fax: 781‐972‐5425<br />
without his constant attention, grow with The HNL demands for storage while providing a much<br />
reliable,<br />
quick dataa protection solution.<br />
C. RESULTS (highlight major R&D/<strong>IT</strong> tools deployed; innovative uses of technology).<br />
King’s goal in finding a new solution was to end the reliance on tape as a data protection solution. Tape<br />
was proving to be too faulty and unreliable. Althoughh he could have bought more<br />
disks and tapes to<br />
continue with the same data protection,<br />
King felt thatt a different solution would be able to scale with<br />
HNL better in the future,<br />
as well as increase reliability.<br />
From researching various data backup solutions, King<br />
chose a virtual tale library (VTL) solution<br />
with<br />
deduplication that would<br />
easily integrate into the existing VMware environment. The FalconStor VTL<br />
with data deduplication allowed King to complete faster, more reliable backups, while the data<br />
deduplication feature reduced the amount of data thatt needed to be stored on a disk. In fact, the<br />
implementation of the VTL solution was done with little to no change needed to the backup environment.<br />
The fact that there wasn’ ’t any extensivee architecting or hardware changes needed to implement the new<br />
VTL solution made it an<br />
even better solution as King<br />
was able to get it running quickly.<br />
Prior to the VTL solution, all the information was backed up regardless of similar data and files.<br />
The<br />
deduplication feature has<br />
greatly increased the amount of files saved<br />
with a 15:1 ratio – or out of<br />
15<br />
similar files; 1 is processed and stored for backup. The HNL’s storage footprint was greatly reduced so<br />
that more data could be stored for longer lengths of time.<br />
The additional data storage time allows for<br />
quicker and deeper research into the discovery process of the brain.<br />
The FalconStor VTL solution with deduplication greatly reduced the backup issues, freeing King’s time to<br />
focus on improving the hyperscanning software and other research topics. At any<br />
given there may be<br />
multiple people running MRIs or analyzing the scans, so each hyperscan is extremely important to<br />
achieving greater understanding the brain and how individuals react<br />
to one another. The VTL with data<br />
deduplication ensures that no information is lost regardless of the amount of people using the data or new<br />
scans being added to the system.<br />
D. ROI achieved or expected (200 words max.):<br />
The greatest value of the VTL with data deduplication solution has been the simplification of HNL’s<br />
data protection solution. King has since achieved a six‐fold increase in data retention rates<br />
for the<br />
hyperscans from one month to six months with the ability to extend this out to a full 12 months if it<br />
needed. The improved retention time allows for more in‐depth<br />
analysis, social interactionn research<br />
and a greater overall understanding<br />
of brain functions and processes.<br />
The improved reliability<br />
of the virtual solution over the physical tape allowed<br />
King to<br />
to fully focus on the research neededd for major diseases such as<br />
personality disorders and others.<br />
His time is<br />
no longer spent switching<br />
out tapes or fixing problems that resulted in a faulty backup.<br />
The data deduplication<br />
ROI is seen in<br />
the ratio of data files to those actually processed and<br />
saved<br />
for backup. The 15:1 ratio means that 150 TB of logical data could be stored on a 10TB disk. With<br />
more information on a smaller disk size, data retention rates increased exponentially allowing the
Published Resources for the Life Sciences<br />
250 First Avenue, Suite 300, Needham, MA 02494 | phone: 781‐972‐5400 | fax: 781‐972‐5425<br />
researchers longer access to the dataa with the aim<br />
of learning more about various brain functions;<br />
brain disorders and other issues.<br />
E. CONCLUSIONS/implications for the field.<br />
The most<br />
compelling aspect of The HNL’s story<br />
is there are solutions on the market there where<br />
one person, such as King, could run<br />
a lab while also being able to conduct important research<br />
into the brain. As a successful implementation within a data‐intensive lab, it is a proof point for<br />
other labs<br />
or research firms looking for a scalable, reliable data protection solution that may be<br />
quickly installed with minimal environment change. As the FalconStor data protection solution is an<br />
out‐of the‐box solution for most environments, King was able to<br />
install it and<br />
forget about it within<br />
a short period of time.<br />
The HNL<br />
research is vital to understanding the brain and how<br />
it processes information in a<br />
variety of<br />
environments. This research may help<br />
lead to breakthrough in a number of areas<br />
including<br />
for conditions such as Parkinson’s, schizophrenia, Autism as well as other disorders.<br />
With a secure data protection solution in place, The HNL could focus on what it does best –<br />
conducting ground breaking research into analyzing the brain<br />
and creating better measurement<br />
and research solutions.<br />
6. REFERENCES/testimonials/supporting internal documents (If necessary; 5 pages max.)
Bio‐<strong>IT</strong> World <strong>2010</strong> <strong>Best</strong> <strong>Practices</strong> Awards<br />
Nominating Organization name: Isilon Systems<br />
Nominating Organization address: 3101 Western Ave<br />
Nominating Organization city: Seattle<br />
Nominating Organization state: WA<br />
Nominating Organization zip: 98121<br />
Nominating Contact Person: Lucas Welch<br />
Nominating Contact Person Title: PR Manager<br />
Nominating Contact Person Phone: 206‐315‐7621<br />
Nominating Contact Person Email: lucas.welch@isilon.com<br />
User Organization name: Oklahoma Medical Research Foundation<br />
User Organization address: 825 NE 13th Street<br />
User Organization city: Oklahoma City<br />
User Organization state: OK<br />
User Organization zip: 73104<br />
User Organization Contact Person: Stuart Glenn<br />
User Organization Contact Person Title: Software Engineer<br />
User Organization Contact Person Phone: 405‐271‐7933 x35287<br />
User Organization Contact Person Email: stuart‐glenn@omrf.org<br />
Project Title:<br />
Transition to Nextgen Sequencing and Virtual Data Center<br />
Team Leaders name: Stuart Glenn<br />
Team Leaders title: Software Engineer<br />
Team Leaders Company: OMRF<br />
Team Leaders Contact Info: 405‐271‐7933 x35287, stuart‐glenn@omrf.org<br />
Team Members name:<br />
Team Members title:<br />
Team Members Company:<br />
Entry Category:<br />
<strong>IT</strong> & <strong>Informatics</strong><br />
Abstract Summary:<br />
Introduction: Oklahoma Medical Research Foundation (OMRF), a leading<br />
nonprofit biomedical research institute, experienced an unprecedented influx of<br />
mission‐critical, genetic information with the introduction of a high‐powered,<br />
next‐generation Illumina Genome Analyzer and server virtualization. To maximize<br />
both its infrastructure investment and the value of its genetic data, OMRF needed<br />
a storage solution capable of keeping pace with its tremendous data growth while<br />
still powering its virtual data center without the burden of costly upgrades and<br />
tedious data migrations<br />
In its efforts to identify more effective treatments for human disease, OMRF<br />
generates tremendous amounts of mission‐critical genomic information.<br />
This data is then processed and analyzed using Linux computer servers running the<br />
VMware ESX virtualization software application. With its previous NAS system,<br />
OMRF would have been forced to migrate genetic information back and forth between<br />
disparate data silos, slowing sequencing runs and depriving its virtual servers<br />
of the data access and high throughput necessary to realize the full potential of<br />
virtualized computing.
Results: Using scale‐out NAS from Isilon Systems, OMRF has unified both<br />
its DNA sequencing pipeline and virtualized computing infrastructure into a<br />
single, high performance, highly scalable, shared pool of storage, simplifying<br />
its <strong>IT</strong> environment and significantly speeding time‐to‐results.<br />
OMRF can now scale its storage system on‐demand to meet the rapid data growth and<br />
unique performance demands of its mission‐critical workflow, increasing<br />
operational efficiency and decreasing costs in an effort to identify genetic<br />
precursors to diseases such as Alzheimer’s, Lupus and Sjögren’s Syndrome.<br />
With its scale‐out NAS solution, OMRF has created a single, highly reliable<br />
central storage resource for both its entire next‐generation sequencing workflow<br />
and its virtual computing infrastructure, dramatically simplifying storage<br />
management and streamlining data access across its organization. Today, OMRF can<br />
cost‐effectively manage rapid data growth from a single file system, eliminating<br />
data fragmentation caused by traditional NAS in virtual environments and<br />
maximizing the performance of both its virtual servers and its DNA sequencing<br />
workflow.<br />
By deploying a second Isilon system off‐site and using Isilon’s SyncIQ®<br />
asynchronous data replication software to replicate data between its primary and<br />
off‐site clusters, OMRF also has a highly reliable solution in place to ensure<br />
its data is immediately available even in the case of <strong>IT</strong> failure or natural<br />
disaster.<br />
ROI achieved:<br />
Conclusions:<br />
References:
Published Resources for the Life Sciences<br />
250 First Avenue, Suite 300, Needham, MA 02494 | phone: 781‐972‐5400 | fax: 781‐972‐5425<br />
Bio‐<strong>IT</strong> World <strong>2010</strong> <strong>Best</strong> <strong>Practices</strong> Awards<br />
1. Nominating Organization (Fill this out only if you are nominating a group other than your own.)<br />
A. Nominating Organization<br />
Organization name:<br />
Address:<br />
B. Nominating Contact Person<br />
Name:<br />
Title:<br />
Tel:<br />
Email:<br />
2. User Organization (Organization at which the solution was deployed/applied)<br />
A. User Organization<br />
Organization name: National Institute of Allergy and Infectious Diseases (NIAID)<br />
Address: 10401 Fernwood Rd., Bethesda, MD 20892<br />
B. User Organization Contact Person<br />
Name: Nick Weber<br />
Title: Scientific <strong>Informatics</strong> & Infrastructure Analyst<br />
Tel: 301.594.0718<br />
Email: webermn@niaid.nih.gov<br />
3. Project<br />
Project Title: A Centralized and Scalable Infrastructure Approach to Support Next Generation Sequencing<br />
at the National Institute of Allergy and Infectious Diseases<br />
Team Leader<br />
Name: Nick Weber (Lockheed Martin Contractor)<br />
Title: Scientific <strong>Informatics</strong> & Infrastructure Analyst<br />
Tel: 301.594.0718<br />
Email: webermn@niaid.nih.gov<br />
Team members – name(s), title(s) and company (optional):<br />
• Vivek Gopalan – Scientific Infrastructure Lead (Lockheed Martin Contractor)<br />
• Mariam Quiñones – Computational Molecular Biology Specialist (Lockheed Martin Contractor)<br />
• Hugo Hernandez – Senior Systems Administrator (Dell Perot Systems Contractor)<br />
• Robert Reed – Systems Administrator (Dell Perot Systems Contractor)<br />
• Kim Kassing – Branch Chief, Operations and Engineering Branch (NIAID Employee)
Published Resources for the Life Sciences<br />
250 First Avenue, Suite 300, Needham, MA 02494 | phone: 781‐972‐5400 | fax: 781‐972‐5425<br />
• Yentram Huyen – Branch Chief, Bioinformatics and Computational Biosciences Branch (NIAID<br />
Employee)<br />
• Michael Tartakovsky – NIAID Chief Information Officer and Director of Office of Cyber Infrastructure<br />
and Computational Biology (NIAID Employee)<br />
4. Category in which entry is being submitted (1 category per entry, highlight your choice)<br />
Basic Research & Biological Research: Disease pathway research, applied and basic research<br />
Drug Discovery & Development: Compound‐focused research, drug safety<br />
Clinical Trials & Research: Trial design, eCTD<br />
Translational Medicine: Feedback loops, predictive technologies<br />
Personalized Medicine: Responders/non‐responders, biomarkers<br />
<strong>IT</strong> & <strong>Informatics</strong>: LIMS, High Performance Computing, storage, data visualization, imaging technologies<br />
Knowledge Management: Data mining, idea/expertise mining, text mining, collaboration, resource<br />
optimization<br />
Health‐<strong>IT</strong>: ePrescribing, RHIOs, EMR/PHR<br />
Manufacturing & Bioprocessing: Mass production, continuous manufacturing<br />
(Bio‐<strong>IT</strong> World reserves the right to re‐categorize submissions based on submission or in the event that a category<br />
is refined.)<br />
5. Description of project (4 FIGURES MAXIMUM):<br />
A. ABSTRACT/SUMMARY of the project and results (150 words max.)<br />
Recent advances in the “next generation” of sequencing technologies have enabled high‐throughput<br />
sequencing to expand beyond large specialized facilities and into individual research labs. Improved<br />
chemistries, more powerful software, and parallel sequencing capabilities have led to the creation of many<br />
terabytes of data per instrument per year that will serve as the basis for diverse genomic research.<br />
In order to manage the massive amounts of data, many researchers will require assistance from <strong>IT</strong> experts and<br />
bioinformaticians to store, transfer, process, and analyze all the data generated in their labs. The Office of<br />
Cyber Infrastructure and Computational Biology (OCICB) at the National Institute of Allergy and Infectious<br />
Diseases (NIAID) has developed a centralized and scalable infrastructure to support Next Generation<br />
Sequencing efforts across the Institute. Primary goals of this approach are to standardize practices for data<br />
management and storage and to capitalize on the efficiencies and cost savings of a shared high‐performance<br />
computing infrastructure.<br />
B. INTRODUCTION/background/objectives<br />
The Office of Cyber Infrastructure and Computational Biology (OCICB) manages technologies supporting NIAID<br />
biomedical research programs. The Office provides a spectrum of management, technologies development,<br />
applications/software engineering, bioinformatics support, and professional development. Additionally, OCICB<br />
works closely with NIAID intramural, extramural, and administrative staff to provide technical support, liaison,<br />
coordination, and consultation on a wide variety of ventures. These projects and initiatives are aimed at<br />
ensuring ever‐increasing interchange and dissemination of scientific information within the Federal
Published Resources for the Life Sciences<br />
250 First Avenue, Suite 300, Needham, MA 02494 | phone: 781‐972‐5400 | fax: 781‐972‐5425<br />
Government and among the worldwide scientific network of biomedical researchers. Both the Operations and<br />
Engineering Branch (OEB) and the Bioinformatics and Computational Biosciences Branch (BCBB) are branches<br />
of the OCICB.<br />
The OEB provides technical and tactical cyber technologies management and support for NIAID extramural<br />
biomedical research programs. OEB delivers essential and assured services to facilitate communication using<br />
electronic systems and a collegial, authorized, and accessible framework for automated information sharing<br />
and collaboration. The BCBB provides three suites of scientific services and resources for the NIAID research<br />
community and its collaborators: Biocomputing Research Consulting, Bioinformatics Software Development,<br />
and Scientific Computing Infrastructure.<br />
The primary objectives of the ‘Centralized and Scalable NIAID Infrastructure’ project include the following:<br />
• To assist NIAID laboratories in assessing their infrastructure needs for data storage and analysis of<br />
massively‐parallel sequencing.<br />
• To procure, operate, and maintain computing hardware that supports the data storage and processing<br />
needs for Next Generation Sequencing across the Institute.<br />
• To procure, build, and assist in the use of third‐party applications to be hosted on the NIAID Linux High<br />
Performance Computing Cluster.<br />
• To provide a robust, reliable, cost‐effective, and scalable cyber infrastructure that will serve as the<br />
foundation to support Next Generation Sequencing at the NIAID.<br />
A secondary objective of this project is to develop a standardized process for handling infrastructure requests<br />
for similar high‐performance computing endeavors that will require access to large amounts of data storage<br />
and processing.<br />
Project responsibilities of the OCICB Operations and Engineering Branch include:<br />
• Designing and provisioning appropriate resources to meet the scientific and business goals of the<br />
Institute<br />
• Consulting regularly with clients to assess performance and modify the core facility to maintain<br />
appropriate performance<br />
• Selecting and managing the operating system, grid engine, and parallelizing software for computing<br />
resources<br />
• Selecting, developing, maintaining, and managing computing resources pursuant to effective processing<br />
of associated data<br />
• Selecting, developing, maintaining, and managing the enterprise storage components<br />
• Selecting, developing, maintaining, and managing effective networking components<br />
• Managing the security of the data, operating systems, appliances, and applications<br />
• Provisioning user accounts necessary for user applications<br />
• Collaborating with the Bioinformatics and Computational Biosciences Branch to ensure appropriate<br />
resources are provisioned that enable effective use of the facility<br />
The Bioinformatics and Computational Biosciences Branch’s responsibilities include:<br />
• Facilitating coordination and communications among OCICB groups and NIAID laboratories
Published Resources for the Life Sciences<br />
250 First Avenue, Suite 300, Needham, MA 02494 | phone: 781‐972‐5400 | fax: 781‐972‐5425<br />
• Maintaining a shared intranet portal for collaboration and document sharing between the OCICB and<br />
NIAID laboratories<br />
• Documenting minimum requirements for software applications that will be hosted on the NIAID Linux<br />
High Performance Computing Cluster (in order to aid OEB in the determination of hardware specifications<br />
for the cluster)<br />
• Working with the NIAID laboratories to analyze and document workflows/pipelines for downstream data<br />
analysis<br />
• Installing, maintaining, upgrading, and supporting software applications on the NIAID Linux High<br />
Performance Computing Cluster<br />
• Providing user‐friendly, web‐based interfaces to software applications hosted on the NIAID Linux High<br />
Performance Computing Cluster<br />
• Evaluating and selecting a Laboratory Information Management System (LIMS) to assist with end‐to‐end<br />
processing and analysis of Next Generation Sequencing data<br />
C. RESULTS (highlight major R&D/<strong>IT</strong> tools deployed; innovative uses of technology).<br />
The OCICB’s Operations and Engineering Branch (OEB) has made several significant investments to support<br />
Next Generation Sequencing research, including improvements in the NIAID network, in data storage and<br />
processing hardware, and in the personnel required to build and maintain this infrastructure. Specific upgrades<br />
include the following:<br />
• Expansion of network bandwidth from 1 to 10 gigabits per second to support increased network traffic<br />
between NIAID research labs and the NIAID Data Center<br />
• Construction of a high‐speed and highly‐dense enterprise storage system, originally built at 300‐<br />
terabyte capacity but rapidly scalable to up to 1.2 petabytes<br />
• Creation of a high‐performance Linux computing cluster hosting many third‐party applications that<br />
enables efficient data processing on a scalable and high‐memory pool of resources<br />
• Deployment of a localized mirror of the UCSC Genome Browser for rapid data visualization and sharing<br />
In addition to these upgrades, the OCICB’s Bioinformatics and Computational Biosciences Branch (BCBB) will<br />
provide bioinformatics collaboration and support to researchers. Specific resources that will be provided<br />
include the following:<br />
• End‐to‐end laboratory information management system (LIMS) to support sample preparation and<br />
tracking; task assignment; interaction with the instrument; downstream analysis and custom pipelines<br />
between applications; data sharing; and data publication/visualization<br />
• Training on the use of bioinformatics applications and development of custom workflows and<br />
application pipelines to streamline data analysis<br />
• Collaboration on the data integration, analysis, and annotation/publication processes<br />
Some policy decisions for using the centralized infrastructure have yet to be made, including formalizing<br />
procedures for long‐term data retention as well as balancing data privacy/security requirements while<br />
concurrently facilitating data sharing and publication. Nevertheless, NIAID’s centralized approach highlights<br />
the need for a cooperative partnership between bench researchers, computational scientists, and <strong>IT</strong><br />
professionals in order to advance modern scientific exploration and discovery.
Published Resources for the Life Sciences<br />
250 First Avenue, Suite 300, Needham, MA 02494 | phone: 781‐972‐5400 | fax: 781‐972‐5425<br />
D. ROI achieved or expected (200 words max.):<br />
Expected returns on this investment are many and include the tangible and intangible benefits and cost<br />
avoidance measures listed below:<br />
Tangible Benefits:<br />
• Cost savings through reduction of people‐hours for <strong>IT</strong> development, application deployment, system<br />
maintenance, and customer support for centralized implementation (versus distributed<br />
implementations to support labs separately)<br />
Intangible Benefits:<br />
• Improved security/reduced risk by managing a single, centralized pool of infrastructure resources<br />
(includes enterprise‐level security, storage, and back‐up; dedicated virtual LAN; failover/load‐sharing<br />
file services cluster and scheduler; and a single, formal disaster recovery and continuity of operations<br />
plan)<br />
• Increased awareness of bioinformatics resources available to labs at NIAID and other NIH Institutes<br />
• Elevated access to single, integrated team of subject matter experts including system administrators,<br />
infrastructure analysts, bioinformatics developers, and sequence analysis experts<br />
• Enhanced collaboration with research organizations external to NIAID that will take advantage of<br />
high‐performance computing environment<br />
• Improved research productivity to work toward combating/eradicating critical diseases<br />
Cost Avoidance:<br />
• Efficient use of centralized storage and computing resources used at higher capacity<br />
• Leveraged energy efficiency of data center power and cooling systems<br />
• Estimated 5‐fold savings in software licensing fees for shared deployment on cluster<br />
• Limited consolidation and migration costs for systems/data in centralized implementation<br />
E. CONCLUSIONS/implications for the field.<br />
Genomic research is a rapidly growing field with broad implications at the NIAID and in the global<br />
research community in general. Rather than having laboratory staff attempt to develop the requisite<br />
storage, network, and computing capacity themselves, NIAID’s Chief Information Officer has made a<br />
significant investment to centralize infrastructure resources in order to maximize efficiency and minimize<br />
cost and risk. Major network and storage upgrades, in addition to the construction of a powerful and<br />
scalable Linux computing cluster, are the most visible parts of this investment. However, additional<br />
personnel – including an experienced Linux Systems Administrator and bioinformatics support staff –<br />
have also been acquired. By utilizing the centralized infrastructure and resources, researchers doing<br />
important and influential work in immunology, vaccinology, and many other research areas that are<br />
immensely beneficial to the public will be better able to conduct their research.<br />
Large datasets and powerful multi‐core computers are not unique to Next Generation Sequencing. Other<br />
research areas of interest at the NIAID will also benefit from the new high‐performance computing<br />
resources. The NIAID has been able to reuse many of its successful development, procurement, and
Published Resources for the Life Sciences<br />
250 First Avenue, Suite 300, Needham, MA 02494 | phone: 781‐972‐5400 | fax: 781‐972‐5425<br />
communications processes of this project to continue to foster cooperation between bench researchers,<br />
bioinformaticians, and <strong>IT</strong> professionals. Sharing this experience as a best practice – including highlighting<br />
the hurdles and setbacks in addition to the progress – can provide a strong starting point for other<br />
organizations that plan to increase their Next Generation Sequencing and high‐performance computing<br />
capabilities.<br />
1. REFERENCES/testimonials/supporting internal documents (If necessary; 5 pages max.)
Published Resources for the Life Sciences<br />
250 First Avenue, Suite 300, Needham, MA 02494 | phone: 781‐972‐5400 | fax: 781‐972‐5425<br />
Bio‐<strong>IT</strong> World <strong>2010</strong> <strong>Best</strong> <strong>Practices</strong> Awards<br />
1. Nominating Organization (Fill this out only if you are nominating a group other than your own.)<br />
A. Nominating Organization<br />
Organization name: Panasas<br />
Address: 6520 Kaiser Drive, Fremont, CA 94555<br />
B. Nominating Contact Person<br />
Name: Angela Griffo, Trainer Communications (agency contact)<br />
Title: Director<br />
Tel: 949‐240‐1749<br />
Email: agriffo@trainercomm.com<br />
2. User Organization (Organization at which the solution was deployed/applied)<br />
A. User Organization<br />
Organization name: Uppsala University<br />
Address: P.O. Box 256 SE‐751 05 Uppsala, Sweden<br />
B. User Organization Contact Person<br />
Name: Ingela Nystrom PhD<br />
Title: Director of Uppsala Multidisciplinary Center for Advanced Computational Science (UPPMAX)<br />
Tel: +46 70 1679045<br />
Email: Ingela.Nystrom@cb.uu.se<br />
3. Project<br />
Project Title: UPPNEX<br />
Team Leader<br />
Name: Ingela Nystrom<br />
Title: Director<br />
Tel: +46 70 1679045<br />
Email: Ingela.Nystrom@cb.uu.se<br />
Team members – name(s), title(s) and company (optional):<br />
Professor Kerstin Lindblad‐Toh, Broad Institute/Uppsala University<br />
PhD Jukka Komminaho, Systems expert manager of UPPMAX, Uppsala University<br />
Jonas Hagberg, Systems expert of UPPMAX, Uppsala University<br />
4. Category in which entry is being submitted (1 category per entry, highlight your choice)<br />
Basic Research & Biological Research: Disease pathway research, applied and basic research
Published Resources for the Life Sciences<br />
250 First Avenue, Suite 300, Needham, MA 02494 | phone: 781‐972‐5400 | fax: 781‐972‐5425<br />
Drug Discovery & Development: Compound‐focused research, drug safety<br />
Clinical Trials & Research: Trial design, eCTD<br />
Translational Medicine: Feedback loops, predictive technologies<br />
Personalized Medicine: Responders/non‐responders, biomarkers<br />
<strong>IT</strong> & <strong>Informatics</strong>: LIMS, High Performance Computing, storage, data visualization, imaging technologies<br />
Knowledge Management: Data mining, idea/expertise mining, text mining, collaboration, resource<br />
optimization<br />
Health‐<strong>IT</strong>: ePrescribing, RHIOs, EMR/PHR<br />
Manufacturing & Bioprocessing: Mass production, continuous manufacturing<br />
(Bio‐<strong>IT</strong> World reserves the right to re‐categorize submissions based on submission or in the event that a category<br />
is refined.)<br />
5. Description of project (4 FIGURES MAXIMUM):<br />
A. ABSTRACT/SUMMARY of the project and results (150 words max.)<br />
Uppsala Multidisciplinary Center for Advanced Computational Science (UPPMAX) is Uppsala<br />
University's resource of high‐performance computing.<br />
In recent years, Swedish researchers have become overwhelmed with data from next‐generation<br />
sequencing machines. UPPMAX’s challenge was to provide the researchers with a centralized<br />
compute and storage facility, capable of handling multiple terabytes of new bioinformatics data per<br />
week.<br />
In 2008 the Knut and Alice Wallenberg Foundation granted research funding for a national <strong>IT</strong> facility<br />
dedicated to the compute and storage of genomic data. UPPMAX therefore had a new project,<br />
‘UPPmax NEXt generation sequence Cluster & Storage’ (UPPNEX).<br />
Today, a centralized resource for the compute and storage of next‐generation sequencing data is in<br />
place, resulting in faster conclusion for scientific research. Since the introduction of UPPNEX,<br />
project times have decreased by several months!<br />
Groundbreaking research, using UPPNEX resources, has already developed improvements in<br />
agriculture processes and the understanding of human growth and obesity.<br />
B. INTRODUCTION/background/objectives<br />
The UPPMAX facility was founded in 2003 at Uppsala University. UPPMAX is part of the Swedish<br />
National Infrastructure for Computing (SNIC). Since its establishment, UPPMAX has provided<br />
researchers (both locally and nationally) with access to a number of high‐performance computing<br />
(<strong>HPC</strong>) systems.
Published Resources for the Life Sciences<br />
250 First Avenue, Suite 300, Needham, MA 02494 | phone: 781‐972‐5400 | fax: 781‐972‐5425<br />
UPPMAX’s users traditionally come from research areas such as physics, chemistry, and computer<br />
science. Lately, however, the number of Life Sciences users has increased dramatically. This is<br />
mainly due to the technical advances, affordability and increased deployment of next‐generation<br />
sequencing (NGS) machines.<br />
In 2008 it had become apparent, to Swedish researchers, that the tsunami of data from NGS<br />
systems created a problem that individual research grants could not solve. In many cases, Life<br />
Sciences research teams were trying to manage the problem themselves. However, due to the<br />
sheer volume of data, they wasted a lot of time copying data between systems, waiting for others<br />
to complete their computing before they could start their own ‐ and often writing custom code to<br />
manage jobs that would typically max‐out system resources. In short, the teams often spent as<br />
much time solving computing challenges as they did on scientific research!<br />
It was for these reasons that, in 2008, a national consortium of life sciences researchers was formed<br />
to address the challenges presented by this massive increase in bioinformatics data. These<br />
researchers would normally compete for resources and research funding. However, it had become<br />
apparent that a centralized facility was required. The computation and data storage requirements<br />
of NGS data created a workload that, at peak processing times and for long‐term data archiving, had<br />
to be handled by a larger facility.<br />
The consortium therefore submitted an application to SNIC and the Knut and Alice Wallenberg<br />
Foundation to fund a centralized life sciences compute and storage facility to be hosted at UPPMAX.<br />
The united conviction of the consortium being that a sufficient compute and storage facility would<br />
ultimately strengthen their attempts to combat disease.<br />
The application was successful with the Knut and Alice Wallenberg Foundation noting that the<br />
consortium’s collaborative effort was a major advantage.<br />
And so, the “UPPmax NEXt generation sequence Cluster & Storage (UPPNEX)” project was formed.<br />
Today, a 150 node (1200 core) compute cluster from HP with Infiniband as interconnect is in<br />
production with half‐a‐petabyte (500TBs) of Panasas parallel storage. The solution passed a onemonth<br />
acceptance period, at the first time of asking, and entered production in October 2009.<br />
The objectives of the UPPNEX solution were to provide Life Sciences Researchers throughout<br />
Sweden with:<br />
1. Sufficient high‐performance computing resources to cover their regular and peak project<br />
requirements
Published Resources for the Life Sciences<br />
250 First Avenue, Suite 300, Needham, MA 02494 | phone: 781‐972‐5400 | fax: 781‐972‐5425<br />
The key challenge was to provide a compute system with enough performance and resources to<br />
handle the massively parallel software algorithms required to process the genomic data.<br />
Furthermore, to provide a sufficient high‐performance storage solution that could handle the<br />
large number of clients with concurrent I/O requests.<br />
2. Longer‐term data storage facilities to provide a centralized, national data repository<br />
With multiple terabytes of new data being received by UPPNEX on a weekly basis, the storage<br />
solution had to scale capacity, without incremental complexity and management costs. To<br />
protect the data, the storage solution had to be highly‐available (with failover and redundancy<br />
features built in). Additionally, the storage had to be compatible with UPPMAX’s existing backup<br />
infrastructure.<br />
C. RESULTS (highlight major R&D/<strong>IT</strong> tools deployed; innovative uses of technology).<br />
In order to address the challenges of the massive ingest of bioinformatics data, UPPNEX leverages a<br />
parallel storage solution from Panasas. Panasas was born out of a 1990’s US DOE research project<br />
into Petascale computing and the file‐system technologies required to process and manage massive<br />
amounts of data.<br />
Since Panasas was formed in 1999, the company has developed its modular storage hardware<br />
platform in unison with its parallel file‐system, PanFS. With strong initial success in traditional <strong>HPC</strong><br />
markets, Panasas has complemented its performance with enterprise class features and easy<br />
management. The past few years have seen Panasas at an inflection point, where the company’s<br />
solutions have been gaining swift traction in data‐intensive workflows such as seismic processing,<br />
computational fluid dynamics and life sciences (in particular around next‐generation sequencing<br />
and medical imaging).<br />
UPPNEX chose Panasas parallel storage because it provided the performance required by their <strong>HPC</strong><br />
system when processing massively parallel life sciences applications, additionally Panasas provided<br />
a lower‐cost (yet highly reliable) storage pool for the longer‐term storage requirement. The unique<br />
aspect of the Panasas solution is that both of these storage pools sit under the same management<br />
layer. It is therefore easy to manage both storage pools, which results in the administration<br />
overhead of UPPNEX being significantly reduced, if compared to a traditional NFS‐based solution.<br />
It is anticipated that the long‐term storage pool for UPPNEX will grow by 250 Terabytes in <strong>2010</strong>.<br />
However, unlike alternative NAS solutions, the management complexity of the Panasas solution will<br />
not grow as the storage capacity grows. The Panasas solution scales to tens of Petabytes in a single<br />
management layer and additional capacity is added with zero loss in productivity.<br />
D. ROI achieved or expected (200 words max.):
Published Resources for the Life Sciences<br />
250 First Avenue, Suite 300, Needham, MA 02494 | phone: 781‐972‐5400 | fax: 781‐972‐5425<br />
Technology ROI:<br />
Individual research groups no longer have to over‐spec <strong>IT</strong> solutions to meet peak requirements. By<br />
moving towards centralized solutions, there are substantial gains thanks to the coordination of<br />
staff, computer halls, etc.<br />
Research ROI:<br />
An example research project, that leveraged UPPNEX, has reduced its time‐to‐completion by several<br />
months . The project focused on gaining a deeper understanding of the relationship between<br />
genetic variation and phenotypic variation. Through whole genome resequencing, the researchers<br />
distinguished key genes causing the differences between wild and domestic chickens. They have<br />
identified candidate mutations that cause special effects on the phenotype. This is an efficient<br />
strategy to increase our understanding of how different genes control different traits.<br />
One gene, associated with the fast growth of broiler chickens, is associated with obesity in humans.<br />
The study established a new animal model that can be used to explore the mechanics of how this<br />
gene influences human growth and obesity.<br />
Lastly, the domestic chicken is the most important global source of animal protein. The research has<br />
established the possibility to develop domestic chickens that are extremely efficient producers of<br />
animal proteins, namely eggs and meat.<br />
E. CONCLUSIONS/implications for the field.<br />
The recent technological advancements, affordability and wide deployment of NGS machines is<br />
feeding a tsunami of digital data. The information technology infrastructure required to compute<br />
and store such vast amounts of data is beyond the funding of Individual research groups.<br />
Centralized <strong>HPC</strong> and data‐storage facilities are being deployed at regional, national and global level<br />
to provide researchers with access to the <strong>IT</strong> infrastructure they require.<br />
The challenge for the centralized facilities is to provide sufficient compute and data‐storage<br />
resources to fuel multiple research projects simultaneously. With ever‐increasing amounts of<br />
digital data being ingested, how do they process, manage and store the data both reliably and<br />
efficiently.<br />
Traditional storage technologies cannot keep pace. Their limitations on capacity encourage data<br />
silos, multiple copies of data, system administration headaches and an escalating management<br />
overhead. Clustered storage technologies struggle to address diverse performance requirements<br />
within the life sciences workflow, again encouraging data silos and disparate storage management<br />
layers.
Published Resources for the Life Sciences<br />
250 First Avenue, Suite 300, Needham, MA 02494 | phone: 781‐972‐5400 | fax: 781‐972‐5425<br />
Panasas parallel storage caters for the diverse performance, reliability and cost requirements across<br />
the life sciences workflow. Scaling to tens of petabytes under a single management layer, Panasas<br />
users can scale storage with zero loss in productivity.<br />
The industry is at an inflection point that goes beyond the capabilities of traditional storage<br />
technologies. Centralized facilities such as UPPNEX are blazing a trail and deploying innovative<br />
technologies to enhance national scientific discovery that ultimately benefits the global community.<br />
1. REFERENCES/testimonials/supporting internal documents (If necessary; 5 pages max.)<br />
Can we add here a link to the paper on the chicken?<br />
The journal Nature is very strict on that links to manuscripts should not be spread prior to release. On the other hand, the<br />
paper is very soon out, so please ask the PI of the project if it is possible: Professor Leif Andersson<br />
leif.andersson@imbim.uu.se.<br />
Can we add a link to anything about the research consortium or the grant approval?<br />
UPPMAX:<br />
www.uppmax.uu.se<br />
UPPNEX:<br />
www.uppnex.uu.se (very soon available)<br />
Uppsala University’s press-release of the grant approval:<br />
http://www.uu.se/news/news_item.php?id=534&typ=pm<br />
SNIC announcement of the grant (in Swedish):<br />
http://www.snic.vr.se/news-events/news/kaw-och-snic-30-miljoner-kronor-till-storskaliga
1. User Organization (Organization at which the solution was deployed/applied)<br />
A. User Organization<br />
Organization name: Translational Genomics Research Institute<br />
Address: 445 N 5 th Street Phoenix AZ 85004<br />
B. User Organization Contact Person<br />
Name: James Lowey<br />
Title: Director HPBC<br />
Tel: 480‐343‐8455<br />
Email: jlowey@tgen.org<br />
3. Project<br />
Project Title: NextGen Data Processing Pipeline<br />
Team Leader James Lowey<br />
Name: James Lowey<br />
Title: Director HPBC<br />
Tel: 602‐343‐8455<br />
Email: jlowey@tgen.org<br />
Team members – name(s), title(s) and company (optional): Carl Westphal – <strong>IT</strong> Director, Dr.<br />
Waibhav Tembe – Sr Scientific Programmer, Dr. David Craig ‐Associate Director of the<br />
Neurogenomics Division, Dr. Ed Suh ‐ CIO<br />
4. Category in which entry is being submitted (1 category per entry, highlight your choice)<br />
Basic Research & Biological Research: Disease pathway research, applied and basic research<br />
Drug Discovery & Development: Compound‐focused research, drug safety<br />
Clinical Trials & Research: Trial design, eCTD<br />
Translational Medicine: Feedback loops, predictive technologies<br />
Personalized Medicine: Responders/non‐responders, biomarkers<br />
x <strong>IT</strong> & <strong>Informatics</strong>: LIMS, High Performance Computing, storage, data visualization, imaging<br />
technologies
Knowledge Management: Data mining, idea/expertise mining, text mining, collaboration,<br />
resource optimization<br />
Health‐<strong>IT</strong>: ePrescribing, RHIOs, EMR/PHR<br />
Manufacturing & Bioprocessing: Mass production, continuous manufacturing<br />
Abstract Evolving NextGen sequencing requires high throughput scalable Bio-<strong>IT</strong> infrastructure.<br />
Organizations committed to using this technology must remain nimble and design workflows and <strong>IT</strong><br />
infrastructures that are capable of adapting to the dramatic increase in demands driven by changes in<br />
NextGen sequencing technology. TGen as an early adopter of multiple NextGen sequencing platforms<br />
has experienced the evolution first hand and has implemented infrastructure and best-practices that have<br />
enabled our scientists to effectively leverage this technology. This paper will provide an overview of the<br />
challenges presented by NextGen sequencing, the associated impact in terms of informatics workflow<br />
and <strong>IT</strong> infrastructure, and will discuss what TGen has done to address this challenge.<br />
[Introduction]<br />
Beginning of the data deluge in 2009<br />
In late 2008, NextGen sequencing at TGen was just beginning. One Illumina SOLEXA and a single<br />
ABI/Lifetech SOLiD sequencer were the initial NextGen platforms brought into TGen. At that point, just<br />
one whole-genome alignment with SOLiD had been successfully completed using ABI/LifeTech’s corona<br />
software pipeline on TGen’s large parallel cluster supercomputer and the SOLEXA Genome Analyzer<br />
pipeline was running on a smaller internal cluster. A team of bioinformaticians were still going through the<br />
steep learning curve involved in getting familiarized with the technology, file types, analytical challenges,<br />
and data mining opportunities. In January 2009, TGen investigators began work on a SOLiD NextGen<br />
sequencing processing and analysis project. This project needed to demonstrate before March 2009 the<br />
capability to align 4x SOLiD pilot data from about 110 samples against the whole-genome and carrying<br />
out the required annotation and disseminating the results to collaborating centers. The sheer volume and<br />
computational resource requirements for processing this data within 90 days presented a formidable<br />
challenge. Turning this challenge into an opportunity, the TGen <strong>IT</strong> team working in conjunction with<br />
bioinformaticians, designed and implemented a customized version of corona pipeline configured to<br />
maximally utilize the available computational horsepower of the TGen’s High Performance Computing<br />
(<strong>HPC</strong>) Cluster computer [1]. The NextGen data processing pipeline depicted in Figure 1 distributed the<br />
computational task of data alignment over multiple cores, while analyzing and annotating both single<br />
fragment and mate pair analysis using several custom scripts. This set-up proved to be sufficient to<br />
successfully carry-out this project. However, it was quickly realized that a radically different <strong>IT</strong><br />
infrastructure was required to meet the computing and infrastructure challenges to make NextGen data<br />
analysis a standardized service to the scientists.
Figure 1 Data processing Pipeline (March 2009)<br />
Challenges Faced<br />
TGen’s NextGen sequencing demand is growing at an unparalleled pace, requiring large scale storage<br />
infrastructure, high performance computing and high throughput network connectivity. This demand<br />
places considerable strain upon conventional analysis tools and scientific data processing infrastructure.<br />
The volume of data being generated for NextGen sequencing is based upon the specific technology,<br />
instrument version, sample preparation, experimental design, and sequencing chemistry. Each<br />
experimental run typically generates between 25 to 250 GB of data consisting of sequenced bases and<br />
quality scores. Each such dataset must be moved from the sequencer to longer term storage, and also be<br />
made available to computational resources for alignment and other tasks, such as variant detection and<br />
annotation. Results need to be written back to long-term storage and optionally be made available to<br />
external collaborators over the Internet.<br />
Some of the specific challenges TGen had to overcome in the early days of NextGen sequencing at TGen<br />
are as follows:<br />
1. Fair allocation of resources: The analysis of one sample from the NextGen sequencers takes 3-4<br />
days on the <strong>HPC</strong> cluster. The ability of TGen to process and analyze 110 samples in 90 days,
equires running multiple-jobs using hundreds of processing cores. However, the <strong>HPC</strong> cluster<br />
was a shared system being used by hundreds of users so it was necessary to ensure that jobs<br />
were properly prioritized in order to meet the requirements of the project.<br />
2. System optimization: Multiple instances of the software being used in the sequence data analysis<br />
pipeline pushed the limits of the I/O capabilities of the underlying Lustre [2] file system on the<br />
<strong>HPC</strong> cluster. Manual intervention from the system administrators was required to build custom job<br />
processing queues to allow the system to reallocate its resources in order for the <strong>HPC</strong> cluster to<br />
continue functioning optimally.<br />
3. Evolving tools: The software tools for converting the output sequence files into the deliverable<br />
format were evolving. It was necessary to maintain sequence data in a variety of different formats<br />
to test and validate the software tools used for converting the output sequence files. This required<br />
TGen to keep intermediate data files resulting in a considerable demand for storage resources.<br />
4. Data deluge and transfer: The amount of data being generated from the sequencers and postprocessing<br />
led to the challenge of managing tens of terabytes of data. The volume of<br />
computational processing pushed the limits of the existing 80 TB Lustre file system on the <strong>HPC</strong><br />
cluster. In addition, transferring Terabytes of data for data processing and sharing over a 1Gb link<br />
was a bottleneck in the sequence data processing pipeline.<br />
5. User Education and support: The bioinformatics team dedicated to the analysis was relatively<br />
new to SOLiD data processing and using the full functionality of the available <strong>HPC</strong> cluster<br />
resources. Therefore, end-user education and providing 24x7 help on data analysis tasks was<br />
necessary.<br />
These factors hindered the implementation of a fully automated data processing pipeline and manual<br />
supervision of every single analysis was necessary. Next-generation sequencing was being increasingly<br />
adopted by TGen investigators and more sequencing projects were in the pipeline for 2009. This required<br />
TGen to build and provide scalable sequence data processing infrastructure within the given financial and<br />
time constraints.<br />
In response to these challenges <strong>IT</strong> worked closely with the scientific community and designed a new<br />
internal workflow and deployed an advanced <strong>IT</strong> infrastructure for NextGen sequencing data processing.<br />
The new software and hardware infrastructure accelerates data processing and analysis, and enables<br />
scientists to better leverage the NextGen sequencing platform. The following section provides the<br />
lessons learned from the challenges we faced.<br />
Lessons Learned:<br />
The challenges above provided the opportunity to learn many valuable lessons in how to construct and<br />
provide a NextGen sequencing data processing pipeline. The following is a summary of the key lessons<br />
we learned to date.<br />
The Impact of I/O: We quickly learned that it is possible for a 4000 CPU core cluster to be rendered<br />
nearly useless by less than 1/3 of the nodes saturating the file system with I/O operations. Many small I/O<br />
requests can quickly overwhelm the cache on disk controllers which causes a large queue of requests to<br />
accumulate, having a negative impact on performance. The Lustre-based file system remains intact,<br />
however the delay of doing an I/O on the shared file system increases and essentially all operations on
the cluster grind to a halt. The key is to actively manage and schedule computational jobs in such a way<br />
as to prevent select jobs from overwhelming the system and impacting other jobs.<br />
WAN Transport & System Tuning: TGen’s initial sequence data processing pipeline included<br />
transferring the raw sequenced data via a 100Mb WAN Ethernet link from the sequencer to the <strong>HPC</strong><br />
cluster environment that is located at our off-site data center. Despite upgrading the 100Mb WAN<br />
Ethernet link to 1Gb, the data transfer time of NFS over TCP at a 12 mile distance was still slow. This was<br />
due to the effect of latency and TCP checksums. Basically, the round trip time for packets meant that<br />
every checksum that was verified took upwards of 4.5 ms to complete, resulting in a fairly substantial<br />
delay between each frame. In order to mitigate this, we fine tuned Linux Kernel network parameters, such<br />
as TCP_Window_Size. We used open source tools such as iperf [3] to test the effects of kernel tuning<br />
which showed dramatic increases in throughput. However, the performance of data transfer over NFS<br />
was still unsatisfactory. Due to the variety and number of hosts that required connections across the<br />
Ethernet link, performing individual kernel tuning on each host was impractical. The solution to the data<br />
transfer issues was doing the NFS mounts over UDP. This introduced the new issue of silent data<br />
corruption because UDP does not perform checksums. This meant that MD5 checksums must be<br />
generated for data files being transferred to ensure data integrity. The key lesson learned was that careful<br />
attention should be paid to performance tuning measures. There is a lot of benefit to be gained by taking<br />
the time to understand and optimize system parameters. Doing so may reduce costs associated with<br />
unnecessary bandwidth upgrades that may not deliver the expected performance improvement.<br />
LAN Data Transport Capacity: Moving data off of the sequencers to storage and computational<br />
resources became a very time consuming task. Having multiple sequencers producing and transporting<br />
data simultaneously quickly overwhelmed 1Gb LAN segments. Fortunately TGen had previously invested<br />
in 10Gb core network components enabling us to extend 10Gb networking to key systems and resources<br />
in data processing pipeline thus eliminating bottlenecks on the LAN. As a result we learned or validated<br />
the importance of fully exploiting the capabilities of the infrastructure available and the importance of<br />
having a flexible network architecture.<br />
Internet Data Transport & Collaboration: As TGen began to exchange sequenced data with external<br />
collaborators, it became immediately apparent that traditional file transfer methods such as FTP would<br />
not be practical as the data sets were simply too large and the transfer times were not acceptable. This<br />
problem could not be addressed by simply increasing bandwidth as TGen has no control over the<br />
bandwidth available at collaboration sites. Internet latency issues became magnified when attempting to<br />
transfer large data sets. This project required TGen to receive sequenced data from other organizations,<br />
perform analysis, and make the results available to the other organizations. After researching various<br />
approaches and exchanging ideas with others at the Networld Interop conference, TGen chose to<br />
implement the Aspera FASP file transfer product. Aspera enabled scientists to send and receive data at<br />
an acceptable rate, and enhanced TGen’s ability to participate in collaborative research projects involving<br />
NextGen sequencing. Lesson, actively seek out best practices and leverage the experiences of others in<br />
your industry. Participating in user groups and other industry related forums can reduce the time it takes<br />
to identify and implement significant improvements to your infrastructure or workflow.<br />
Data Management: The sheer volume of NextGen sequencing data had an immediate and significant<br />
impact on our file management and backup infrastructure and methods. Scientists were initially hesitant<br />
to delete even raw image data until they were comfortable with the process of regenerating the<br />
information. This resulted in scientists keeping multiple versions of large data which quickly consumed<br />
backup and storage capacity. TGen’s <strong>IT</strong> department worked collaboratively with the scientific community<br />
to optimize data management methods. This involved achieving consensus on what is “essential data”,<br />
defining standard naming conventions, and establishing mutually agreed upon rules regarding the
location and retention of key data. Specifically, <strong>IT</strong> took the following steps to improve the data<br />
management process and accelerate the scientific workflow:<br />
• Dedicated NFS storage for raw reads, attached to back-up tape library<br />
• Dedicated NFS storage for all results, attached to back-up tape library<br />
• Automated backup process for “key” files<br />
• User education on how to mount/unmount the storage space<br />
• Configured Aspera server to read directly from designated NFS mount points eliminating<br />
unnecessary data moves<br />
• Weekly cron jobs for monitoring and informing users about storage resource capacity<br />
• Automated monitoring of user jobs utilizing the <strong>HPC</strong> Cluster<br />
• Established a SharePoint based web portal to share NextGen project related information<br />
These changes had to be synchronized and communicated across multiple scientific divisions as well as<br />
the within the <strong>IT</strong> department. The end result was a more streamlined scientific workflow, improved data<br />
management environment and reduced impact on the storage, backup and network infrastructure.<br />
Lesson, be flexible in regards to data management procedures and the supporting infrastructure. Rapidly<br />
advancing technologies such as NextGen sequencing can render your current methods obsolete and you<br />
must be willing to make dramatic changes in response to the needs of the scientific community and the<br />
demands of the technology.<br />
Benchmarking:<br />
Alignment of billions of reads to reference genomes is computationally expensive. An effort was initiated<br />
to benchmark sequence alignment tools. TGen’s <strong>IT</strong> team was actively involved in this process by<br />
providing several performance measurement and tuning tools and creating automated scripts for<br />
collecting data about computing resource utilization associated with six popular sequence alignment<br />
programs. <strong>IT</strong> used performance measurement tools for cluster computing environments to benchmark<br />
the speed, CPU utilization and input-output bandwidth needed for the program. This information is now<br />
being used for selecting the best tool for various projects and planning the resource requirements for<br />
future NextGen sequencing projects. Lesson, time spent benchmarking can provide significant benefit in<br />
terms of reducing the cost and effort associated with the “trial & error” approach to selecting and using<br />
complex technology such sequencing alignment tools.<br />
[Results]<br />
Key Technologies & Supporting Methodologies<br />
The TGen High Performance Bio-Computing Center (HPBC) manages a diverse collection of <strong>HPC</strong><br />
systems, storage and networking resources, including two large supercomputers. The first supercomputer<br />
is called Saguaro2, and is a Dell Linux cluster. This system consists of ~4000 Intel x86-64 processor<br />
cores, with 2 GB RAM per core. This system has a shared parallel 250 TB (Lustre) file system that allows<br />
massive amounts of concurrent input/output operations spread across many compute nodes. This system<br />
is very effective at running thousands of concurrent discrete processing jobs, or at running very large<br />
parallel processing workloads. This large <strong>HPC</strong> cluster system is installed at the Arizona State University<br />
campus in the Fulton High Performance Computing Initiative (<strong>HPC</strong>I) center and was funded via NIH grant<br />
S10 RR25056-01.
Figure 2 Saguaro2 supercomputer<br />
In addition to the Saguaro2 cluster system, TGen also has a large memory Symmetric Multi-Processor<br />
(SMP) system available. This system, is an SGI Altix 4700 consisting of 48 Intel IA-64 cores and 576 GB<br />
of globally shared memory. The SGI system is well suited for solving memory intensive problems, or<br />
algorithms that are not easily parallelized. With the resources available on this system, it can run several<br />
concurrent memory intensive jobs, without having a performance penalty inflicted due to the architecture<br />
of both the processors and the I/O backplanes on this system. This system was funded via NIH Grant<br />
S10 RR023390-01.<br />
Updated NextGen sequencing workflow:<br />
Learning from the experience and systematically identifying the resource requirements at various stages<br />
of the NextGen data analysis and transfer, TGen developed and installed a significantly improved<br />
NextGen sequencing data processing pipeline (Figures 3 & 4). The updated data processing pipeline<br />
utilizes several customized scripts tailored to the software implementation underlying various data<br />
analysis tools have been developed, which improve the effectiveness of using <strong>HPC</strong> for analyses. By<br />
indentifying the critical files at various stages, redundancy of storage has been minimized and policies<br />
have been established to delete intermediate files automatically after fixed time. Several compute<br />
systems have been dedicated to local data processing, such as annotation and parsing. Involving PIs in<br />
the infrastructure design process and educating their research staff has helped significantly in creating a<br />
team of proficient and more mindful users of the data processing pipeline.
Figure 3 Scientific data workflow (Feb. <strong>2010</strong>)<br />
Scalable storage<br />
The dedicated storage capacity for NextGen projects has increased from ~80TB to over 200TB with a<br />
new scalable Isilon storage system with a single name space file system. This system provides robust<br />
performance, redundancy and scalability. Being able to manage the very large amounts of storage<br />
required to support biomedical research using the minimal of <strong>IT</strong> support allows researchers to<br />
concentrate on their research and <strong>IT</strong> to concentrate on building better <strong>IT</strong> infrastructure in support of<br />
scientific programs. The Isilon system uses a modular architecture and symmetric clustered file system so<br />
that tasks such as adding additional storage to the storage cluster is as simple as plugging in additional<br />
storage arrays. This helps to minimize costs while providing a solution that can grow as the data storage<br />
requirements continue to increase.<br />
Backup optimization<br />
In addition to the Isilon storage system, TGen used Ocarina storage optimization appliances to compress<br />
data before backup, saving considerable overhead on the backup systems. This makes it feasible to<br />
backup more of the sequencing data.<br />
File sharing<br />
File sharing with external collaborators and other partners is accomplished using the Aspera FASP file<br />
transfer technology. This technology allows optimal use of the network bandwidth to achieve high<br />
throughput file transfer across the Internet.
[ROI Expected or Achieved]<br />
Figure 4 March <strong>2010</strong> Nextgen sequencing infrastructure pipeline<br />
Highly scalable <strong>IT</strong> infrastructure supporting high-throughput NextGen sequencing data processing and<br />
analysis<br />
1. High-speed, shared file transfer infrastructure that enables TGen scientists to participate in largescale<br />
collaborations involving NextGen sequencing-based research<br />
2. Improved data management procedures resulting in a more cost effective use of storage and<br />
other infrastructure resources<br />
3. Efficient scientific data processing workflow including computational tools that can be leveraged<br />
to expedite research<br />
4. Robust <strong>HPC</strong> infrastructure that is capable of supporting large-scale NextGen sequencing projects<br />
As a result of the above benefits, TGen is better positioned to compete in large-scale grants and<br />
contracts involving NextGen sequencing technology.<br />
[Conclusions]<br />
In spite of resource limitations, infrastructure constraints and a relatively short time to carry out the largescale<br />
sequencing data analysis, TGen has successfully aligned approximately 270 Giga-bases out of 550<br />
Giga-bases processed against the human genome.<br />
Throughout 2009, several new research groups at TGen incorporated NextGen sequencing technologies<br />
into their research, consequently the number of bioinformatics personnel carrying out NextGen data<br />
analysis is increasing. Concurrently, the number of sequencers at TGen has gone from two to seven (two<br />
SOLEXA and five SOLiD). TGen expects to add six more SOLiD sequencers in early <strong>2010</strong>. The<br />
throughput of each sequencer at TGen has more than doubled relative to early 2009 and this trend is<br />
expected to continue or even accelerate. Large volumes of data generated by external collaborators and
industrial partners are being processed at TGen. The increase in throughput and data volume<br />
necessitates scalable storage, <strong>HPC</strong>, and high-bandwidth network connectivity to store, manage and<br />
process sequencing data. These challenges will continue to provide opportunities for <strong>IT</strong> to play an<br />
increasingly important role in scientific research.<br />
[REFERENCES]<br />
[1] Saguaro supercomputer (http://www.top500.org/system/9789)<br />
[2] Lustre Parallel File system (http://www.oracle.com/us/products/servers‐storage/storage/storagesoftware/031855.htm)<br />
[3] iperf (http://sourceforge.net)