Teaching S1/S2 statistics using graphing technology
4kTJDPLVF
4kTJDPLVF

You also want an ePaper? Increase the reach of your titles
YUMPU automatically turns print PDFs into web optimized ePapers that Google loves.
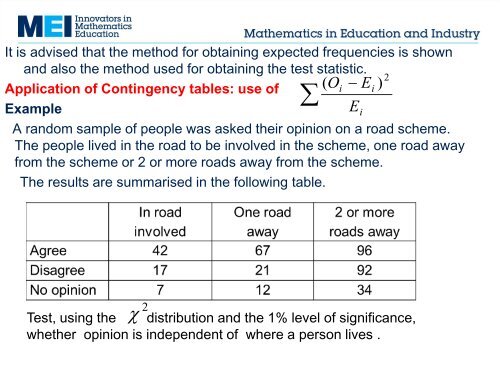
It is advised that the method for obtaining expected frequencies is shown<br />
and also the method used for obtaining the test statistic.<br />
Application of Contingency tables: use of<br />
Example<br />
A random sample of people was asked their opinion on a road scheme.<br />
The people lived in the road to be involved in the scheme, one road away<br />
from the scheme or 2 or more roads away from the scheme.<br />
<br />
The results are summarised in the following table.<br />
( O<br />
i<br />
Ei<br />
E<br />
i<br />
2<br />
)<br />
<br />
2<br />
Test, <strong>using</strong> the distribution and the 1% level of significance,<br />
whether opinion is independent of where a person lives .