

Private Equity Annual Program Review
item09a-01
item09a-01

Create successful ePaper yourself
Turn your PDF publications into a flip-book with our unique Google optimized e-Paper software.
<strong>Private</strong> <strong>Equity</strong> <strong>Annual</strong> <strong>Program</strong> <strong>Review</strong><br />
Attachment 1, Page 20 of 34<br />
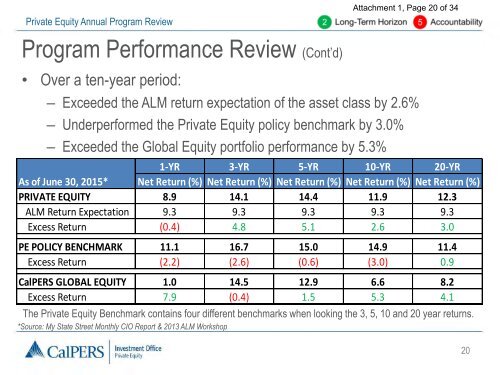
<strong>Program</strong> Performance <strong>Review</strong> (Cont’d)<br />
• Over a ten-year period:<br />
– Exceeded the ALM return expectation of the asset class by 2.6%<br />
– Underperformed the <strong>Private</strong> <strong>Equity</strong> policy benchmark by 3.0%<br />
– Exceeded the Global <strong>Equity</strong> portfolio performance by 5.3%<br />
1-YR 3-YR 5-YR 10-YR 20-YR<br />
As of June 30, 2015* Net Return (%) Net Return (%) Net Return (%) Net Return (%) Net Return (%)<br />
PRIVATE EQUITY 8.9 14.1 14.4 11.9 12.3<br />
ALM Return Expectation 9.3 9.3 9.3 9.3 9.3<br />
Excess Return (0.4) 4.8 5.1 2.6 3.0<br />
PE POLICY BENCHMARK 11.1 16.7 15.0 14.9 11.4<br />
Excess Return (2.2) (2.6) (0.6) (3.0) 0.9<br />
CalPERS GLOBAL EQUITY 1.0 14.5 12.9 6.6 8.2<br />
Excess Return 7.9 (0.4) 1.5 5.3 4.1<br />
The <strong>Private</strong> <strong>Equity</strong> Benchmark contains four different benchmarks when looking the 3, 5, 10 and 20 year returns.<br />
*Source: My State Street Monthly CIO Report & 2013 ALM Workshop<br />
20