

Trace metals accumulation in biofilms of the upper and middle reaches of Otamiri river in Owerri, Nigeria
This study utilized biofilms as model in ecotoxicology to estimate pollutant loading of a natural water body. Water samples were collected from six sampling locations sited between the upper and middle courses of the Otamiri River in the southeastern city of Owerri, Nigeria and fixed with conc. HNO3. Biofilms were grown in microcosms housing serially arranged sterile glass slides at the sampling locations, harvested after 1, 2 and 3 weeks, minced in sterile sample bottles with distilled water and fixed with conc. HNO3. Natural biofilms were also collected from submerged surfaces and fixed. Pb, Cu and Cd contents were determined in samples with atomic absorption spectrophotometer. The studentized t-test was used to compare trace metals levels in water column and biofilms, while single factor ANOVA was used to determine spatial homogeneity in mean variance. Mean Pb concentrations ranged from 1.5950-3.2900 (2.4303 ± 0.0835) mg/kg, Cu from 4.2934-7.5020 (5.6212 ± 0.1938) mg/kg and Cd from 0.0308-1.0559 (0.2082 ± 0.0005) mg/kg in the slide biofilms. However, they ranged from 0.0017-0.0267 (0.0150 ± 0.0003), 0.0333-0.6067 (0.2047 ± 0.0929) mg/L and totally undetected, respectively in water columns. Trace metals levels in slide and natural biofilms differed very markedly from those in water column (sig. t-values = 0.000, each), even as levels in slide and natural biofilms did not (sig. t-value = 0.747) at P<0.05. Pb and Cu concentrations increased from location 1 to 6 in both water columns and biofilms, even as there was homogeneity in spatial mean variances in slide [F(1.1458)<Fcrit(4.1300)] and natural biofilms concentrations [F(1.2812)<Fcrit(4.1300)] at P<0.05. Although mean Pb and Cu levels were below regulatory limits and Cd undetected in water columns, their average concentration exceedances were between 32 and 70 times higher in the biofilms. Results question the assignment of water potable based on regulatory standards alone. Get more articles: http://www.innspub.net/volume-1-number-3-june-2011-2/
This study utilized biofilms as model in ecotoxicology to estimate pollutant loading of a natural water body. Water samples were collected from six sampling locations sited between the upper and middle courses of the Otamiri River in the southeastern city of Owerri, Nigeria and fixed with conc. HNO3. Biofilms were grown in microcosms housing serially arranged sterile glass slides at the sampling locations, harvested after 1, 2 and 3 weeks, minced in sterile sample bottles with distilled water and fixed with conc. HNO3. Natural biofilms were also collected from submerged surfaces and fixed. Pb, Cu and Cd contents were determined in samples with atomic absorption spectrophotometer. The studentized t-test was used to compare trace metals levels in water column and biofilms, while single factor ANOVA was used to determine spatial homogeneity in mean variance. Mean Pb concentrations ranged from 1.5950-3.2900 (2.4303 ± 0.0835) mg/kg, Cu from 4.2934-7.5020 (5.6212 ± 0.1938) mg/kg and Cd from 0.0308-1.0559 (0.2082 ± 0.0005) mg/kg in the slide biofilms. However, they ranged from 0.0017-0.0267 (0.0150 ± 0.0003), 0.0333-0.6067 (0.2047 ± 0.0929) mg/L and totally undetected, respectively in water columns. Trace metals levels in slide and natural biofilms differed very markedly from those in water column (sig. t-values = 0.000, each), even as levels in slide and natural biofilms did not (sig. t-value = 0.747) at P<0.05. Pb and Cu concentrations increased from location 1 to 6 in both water columns and biofilms, even as there was homogeneity in spatial mean variances in slide [F(1.1458)<Fcrit(4.1300)] and natural biofilms concentrations [F(1.2812)<Fcrit(4.1300)] at P<0.05. Although mean Pb and Cu levels were below regulatory limits and Cd undetected in water columns, their average concentration exceedances were between 32 and 70 times higher in the biofilms. Results question the assignment of water potable based on regulatory standards alone. Get more articles: http://www.innspub.net/volume-1-number-3-june-2011-2/

Create successful ePaper yourself
Turn your PDF publications into a flip-book with our unique Google optimized e-Paper software.
egulatory st<strong>and</strong>ards alone could be <strong>in</strong>adequate <strong>and</strong><br />
mislead<strong>in</strong>g, as just 3 weeks exposure <strong>of</strong> <strong>the</strong> biological<br />
models revealed several folds <strong>of</strong> exceedances over<br />
<strong>the</strong>m. This applies specifically to persistent pollutants,<br />
such as <strong>the</strong> trace <strong>metals</strong> <strong>in</strong> <strong>the</strong> environment <strong>and</strong><br />
confirms that even at low or undetectable<br />
concentrations, <strong>the</strong>y can still exert negative impacts<br />
on water organisms as well as local consumers (Behra<br />
et al. 2006).<br />
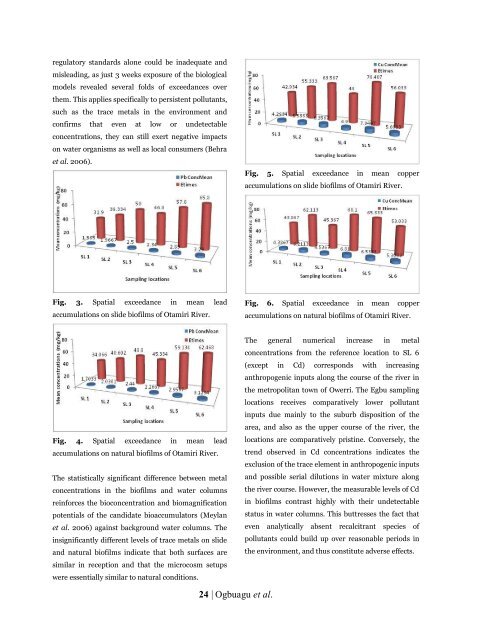
Fig. 5. Spatial exceedance <strong>in</strong> mean copper<br />
<strong>accumulation</strong>s on slide <strong>bi<strong>of</strong>ilms</strong> <strong>of</strong> <strong>Otamiri</strong> River.<br />
Fig. 3. Spatial exceedance <strong>in</strong> mean lead<br />
<strong>accumulation</strong>s on slide <strong>bi<strong>of</strong>ilms</strong> <strong>of</strong> <strong>Otamiri</strong> River.<br />
Fig. 6. Spatial exceedance <strong>in</strong> mean copper<br />
<strong>accumulation</strong>s on natural <strong>bi<strong>of</strong>ilms</strong> <strong>of</strong> <strong>Otamiri</strong> River.<br />
Fig. 4. Spatial exceedance <strong>in</strong> mean lead<br />
<strong>accumulation</strong>s on natural <strong>bi<strong>of</strong>ilms</strong> <strong>of</strong> <strong>Otamiri</strong> River.<br />
The statistically significant difference between metal<br />
concentrations <strong>in</strong> <strong>the</strong> <strong>bi<strong>of</strong>ilms</strong> <strong>and</strong> water columns<br />
re<strong>in</strong>forces <strong>the</strong> bioconcentration <strong>and</strong> biomagnification<br />
potentials <strong>of</strong> <strong>the</strong> c<strong>and</strong>idate bioaccumulators (Meylan<br />
et al. 2006) aga<strong>in</strong>st background water columns. The<br />
<strong>in</strong>significantly different levels <strong>of</strong> trace <strong>metals</strong> on slide<br />
<strong>and</strong> natural <strong>bi<strong>of</strong>ilms</strong> <strong>in</strong>dicate that both surfaces are<br />
similar <strong>in</strong> reception <strong>and</strong> that <strong>the</strong> microcosm setups<br />
were essentially similar to natural conditions.<br />
The general numerical <strong>in</strong>crease <strong>in</strong> metal<br />
concentrations from <strong>the</strong> reference location to SL 6<br />
(except <strong>in</strong> Cd) corresponds with <strong>in</strong>creas<strong>in</strong>g<br />
anthropogenic <strong>in</strong>puts along <strong>the</strong> course <strong>of</strong> <strong>the</strong> <strong>river</strong> <strong>in</strong><br />
<strong>the</strong> metropolitan town <strong>of</strong> <strong>Owerri</strong>. The Egbu sampl<strong>in</strong>g<br />
locations receives comparatively lower pollutant<br />
<strong>in</strong>puts due ma<strong>in</strong>ly to <strong>the</strong> suburb disposition <strong>of</strong> <strong>the</strong><br />
area, <strong>and</strong> also as <strong>the</strong> <strong>upper</strong> course <strong>of</strong> <strong>the</strong> <strong>river</strong>, <strong>the</strong><br />
locations are comparatively prist<strong>in</strong>e. Conversely, <strong>the</strong><br />
trend observed <strong>in</strong> Cd concentrations <strong>in</strong>dicates <strong>the</strong><br />
exclusion <strong>of</strong> <strong>the</strong> trace element <strong>in</strong> anthropogenic <strong>in</strong>puts<br />
<strong>and</strong> possible serial dilutions <strong>in</strong> water mixture along<br />
<strong>the</strong> <strong>river</strong> course. However, <strong>the</strong> measurable levels <strong>of</strong> Cd<br />
<strong>in</strong> <strong>bi<strong>of</strong>ilms</strong> contrast highly with <strong>the</strong>ir undetectable<br />
status <strong>in</strong> water columns. This buttresses <strong>the</strong> fact that<br />
even analytically absent recalcitrant species <strong>of</strong><br />
pollutants could build up over reasonable periods <strong>in</strong><br />
<strong>the</strong> environment, <strong>and</strong> thus constitute adverse effects.<br />
24 | Ogbuagu et al.


