3 Indicadores demográficos
3. Indicadores demográficos. - Comunidad Autónoma de la Región ...
3. Indicadores demográficos. - Comunidad Autónoma de la Región ...

Create successful ePaper yourself
Turn your PDF publications into a flip-book with our unique Google optimized e-Paper software.
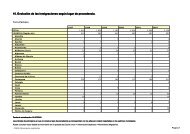
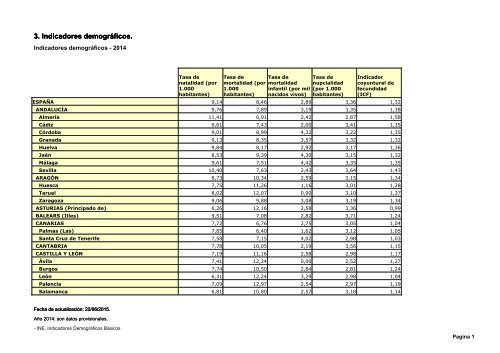
3. <strong>Indicadores</strong> <strong>demográficos</strong>.<br />
<strong>Indicadores</strong> <strong>demográficos</strong> - 2014<br />
Tasa de<br />
natalidad (por<br />
1.000<br />
habitantes)<br />
Tasa de<br />
Tasa de<br />
Tasa de<br />
mortalidad (por mortalidad nupcialidad<br />
1.000<br />
infantil (por mil (por 1.000<br />
habitantes) nacidos vivos) habitantes)<br />
Indicador<br />
coyuntural de<br />
fecundidad<br />
(ICF)<br />
ESPAÑA 9,14 8,46 2,89 3,36 1,32<br />
ANDALUCÍA 9,76 7,89 3,19 3,35 1,38<br />
Almería 11,41 6,91 2,42 2,87 1,58<br />
Cádiz 9,61 7,43 2,00 3,41 1,35<br />
Córdoba 9,01 8,99 4,32 3,22 1,35<br />
Granada 9,13 8,35 3,57 3,32 1,32<br />
Huelva 9,84 8,17 2,92 3,17 1,36<br />
Jaén 8,53 9,39 4,30 3,15 1,32<br />
Málaga 9,61 7,51 4,42 3,35 1,35<br />
Sevilla 10,40 7,63 2,43 3,64 1,43<br />
ARAGÓN 8,73 10,34 2,59 3,15 1,34<br />
Huesca 7,75 11,26 1,16 3,01 1,28<br />
Teruel 8,02 12,07 0,90 3,10 1,37<br />
Zaragoza 9,06 9,88 3,08 3,19 1,34<br />
ASTURIAS (Principado de) 6,26 12,16 2,58 3,36 0,99<br />
BALEARS (Illes) 9,51 7,08 2,82 3,71 1,24<br />
CANARIAS 7,72 6,76 2,75 3,05 1,04<br />
Palmas (Las) 7,85 6,40 1,62 3,12 1,05<br />
Santa Cruz de Tenerife 7,58 7,15 4,02 2,98 1,03<br />
CANTABRIA 7,78 10,05 2,19 3,56 1,15<br />
CASTILLA Y LEÓN 7,19 11,16 2,58 2,98 1,17<br />
Ávila 7,41 12,24 0,00 2,52 1,27<br />
Burgos 7,74 10,50 2,84 2,81 1,24<br />
León 6,31 12,24 3,29 2,98 1,04<br />
Palencia 7,09 12,97 2,54 2,97 1,19<br />
Salamanca 6,81 10,80 2,57 3,18 1,14<br />
Fecha de actualización: 22/06/2015.<br />
Año 2014: son datos provisionales.<br />
- INE. <strong>Indicadores</strong> Demográficos Básicos<br />
Pagina 1
3. <strong>Indicadores</strong> <strong>demográficos</strong>.<br />
<strong>Indicadores</strong> <strong>demográficos</strong> - 2014<br />
Tasa de<br />
natalidad (por<br />
1.000<br />
habitantes)<br />
Tasa de<br />
Tasa de<br />
Tasa de<br />
mortalidad (por mortalidad nupcialidad<br />
1.000<br />
infantil (por mil (por 1.000<br />
habitantes) nacidos vivos) habitantes)<br />
Indicador<br />
coyuntural de<br />
fecundidad<br />
(ICF)<br />
Segovia 8,06 10,83 0,00 2,88 1,34<br />
Soria 6,98 12,38 1,56 2,72 1,20<br />
Valladolid 8,16 8,76 3,25 3,44 1,22<br />
Zamora 5,55 14,21 3,89 2,32 1,01<br />
CASTILLA-LA MANCHA 8,82 8,87 1,97 3,23 1,29<br />
Albacete 9,02 9,41 3,08 3,29 1,34<br />
Ciudad Real 8,23 9,77 2,36 3,03 1,23<br />
Cuenca 7,40 11,00 1,30 2,72 1,21<br />
Guadalajara 9,55 7,16 2,06 3,55 1,28<br />
Toledo 9,31 7,90 1,24 3,39 1,32<br />
CATALUÑA 9,67 8,25 2,81 3,60 1,39<br />
Barcelona 9,64 8,18 2,67 3,62 1,37<br />
Girona 9,98 8,11 3,38 3,87 1,49<br />
Lleida 9,63 9,59 2,65 3,30 1,48<br />
Tarragona 9,61 8,14 3,28 3,38 1,41<br />
COMUNITAT VALENCIANA 8,89 8,38 3,00 3,45 1,30<br />
Alicante/Alacant 8,52 8,00 3,17 3,13 1,27<br />
Castellón/Castelló 9,30 8,75 2,43 3,34 1,35<br />
Valencia/València 9,08 8,57 3,01 3,71 1,31<br />
EXTREMADURA 8,36 9,83 2,52 3,03 1,29<br />
Badajoz 8,96 9,54 2,60 3,16 1,33<br />
Cáceres 7,35 10,32 2,34 2,80 1,21<br />
GALICIA 7,16 10,92 2,04 3,21 1,07<br />
Coruña (A) 7,28 10,65 2,07 3,55 1,06<br />
Lugo 6,32 14,36 2,79 2,88 1,04<br />
Ourense 5,79 13,74 2,16 2,66 0,99<br />
Fecha de actualización: 22/06/2015.<br />
Año 2014: son datos provisionales.<br />
- INE. <strong>Indicadores</strong> Demográficos Básicos<br />
Pagina 2
3. <strong>Indicadores</strong> <strong>demográficos</strong>.<br />
<strong>Indicadores</strong> <strong>demográficos</strong> - 2014<br />
Tasa de<br />
natalidad (por<br />
1.000<br />
habitantes)<br />
Tasa de<br />
Tasa de<br />
Tasa de<br />
mortalidad (por mortalidad nupcialidad<br />
1.000<br />
infantil (por mil (por 1.000<br />
habitantes) nacidos vivos) habitantes)<br />
Indicador<br />
coyuntural de<br />
fecundidad<br />
(ICF)<br />
Pontevedra 7,79 9,07 1,76 3,11 1,11<br />
MADRID (Comunidad de) 10,23 6,75 3,46 3,30 1,34<br />
MURCIA (Región de) 11,12 7,05 2,64 3,34 1,56<br />
NAVARRA (Comunidad Foral de) 9,71 8,63 2,75 3,65 1,44<br />
PAÍS VASCO 8,95 9,31 2,27 3,44 1,38<br />
Araba/Álava 10,26 7,72 1,83 3,82 1,51<br />
Bizkaia 8,55 9,81 2,16 3,22 1,32<br />
Gipuzkoa 8,99 9,23 2,68 3,63 1,42<br />
RIOJA (La) 9,01 9,17 2,47 3,54 1,35<br />
CEUTA (Ciudad Autónoma de) 14,20 5,91 5,00 4,56 2,00<br />
MELILLA (Ciudad Autónoma de) 19,33 5,82 8,62 3,81 2,70<br />
Fecha de actualización: 22/06/2015.<br />
Año 2014: son datos provisionales.<br />
- INE. <strong>Indicadores</strong> Demográficos Básicos<br />
Pagina 3