

Financial Confidence
LearnVest-Financial-Confidence-Curve
LearnVest-Financial-Confidence-Curve

Create successful ePaper yourself
Turn your PDF publications into a flip-book with our unique Google optimized e-Paper software.
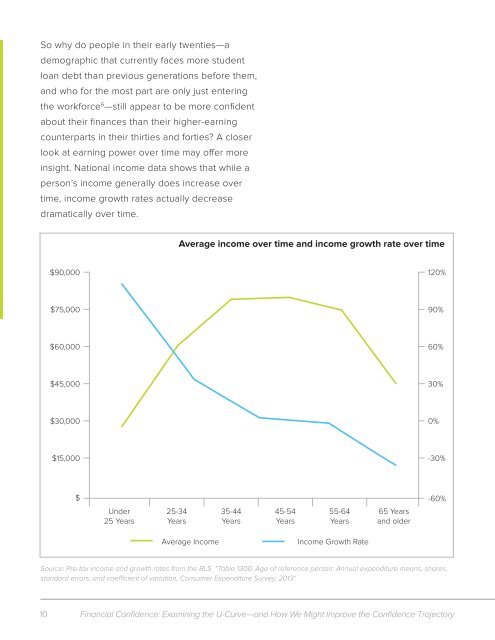
So why do people in their early twenties—a<br />
demographic that currently faces more student<br />
loan debt than previous generations before them,<br />
and who for the most part are only just entering<br />
the workforce 6 —still appear to be more confident<br />
about their finances than their higher-earning<br />
counterparts in their thirties and forties? A closer<br />
look at earning power over time may offer more<br />
insight. National income data shows that while a<br />
person’s income generally does increase over<br />
time, income growth rates actually decrease<br />
dramatically over time.<br />
Average income over time and income growth rate over time<br />
$90,000 120%<br />
$75,000 90%<br />
$60,000 60%<br />
$45,000 30%<br />
$30,000 0%<br />
$15,000 -30%<br />
$<br />
Under<br />
25 Years<br />
25-34<br />
Years<br />
35-44<br />
Years<br />
45-54<br />
Years<br />
55-64<br />
Years<br />
65 Years<br />
and older<br />
-60%<br />
Average Income<br />
Income Growth Rate<br />
Source: Pre-tax income and growth rates from the BLS “Table 1300. Age of reference person: Annual expenditure means, shares,<br />
standard errors, and coefficient of variation, Consumer Expenditure Survey, 2013”<br />
10 <strong>Financial</strong> <strong>Confidence</strong>: Examining the U-Curve—and How We Might Improve the <strong>Confidence</strong> Trajectory