

Financial Confidence
LearnVest-Financial-Confidence-Curve
LearnVest-Financial-Confidence-Curve

You also want an ePaper? Increase the reach of your titles
YUMPU automatically turns print PDFs into web optimized ePapers that Google loves.
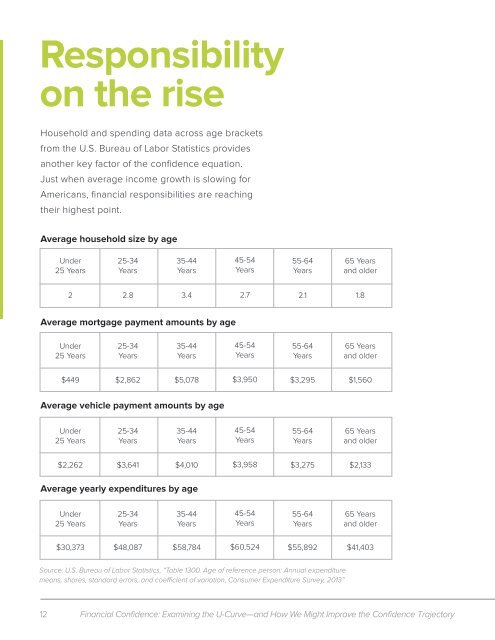
Responsibility<br />
on the rise<br />
Household and spending data across age brackets<br />
from the U.S. Bureau of Labor Statistics provides<br />
another key factor of the confidence equation.<br />
Just when average income growth is slowing for<br />
Americans, financial responsibilities are reaching<br />
their highest point.<br />
Average household size by age<br />
Under<br />
25 Years<br />
25-34<br />
Years<br />
35-44<br />
Years<br />
45-54<br />
Years<br />
55-64<br />
Years<br />
65 Years<br />
and older<br />
2 2.8 3.4 2.7 2.1 1.8<br />
Average mortgage payment amounts by age<br />
Under<br />
25 Years<br />
25-34<br />
Years<br />
35-44<br />
Years<br />
45-54<br />
Years<br />
55-64<br />
Years<br />
65 Years<br />
and older<br />
$449 $2,862 $5,078 $3,950 $3,295 $1,560<br />
Average vehicle payment amounts by age<br />
Under<br />
25 Years<br />
25-34<br />
Years<br />
35-44<br />
Years<br />
45-54<br />
Years<br />
55-64<br />
Years<br />
65 Years<br />
and older<br />
$2,262 $3,641 $4,010 $3,958 $3,275 $2,133<br />
Average yearly expenditures by age<br />
Under<br />
25 Years<br />
25-34<br />
Years<br />
35-44<br />
Years<br />
45-54<br />
Years<br />
55-64<br />
Years<br />
65 Years<br />
and older<br />
$30,373 $48,087 $58,784 $60,524 $55,892 $41,403<br />
Source: U.S. Bureau of Labor Statistics, “Table 1300. Age of reference person: Annual expenditure<br />
means, shares, standard errors, and coefficient of variation, Consumer Expenditure Survey, 2013”<br />
12 <strong>Financial</strong> <strong>Confidence</strong>: Examining the U-Curve—and How We Might Improve the <strong>Confidence</strong> Trajectory