

Assessment of the vegetation cover of northern high mountains in Jordan - JBES
The vegetation cover of the northern mountains of Jordan was investigated and surveyed. Line transects sampling method as well as walking through methods have been applied in this study. A total area of 15x80 km was studied and divided into grid system, and thus the selected grids have been used for the line transect sampling. The study showed that the natural forest of Aleppo pine, evergreen oak forest, deciduous oak forest, degraded forest and manmade Aleppo pine forest areas are suffering from man interference and continuous encroachment for the uses of agriculture, urbanization, grazing, fire and querying. The available plant species under forest were collected and herbarium specimens are prepared and deposited. Analysis parameters such as density (D), relative density (RD), frequency (F), relative frequency (RF), abundance (A), relative abundance (RA) and the importance value (IV) are studied. The values of the parameters are recorded for all species, but since the number of collected species is more than 500, then these parameters are listed for the highest 20 species to show clear image about the most dominant and the most abundant and other parameters. From the quantitative ecological analysis using various parameters, the species recoded as having the highest values such as Quercus coccifera, Sarcopoterium spinosum, Asphodelus aestivus, Eryngium creticum, Ononis natrix and others confirm that the study area falls within a Mediterranean biogeographic zone in Jordan. Based on the obtained results, it is highly recommended thus to exert maximum efforts to conserve such limited forest cover, since Jordan, is classified as a country with dry to semidry ecosystem. In addition some of the rare and endemic recorded species occur only under forest cover, particularly the orchid species. This articles originally published at: http://www.innspub.net/volume-6-number-5-may-2015-jbes/
The vegetation cover of the northern mountains of Jordan was investigated and surveyed. Line transects sampling method as well as walking through methods have been applied in this study. A total area of 15x80 km was studied and divided into grid system, and thus the selected grids have been used for the line transect sampling. The study showed that the natural forest of Aleppo pine, evergreen oak forest, deciduous oak forest, degraded forest and manmade Aleppo pine forest areas are suffering from man interference and continuous encroachment for the uses of agriculture, urbanization, grazing, fire and querying. The available plant species under forest were collected and herbarium specimens are prepared and deposited. Analysis parameters such as density (D), relative density (RD), frequency (F), relative frequency (RF), abundance (A), relative abundance (RA) and the importance value (IV) are studied. The values of the parameters are recorded for all species, but since the number of collected species is more than 500, then these parameters are listed for the highest 20 species to show clear image about the most dominant and the most abundant and other parameters. From the quantitative ecological analysis using various parameters, the species recoded as having the highest values such as Quercus coccifera, Sarcopoterium spinosum, Asphodelus aestivus, Eryngium creticum, Ononis natrix and others confirm that the study area falls within a Mediterranean biogeographic zone in Jordan. Based on the obtained results, it is highly recommended thus to exert maximum efforts to conserve such limited forest cover, since Jordan, is classified as a country with dry to semidry ecosystem. In addition some of the rare and endemic recorded species occur only under forest cover, particularly the orchid species. This articles originally published at: http://www.innspub.net/volume-6-number-5-may-2015-jbes/

You also want an ePaper? Increase the reach of your titles
YUMPU automatically turns print PDFs into web optimized ePapers that Google loves.
J. Bio. & Env. Sci. 2015<br />
Relative Density = Total number <strong>of</strong> each species <strong>in</strong><br />
all transect/ Total number <strong>of</strong> <strong>in</strong>dividuals <strong>of</strong> all<br />
species <strong>in</strong> all transects studied X 100.<br />
Table 3. Show<strong>in</strong>g <strong>the</strong> <strong>high</strong>est density <strong>of</strong> <strong>the</strong> top 20<br />
species among all species recorded <strong>in</strong> <strong>the</strong> study area.<br />
No.<br />
Sp.<br />
Density<br />
Species Name<br />
No.<br />
value<br />
1. 169 Quercus coccifera 27.2<br />
2. 189 Sarcopoterium sp<strong>in</strong>osum 21.4<br />
3. 39 Asphodelus aestivus 21.2<br />
4. 91 Eryngium creticum 11.1<br />
5. 82 Ech<strong>in</strong>ops polyceras 10.5<br />
6. 119 Lagoecia cum<strong>in</strong>oides 9.56<br />
7. 212 Urg<strong>in</strong>ea maritima 9.02<br />
8. 137 Ononis natrix 9.07<br />
9. 21 Anagallis arvensis 8.15<br />
10. 66 Cistus creticus 7.34<br />
11. 62 Centaurea iberica 7.3<br />
12. 65 Cichorium pumilum 6.41<br />
13. 153 Pimp<strong>in</strong>ella cretica 6.41<br />
14. 170 Ranunculus asiaticus 6.22<br />
15. 75 Cyclamen persicum 5.97<br />
16. 27 Anemone coronaria 5.92<br />
17. 194 Senecio vernalis 5.94<br />
18. 157 P<strong>in</strong>us halepensis 5.44<br />
19. 163 Plantago ovata 4.91<br />
20. 29 An<strong>the</strong>mis palaest<strong>in</strong>a 5.18<br />
Importance <strong>of</strong> Index Value (IV)<br />
In any community structure, <strong>the</strong> quantitative value <strong>of</strong><br />
each parameter <strong>of</strong> frequency, density, abundance, and<br />
<strong>cover</strong> has its important value. However, <strong>the</strong> total<br />
picture <strong>of</strong> ecological importance cannot be obta<strong>in</strong>ed<br />
by any one <strong>of</strong> <strong>the</strong>m separately.<br />
For example, frequency gives <strong>the</strong> dispersion <strong>of</strong> any<br />
species <strong>in</strong> <strong>the</strong> study area. Density on <strong>the</strong> o<strong>the</strong>r hand<br />
gives <strong>the</strong> numerical strength <strong>of</strong> a species <strong>in</strong> <strong>the</strong> study<br />
area. Dom<strong>in</strong>ance is reflected by <strong>the</strong> <strong>cover</strong> only.<br />
Therefore, <strong>in</strong> order to get an overall picture <strong>of</strong> <strong>the</strong><br />
ecological importance <strong>of</strong> a species with respect to<br />
community structure, <strong>the</strong> percentage value <strong>of</strong> relative<br />
frequency, relative dom<strong>in</strong>ance, and relative density<br />
should be calculated.<br />
Table (4) show <strong>the</strong> Importance Value Index (IV) <strong>of</strong><br />
each species based on calculation <strong>of</strong> <strong>the</strong> relative<br />
frequency, abundance and density <strong>of</strong> <strong>the</strong> all species <strong>in</strong><br />
<strong>the</strong> studies area.<br />
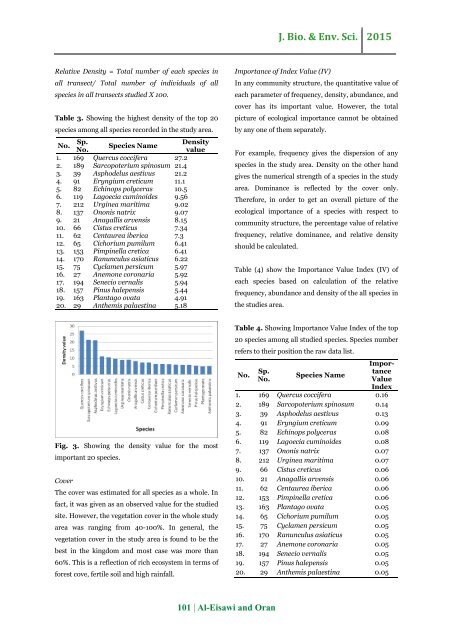
Fig. 3. Show<strong>in</strong>g <strong>the</strong> density value for <strong>the</strong> most<br />
important 20 species.<br />
Cover<br />
The <strong>cover</strong> was estimated for all species as a whole. In<br />
fact, it was given as an observed value for <strong>the</strong> studied<br />
site. However, <strong>the</strong> <strong>vegetation</strong> <strong>cover</strong> <strong>in</strong> <strong>the</strong> whole study<br />
area was rang<strong>in</strong>g from 40-100%. In general, <strong>the</strong><br />
<strong>vegetation</strong> <strong>cover</strong> <strong>in</strong> <strong>the</strong> study area is found to be <strong>the</strong><br />
best <strong>in</strong> <strong>the</strong> k<strong>in</strong>gdom and most case was more than<br />
60%. This is a reflection <strong>of</strong> rich ecosystem <strong>in</strong> terms <strong>of</strong><br />
forest cove, fertile soil and <strong>high</strong> ra<strong>in</strong>fall.<br />
Table 4. Show<strong>in</strong>g Importance Value Index <strong>of</strong> <strong>the</strong> top<br />
20 species among all studied species. Species number<br />
refers to <strong>the</strong>ir position <strong>the</strong> raw data list.<br />
No.<br />
Sp.<br />
No.<br />
Species Name<br />
Importance<br />
Value<br />
Index<br />
1. 169 Quercus coccifera 0.16<br />
2. 189 Sarcopoterium sp<strong>in</strong>osum 0.14<br />
3. 39 Asphodelus aestivus 0.13<br />
4. 91 Eryngium creticum 0.09<br />
5. 82 Ech<strong>in</strong>ops polyceras 0.08<br />
6. 119 Lagoecia cum<strong>in</strong>oides 0.08<br />
7. 137 Ononis natrix 0.07<br />
8. 212 Urg<strong>in</strong>ea maritima 0.07<br />
9. 66 Cistus creticus 0.06<br />
10. 21 Anagallis arvensis 0.06<br />
11. 62 Centaurea iberica 0.06<br />
12. 153 Pimp<strong>in</strong>ella cretica 0.06<br />
13. 163 Plantago ovata 0.05<br />
14. 65 Cichorium pumilum 0.05<br />
15. 75 Cyclamen persicum 0.05<br />
16. 170 Ranunculus asiaticus 0.05<br />
17. 27 Anemone coronaria 0.05<br />
18. 194 Senecio vernalis 0.05<br />
19. 157 P<strong>in</strong>us halepensis 0.05<br />
20. 29 An<strong>the</strong>mis palaest<strong>in</strong>a 0.05<br />
101 | Al-Eisawi and Oran


