Del total <strong>de</strong> la población <strong>de</strong> 40 a 59 años, 73,1 por ciento está casado(a) o vive en concubinato y 6,0 por ciento se encuentra separado o divorciado. Del total <strong>de</strong> adultos mayores <strong>de</strong> 60 años o más, 57,6 por ciento es casado o conviviente; 5,0 por ciento, divorciado y 23,9 por ciento, en estado <strong>de</strong> viu<strong>de</strong>z. El estado civil <strong>de</strong> la población <strong>de</strong>sagregada por sexo muestra leves diferencias: <strong>de</strong> las personas casadas, 35,5 por ciento es mujer y 35,6 por ciento, hombre; en la categoría <strong>de</strong> conviviente o concubinato, 17,1 por ciento correspon<strong>de</strong> a mujeres y 16,4 por ciento, a hombres. En cuanto a las personas separadas, 2,2 por ciento es mujer y 1,3 por ciento, hombre; las divorciadas llegan a 1,5 por ciento y los divorciados, a 1,1 por ciento; en estado <strong>de</strong> viu<strong>de</strong>z, 6,1 por ciento es mujer y 2,6 por ciento, hombre. Cuadro N° 14 BOLIVIA: POBLACIÓN DE 15 AÑOS O MÁS DE EDAD, POR SEXO Y GRUPOS DE EDAD, SEGÚN ÁREA Y ESTADO CIVIL, CENSO 2012 (En número y porcentaje) ESTADO CIVIL TOTAL HOMBRES MUJERES GRUPOS DE EDAD (1) 15 - 17 18 - 28 29- 39 40 - 59 60 o más BOLIVIA 6.899.090 3.408.664 3.490.426 671.611 2.087.361 1.528.176 1.733.930 878.012 Soltera(o) 40,0 42,7 37,4 95,2 63,0 26,4 16,6 13,4 Casada(o) 35,5 35,6 35,5 0,9 13,2 44,0 59,6 52,8 Conviviente o concubina(o) 16,8 16,4 17,1 3,6 22,6 25,4 13,3 4,7 Separada(o) 1,8 1,3 2,2 0,1 0,7 2,0 3,3 2,2 Divorciada(o) 1,3 1,1 1,5 0,0 0,1 1,0 2,7 2,8 Viuda(o) 4,4 2,6 6,1 0,1 0,2 0,8 4,3 23,9 Sin especificar 0,2 0,2 0,2 0,0 0,2 0,3 0,3 0,3 Urbana 4.719.901 2.264.312 2.455.589 451.672 1.517.974 1.099.913 1.141.327 509.015 Soltera(o) 42,4 45,1 39,9 95,9 65,5 27,4 17,4 14,4 Casada(o) 33,5 33,6 33,4 0,7 12,5 43,6 57,3 49,8 Conviviente o concubina(o) 16,4 16,3 16,6 3,1 20,8 24,4 13,5 4,6 Separada(o) 2,0 1,4 2,6 0,1 0,7 2,3 4,0 2,9 Divorciada(o) 1,7 1,3 2,0 0,0 0,2 1,3 3,6 4,1 Viuda(o) 3,7 2,0 5,3 0,0 0,2 0,7 3,9 23,9 Sin especificar 0,2 0,3 0,2 0,0 0,2 0,3 0,3 0,2 Rural 2.179.189 1.144.352 1.034.837 219.939 569.387 428.263 592.603 368.997 Soltera(o) 34,9 38,1 31,4 93,6 56,2 23,7 15,0 11,9 Casada(o) 40,0 39,6 40,4 1,4 15,0 45,2 64,0 56,8 Conviviente o concubina(o) 17,5 16,8 18,2 4,7 27,5 28,0 12,8 4,8 Separada(o) 1,1 1,0 1,3 0,1 0,6 1,3 1,9 1,3 Divorciada(o) 0,5 0,5 0,5 0,0 0,1 0,4 0,9 0,9 Viuda(o) 5,7 3,8 7,9 0,1 0,4 1,1 5,0 23,9 Sin especificar 0,2 0,2 0,3 0,1 0,2 0,3 0,3 0,3 Fuente: <strong>Instituto</strong> <strong>Nacional</strong> <strong>de</strong> <strong>Estadística</strong> (1) Los grupos <strong>de</strong> edad fueron <strong>de</strong>finidos con base en el Código 548 <strong>de</strong>l Niño, Niña, Adolescente, Artículo 5º Ley Nº 342, Ley <strong>de</strong> Juventud. Ley Nº 369, Artículo 2º <strong>de</strong> la Ley General <strong>de</strong> las Personas Adultas Mayores. 28 Características <strong>de</strong> la Población <strong>–</strong> Censo 2012
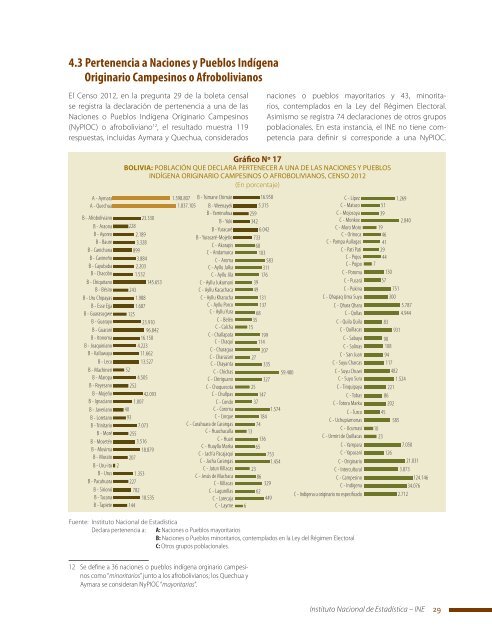
4.3 Pertenencia a Naciones y Pueblos Indígena Originario Campesinos o Afrobolivianos El Censo 2012, en la pregunta 29 <strong>de</strong> la boleta censal se registra la <strong>de</strong>claración <strong>de</strong> pertenencia a una <strong>de</strong> las Naciones o Pueblos Indígena Originario Campesinos (NyPIOC) o afroboliviano 12 , el resultado muestra 119 respuestas, incluidas Aymara y Quechua, consi<strong>de</strong>rados naciones o pueblos mayoritarios y 43, minoritarios, contemplados en la Ley <strong>de</strong>l Régimen Electoral. Asimismo se registra 74 <strong>de</strong>claraciones <strong>de</strong> otros grupos poblacionales. En esta instancia, el <strong>INE</strong> no tiene competencia para <strong>de</strong>finir si correspon<strong>de</strong> a una NyPIOC. A - Aymara A - Quechua B - Afroboliviano B - Araona B - Ayoreo B - Baure B - Canichana B - Cavineño B - Cayubaba B - Chacobo B - Chiquitano B - Bésiro B - Uru Chipayas B - Esse Ejja B - Guarasugwe B - Guarayo B - Guaraní B - Itonoma B - Joaquiniano B - Kallawaya B - Leco B - Machineri B - Maropa B - Reyesano B - Mojeño B - Ignaciano B - Javeriano B - Loretano B - Trinitario B - Moré B - Mosetén B - Movima B - Murato B - Uru-ito B - Urus B - Pacahuara B - Sirionó B - Tacana B - Tapiete 2 Gráfico Nº 17 BOLIVIA: POBLACIÓN QUE DECLARA PERTENECER A UNA DE LAS NACIONES Y PUEBLOS INDÍGENA ORIGINARIO CAMPESINOS O AFROBOLIVIANOS, CENSO 2012 (En porcentaje) 23.330 228 2.189 3.328 899 3.884 2.203 1.532 145.653 243 1.988 1.687 125 23.910 96.842 16.158 4.223 11.662 13.527 52 4.505 252 42.093 1.007 40 93 7.073 255 3.516 18.879 207 1.353 227 782 18.535 144 1.598.807 B - Tsimane Chimán 1.837.105 B - Weenayek B - Yaminahua B - Yuki B - Yuracaré B - Yuracaré-Mojeño C - Akarapis C - Andamarca C - Aroma C - Ayllu Jalka C - Ayllu Jila C - Ayllu Jukumani C - Ayllu Kacachaca C - Ayllu Kharacha C - Ayllu Porco C - Ayllu Yura C - Belén C - Calcha C - Challapata C - Chaqui C - Charagua C - Charazani C - Chayanta C - Chichas C - Chiriguano C - Choquecota C - Chullpas C - Condo C - Coroma C - Corque C - Curahuara <strong>de</strong> Carangas C - Huachacalla C - Huari C - Huaylla Marka C - Jach’a Pacajaqui C - Jacha Carangas C - Jatun Killacas C - Jesús <strong>de</strong> Machaca C - Killacas C - Lagunillas C - Larecaja C - Layme 6 16.958 5.315 259 342 6.042 733 68 103 583 311 176 39 49 131 137 68 35 15 327 25 147 37 1.574 184 74 13 27 136 65 753 1.454 23 86 199 114 207 335 329 62 449 59.480 C - Lípez 1.269 C - Mataco C - Mojocoya 51 39 C - Monkox 2.840 C - Moro Moro C - Orinoca C - Pampa Aullagas C - Pati Pati C - Pojpo C - Poroma C - Pucará C - Pukina C - Qhapaq Uma Suyu C - Qhara Qhara C - Qollas C - Quila Quila C - Quillacas C - Sabaya C - Salinas C - San Juan C - Suyu Charcas C - Suyu Chuwi C - Suyu Sura C - Tinquipaya C - Tobas C - Totora Marka C - Turco C - Uchupiamonas C - Ucumasi C - Urmiri <strong>de</strong> Quillacas C - Yampara C - Yapacaní C - Originario C - Intercultural C - Campesino C - Indígena C - Indígena u originario no especificado 19 46 41 29 C - Pojos 44 7 130 57 751 300 5.787 4.944 83 931 90 108 94 117 482 1.524 221 86 202 45 585 10 23 7.050 126 21.031 3.873 124.146 34.076 2.712 Fuente: <strong>Instituto</strong> <strong>Nacional</strong> <strong>de</strong> <strong>Estadística</strong> Declara pertenencia a: A: Naciones o Pueblos mayoritarios B: Naciones o Pueblos minoritarios, contemplados en la Ley <strong>de</strong>l Régimen Electoral C: Otros grupos poblacionales. 12 Se <strong>de</strong>fine a 36 naciones o pueblos indígena orginario campesinos como “minoritarios” junto a los afrobolivianos; los Quechua y Aymara se consi<strong>de</strong>ran NyPIOC “mayoritarias”. <strong>Instituto</strong> <strong>Nacional</strong> <strong>de</strong> <strong>Estadística</strong> <strong>–</strong> <strong>INE</strong> 29
- Page 1: Instituto Nacional de Estadística
- Page 4 and 5: ©INE, febrero de 2015 Instituto Na
- Page 6 and 7: 7. SALUD...........................
- Page 9: CARACTERÍSTICAS GENERALES DEL CENS
- Page 12 and 13: MAPA DEL ESTADO PLURINACIONAL DE BO
- Page 14 and 15: La población empadronada en los di
- Page 16 and 17: Gráfico N° 2 BOLIVIA: PARTICIPACI
- Page 18 and 19: En 1950, todos los departamentos tu
- Page 20 and 21: Gráfico N° 6 BOLIVIA: TASA MEDIA
- Page 22 and 23: Gráfico Nº 8 DENSIDAD POBLACIONAL
- Page 24 and 25: El “bono demográfico” 10 se pr
- Page 26 and 27: Las pirámides de población entre
- Page 28 and 29: 98,2 92,5 98,7 94,3 Gráfico N° 12
- Page 32 and 33: Gráfico Nº 18 BOLIVIA: POBLACIÓN
- Page 34 and 35: IDIOMA QUE APRENDIÓ A HABLAR Cuadr
- Page 36 and 37: Gráfico Nº 20 BOLIVIA: POBLACIÓN
- Page 38 and 39: Cuadro Nº 17 BOLIVIA: POBLACIÓN D
- Page 40 and 41: Gráfico N° 23 BOLIVIA: TASA DE AL
- Page 42 and 43: En el Censo 2012, en el grupo de 6
- Page 44 and 45: 5.3 Nivel de instrucción más alto
- Page 46 and 47: Cuadro N° 20 BOLIVIA: NIVEL DE INS
- Page 48 and 49: Entre los censos 2001 y 2012, la Po
- Page 50 and 51: 6.3 Condición de actividad por ár
- Page 52 and 53: La Paz presenta la TGP más alta, 6
- Page 54 and 55: CENSO, ÁREA Y DEPARTAMENTO Cuadro
- Page 56 and 57: Cuadro N° 28 BOLIVIA: POBLACIÓN O
- Page 58 and 59: Cuadro N° 29 BOLIVIA: POBLACIÓN D
- Page 60 and 61: 7.2 Acceso a centros y establecimie
- Page 62 and 63: Cuadro N° 32 BOLIVIA: PERSONAS CON
- Page 64 and 65: Cuadro N° 34 BOLIVIA: VIVIENDAS PA
- Page 66 and 67: Pando presenta un aumento considera
- Page 68 and 69: Gráfico N° 46 BOLIVIA: POBLACIÓN
- Page 70 and 71: Gráfico Nº 49 BOLIVIA: INMIGRANTE
- Page 72 and 73: 8.3 Emigración internacional El Ce
- Page 74 and 75: Gráfico N° 51 BOLIVIA: EMIGRANTES
- Page 76 and 77: Gráfico N° 53 BOLIVIA: EMIGRANTES
- Page 78 and 79: Fuente: Instituto Nacional de Estad
- Page 80 and 81:
Este indicador se mueve inversament
- Page 83:
ANEXOS Instituto Nacional de Estad
- Page 86 and 87:
4.3 Pertenencia a Naciones y Pueblo
- Page 88 and 89:
Cuadro N° 35 .....................
- Page 90 and 91:
Gráfico Nº 1 BOLIVIA: ESTRUCTURA
- Page 92 and 93:
3. Estructura de la población 3.1
- Page 94 and 95:
3.3 Estructura de la población por
- Page 96 and 97:
Cuadro N° 5 b BOLIVIA: POBLACIÓN
- Page 98 and 99:
4. Características relacionadas a
- Page 100 and 101:
Cuadro N° 7 b BOLIVIA: POBLACIÓN
- Page 102 and 103:
Cuadro N° 9 a BOLIVIA: POBLACIÓN
- Page 104 and 105:
Cuadro N° 10 a BOLIVIA: POBLACIÓN
- Page 106 and 107:
Cuadro N° 11 (Continuación) BOLIV
- Page 108 and 109:
Cuadro Nº 12 BOLIVIA: POBLACIÓN P
- Page 110 and 111:
Cuadro N° 12 (Continuación) BOLIV
- Page 112 and 113:
Cuadro N° 13 (Continuación) BOLIV
- Page 114 and 115:
Cuadro N° 14 (Continuación) BOLIV
- Page 116 and 117:
Cuadro N° 15 (Continuación) BOLIV
- Page 118 and 119:
Cuadro N° 16 (Continuación) BOLIV
- Page 120 and 121:
Cuadro N° 17 (Continuación) BOLIV
- Page 122 and 123:
Cuadro Nº 18 BOLIVIA: POBLACIÓN D
- Page 124 and 125:
Cuadro N° 18 (Continuación) BOLIV
- Page 126 and 127:
Cuadro N° 20 BOLIVIA: TASA DE ALFA
- Page 128 and 129:
5.3 Máximo nivel de instrucción a
- Page 130 and 131:
Cuadro N° 22 (Continuación) BOLIV
- Page 132 and 133:
Cuadro N° 22 (Continuación) BOLIV
- Page 134 and 135:
6. Empleo 6.1 Condición de activid
- Page 136 and 137:
CENSO, ÁREA Y DEPARTAMENTO Cuadro
- Page 138 and 139:
7. SALUD 7. 1 Atención materna CEN
- Page 140 and 141:
Cuadro N° 27 BOLIVIA: POBLACIÓN D
- Page 142 and 143:
7.2 Asistencia a centros y servicio
- Page 144 and 145:
Cuadro N° 29 (Continuación) BOLIV
- Page 146 and 147:
Cuadro N° 30 BOLIVIA: LUGAR DONDE
- Page 148 and 149:
Cuadro N° 30 (Continuación) BOLIV
- Page 150 and 151:
7.3 Personas con alguna dificultad
- Page 152 and 153:
Gráfico N° 5 BOLIVIA: PERSONAS CO
- Page 154 and 155:
Cuadro N° 35 BOLIVIA: POBLACIÓN M
- Page 156 and 157:
8.2 Inmigración internacional Cuad
- Page 158 and 159:
Cuadro N° 39 BOLIVIA: POBLACIÓN I
- Page 160 and 161:
PAÍS DE NACIMIENTO Cuadro N° 40 B
- Page 162 and 163:
8.3 Emigración internacional DEPAR
- Page 164 and 165:
GRUPOS DE EDAD Cuadro N° 44 BOLIVI
- Page 166 and 167:
Cuadro N° 45 (Continuación) BOLIV
- Page 168 and 169:
Cuadro N° 47 BOLIVIA: POBLACIÓN E
- Page 170 and 171:
Cuadro N° 48 BOLIVIA: POBLACIÓN E
- Page 173 and 174:
ESTADO PLURINACIONAL DE BOLIVIA CEN
- Page 175 and 176:
CAPÍTULO D. MORTALIDAD 21. De ener
- Page 177 and 178:
36. Actualmente, ¿asiste a una esc
- Page 179:
Indicadores Instituto Nacional de E
- Page 182 and 183:
(Continuación) BOLIVIA: INDICADORE
- Page 184 and 185:
(Continuación) BOLIVIA: INDICADORE
- Page 186 and 187:
(Continuación) BOLIVIA: INDICADORE
- Page 188 and 189:
(Continuación) BOLIVIA: INDICADORE
- Page 190 and 191:
(Continuación) BOLIVIA: INDICADORE
- Page 192 and 193:
BOLIVIA: INDICADORES DE SALUD, EDUC
- Page 194 and 195:
(Continuación) BOLIVIA: INDICADORE
- Page 196 and 197:
(Continuación) BOLIVIA: INDICADORE
- Page 198 and 199:
(Continuación) BOLIVIA: INDICADORE
- Page 200 and 201:
(Continuación) BOLIVIA: INDICADORE
- Page 202:
(Continuación) BOLIVIA: INDICADORE