

Instituto Nacional de Estadística – INE 1
1RNRIXC
1RNRIXC

You also want an ePaper? Increase the reach of your titles
YUMPU automatically turns print PDFs into web optimized ePapers that Google loves.
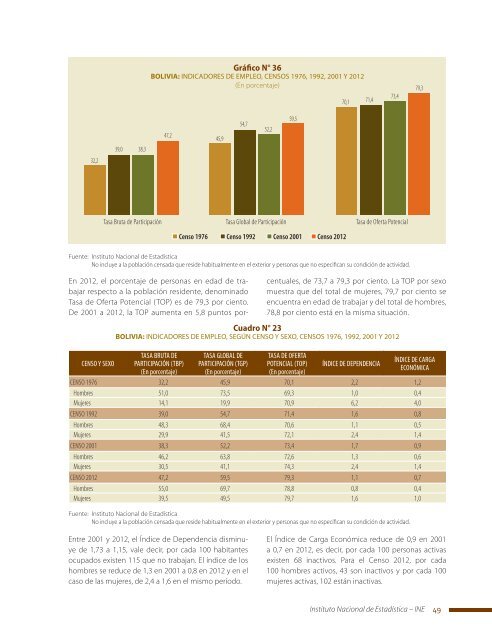
Gráfico N° 36<br />
BOLIVIA: INDICADORES DE EMPLEO, CENSOS 1976, 1992, 2001 Y 2012<br />
(En porcentaje)<br />
70,1 71,4<br />
73,4<br />
79,3<br />
39,0 38,3<br />
47,2<br />
45,9<br />
54,7<br />
52,2<br />
59,5<br />
32,2<br />
Tasa Bruta <strong>de</strong> Participación Tasa Global <strong>de</strong> Participación Tasa <strong>de</strong> Oferta Potencial<br />
Censo 1976 Censo 1992 Censo 2001 Censo 2012<br />
Fuente: <strong>Instituto</strong> <strong>Nacional</strong> <strong>de</strong> <strong>Estadística</strong><br />
No incluye a la población censada que resi<strong>de</strong> habitualmente en el exterior y personas que no especifican su condición <strong>de</strong> actividad.<br />
CENSO Y SEXO<br />
Cuadro N° 23<br />
BOLIVIA: INDICADORES DE EMPLEO, SEGÚN CENSO Y SEXO, CENSOS 1976, 1992, 2001 Y 2012<br />
TASA BRUTA DE<br />
PARTICIPACIÓN (TBP)<br />
(En porcentaje)<br />
TASA GLOBAL DE<br />
PARTICIPACIÓN (TGP)<br />
(En porcentaje)<br />
En 2012, el porcentaje <strong>de</strong> personas en edad <strong>de</strong> trabajar<br />
respecto a la población resi<strong>de</strong>nte, <strong>de</strong>nominado<br />
Tasa <strong>de</strong> Oferta Potencial (TOP) es <strong>de</strong> 79,3 por ciento.<br />
De 2001 a 2012, la TOP aumenta en 5,8 puntos porcentuales,<br />
<strong>de</strong> 73,7 a 79,3 por ciento. La TOP por sexo<br />
muestra que <strong>de</strong>l total <strong>de</strong> mujeres, 79,7 por ciento se<br />
encuentra en edad <strong>de</strong> trabajar y <strong>de</strong>l total <strong>de</strong> hombres,<br />
78,8 por ciento está en la misma situación.<br />
TASA DE OFERTA<br />
POTENCIAL (TOP)<br />
(En porcentaje)<br />
ÍNDICE DE DEPENDENCIA<br />
ÍNDICE DE CARGA<br />
ECONÓMICA<br />
CENSO 1976 32,2 45,9 70,1 2,2 1,2<br />
Hombres 51,0 73,5 69,3 1,0 0,4<br />
Mujeres 14,1 19,9 70,9 6,2 4,0<br />
CENSO 1992 39,0 54,7 71,4 1,6 0,8<br />
Hombres 48,3 68,4 70,6 1,1 0,5<br />
Mujeres 29,9 41,5 72,1 2,4 1,4<br />
CENSO 2001 38,3 52,2 73,4 1,7 0,9<br />
Hombres 46,2 63,8 72,6 1,3 0,6<br />
Mujeres 30,5 41,1 74,3 2,4 1,4<br />
CENSO 2012 47,2 59,5 79,3 1,1 0,7<br />
Hombres 55,0 69,7 78,8 0,8 0,4<br />
Mujeres 39,5 49,5 79,7 1,6 1,0<br />
Fuente: <strong>Instituto</strong> <strong>Nacional</strong> <strong>de</strong> <strong>Estadística</strong><br />
No incluye a la población censada que resi<strong>de</strong> habitualmente en el exterior y personas que no especifican su condición <strong>de</strong> actividad.<br />
Entre 2001 y 2012, el Índice <strong>de</strong> Depen<strong>de</strong>ncia disminuye<br />
<strong>de</strong> 1,73 a 1,15, vale <strong>de</strong>cir, por cada 100 habitantes<br />
ocupados existen 115 que no trabajan. El índice <strong>de</strong> los<br />
hombres se reduce <strong>de</strong> 1,3 en 2001 a 0,8 en 2012 y en el<br />
caso <strong>de</strong> las mujeres, <strong>de</strong> 2,4 a 1,6 en el mismo período.<br />
El Índice <strong>de</strong> Carga Económica reduce <strong>de</strong> 0,9 en 2001<br />
a 0,7 en 2012, es <strong>de</strong>cir, por cada 100 personas activas<br />
existen 68 inactivos. Para el Censo 2012, por cada<br />
100 hombres activos, 43 son inactivos y por cada 100<br />
mujeres activas, 102 están inactivas.<br />
<strong>Instituto</strong> <strong>Nacional</strong> <strong>de</strong> <strong>Estadística</strong> <strong>–</strong> <strong>INE</strong> 49