Create successful ePaper yourself
Turn your PDF publications into a flip-book with our unique Google optimized e-Paper software.
<strong>IRG</strong>-WG RA (<str<strong>on</strong>g>07</str<strong>on</strong>g>) <strong>WACC</strong> Master Doc<br />
The usual problem with surveys is that there are no c<strong>on</strong>straints <strong>on</strong> reas<strong>on</strong>ability and <strong>on</strong> how<br />
resp<strong>on</strong>dents’ expectati<strong>on</strong>s can be influenced by recent market movements. Further, these<br />
kinds of estimates tend to be short term. The answers can also vary with the sample of<br />
investors chosen. In fact, while pensi<strong>on</strong> fund managers tend to suggest low values, pers<strong>on</strong>al<br />
financial advisors and equity analysts might not.<br />
4.3.4 Benchmarking<br />
A further alternative for estimating the risk premium is through benchmark. This can be d<strong>on</strong>e<br />
by selecting a foreign market and adjusting for differences in the ec<strong>on</strong>omies of the local and<br />
benchmark country. These differences can relate to the nature and size of the companies,<br />
differences in taxati<strong>on</strong> and differences in country risk.<br />
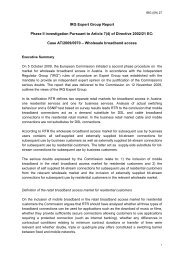
The figure below shows the level of the equity risk premium in some <strong>IRG</strong> member states.<br />
The average value is 5,3 %. As can be seen from the graph, there are significant differences<br />
am<strong>on</strong>g <strong>IRG</strong> countries. These differences can be caused by different calculati<strong>on</strong> methods, but<br />
also by country specific reas<strong>on</strong>s (maturity of stock markets, differences in country risk, etc.)<br />
8%<br />
7%<br />
6%<br />
5%<br />
4%<br />
3%<br />
2%<br />
1%<br />
0%<br />
Equity risk Premium in <strong>IRG</strong> countries (% )<br />
<strong>IRG</strong>-average also includes Portugal and Hungary<br />
Romania<br />
Greece<br />
Lithuania<br />
Netherlands<br />
Cyprus<br />
Malta<br />
Austria<br />
<strong>IRG</strong> Average<br />
Switzerland<br />
France<br />
Est<strong>on</strong>ia<br />
Belgium<br />
Poland<br />
Norway<br />
UK<br />
Sweden<br />
Spain<br />
Finland<br />
Italy<br />
Denmark<br />
Source <strong>IRG</strong> Regulatory Accounting WG data collecti<strong>on</strong> (last update January 20<str<strong>on</strong>g>07</str<strong>on</strong>g>).<br />
4.3.5 Implied premium (and the dividend growth model)<br />
There are alternative ways to estimating risk premium that do not require historical data,<br />
usually called the ex-ante approaches. A total ex-ante approach calculates the risk premium<br />
as the difference between the current observable expected returns and observable current<br />
expected yields <strong>on</strong> a proxy for a risk free asset.<br />
Other ex-ante measures of the risk premium c<strong>on</strong>sist of the analysis of certain financial<br />
indicators regarded as having the ability to predict equity returns such as interest rates, the<br />
dividend to price ratio, dividend yield or earnings yields.<br />
18