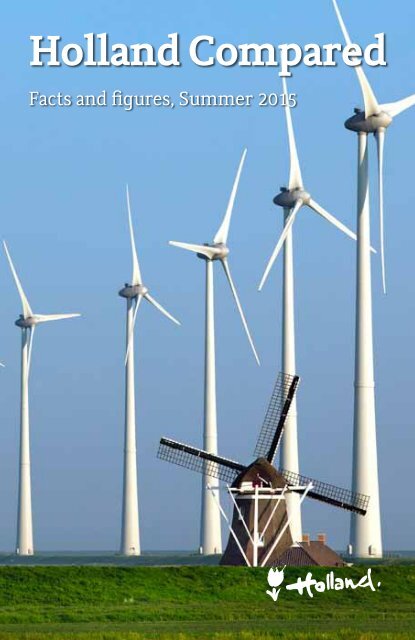
Holland Compared
hollandcompard_summer2015_LR
hollandcompard_summer2015_LR

You also want an ePaper? Increase the reach of your titles
YUMPU automatically turns print PDFs into web optimized ePapers that Google loves.
<strong>Holland</strong> <strong>Compared</strong><br />
Facts and figures, Summer 2015
Source: Rijkswaterstaat
GRONINGEN<br />
Groningen<br />
Leeuwarden<br />
FRIESLAND<br />
Assen<br />
NORTH SEA<br />
Haarlem<br />
NOORD-<br />
HOLLAND<br />
Amsterdam<br />
Lelystad<br />
FLEVOLAND<br />
Zwolle<br />
DRENTHE<br />
OVERIJSSEL<br />
's-Gravenhage (The Hague)<br />
ZUID-<br />
HOLLAND<br />
Rotterdam<br />
Utrecht<br />
UTRECHT<br />
GELDERLAND<br />
Arnhem<br />
Middelburg<br />
ZEELAND<br />
Breda<br />
's-Hertogenbosch<br />
NOORD-BRABANT<br />
Eindhoven<br />
GERMANY<br />
BELGIUM<br />
LIMBURG<br />
Maastricht<br />
UK<br />
BELGIUM<br />
GERMANY<br />
FRANCE<br />
2
Official name<br />
Form of government<br />
Head of State<br />
Capital<br />
Seat of government<br />
Administrative structure<br />
Surface area<br />
Location<br />
Number of inhabitants<br />
Number of inhabitants per km 2<br />
Monetary unit<br />
Languages<br />
Kingdom of the Netherlands<br />
Constitutional monarchy,<br />
parliamentary democracy<br />
His Majesty King Willem-Alexander, King of<br />
the Netherlands, Prince of Orange-Nassau<br />
Amsterdam<br />
The Hague<br />
Twelve provinces and the overseas<br />
territories of Aruba, Curacao and<br />
St. Martin. The overseas islands of Bonaire,<br />
Saba and St. Eustatius, all three of which<br />
are situated in the Caribbean, are ‘special<br />
municipalities of the Netherlands’<br />
33,800 km 2<br />
Western Europe, by the North Sea,<br />
bordering Belgium and Germany<br />
16,915,195 (April 2015)<br />
500 (April 2015)<br />
Euro<br />
Dutch, Frisian<br />
3
Source: Netherlands Enterprise Agency<br />
4
Content<br />
Foreword<br />
Page<br />
6<br />
1.<br />
General Information<br />
8<br />
2.<br />
Macro Indicators<br />
14<br />
3.<br />
Trade and Foreign Investment<br />
24<br />
4.<br />
<strong>Holland</strong> Digital Gateway<br />
36<br />
5.<br />
Top Sectors in Focus<br />
46<br />
6.<br />
Human Capital and Innovation<br />
66<br />
7.<br />
Infrastructure<br />
80<br />
8.<br />
Government<br />
86<br />
5
Foreword<br />
Often referred to as<br />
<strong>Holland</strong>, the Netherlands<br />
has for centuries had<br />
one of the world’s most<br />
open economies.<br />
The Dutch engage in<br />
all forms of business all<br />
around the globe.<br />
Like many others, the Dutch economy was hard hit by the global<br />
economic crisis that began in the autumn of 2008. Nevertheless it has<br />
stayed relatively buoyant. The Netherlands continues to occupy a<br />
prominent position in world trade: in 2014, the country was the world’s<br />
fifth-largest exporter of goods.<br />
According to the World Economic Forum, the Netherlands currently has<br />
the eighth-best business climate in the world. Dutch conditions for<br />
investment and for setting up a business are also ranked highly by other<br />
institutes, like the IMD World Competitiveness Center.<br />
These high rankings are due to a number of factors. The Netherlands is<br />
widely considered a pleasant place to live, and the high productivity of<br />
Dutch workers has given it one of the highest per capita incomes of any<br />
country in the European Union.<br />
6
The Netherlands has a great deal to offer the business community, and to<br />
foreign companies in particular. The country’s geographical location on<br />
the European continent is outstanding, and the Dutch have an open<br />
outlook and an international orientation. The workforce is well-educated<br />
and flexible – people often speak several languages – and the country has<br />
an excellent physical infrastructure. The Netherlands’ highly-developed IT<br />
network is another reason why it is such an attractive location for<br />
businesses: the Dutch have the second-highest number of broadband<br />
connections per head of population in the world. The Netherlands also<br />
excels in the use of IT by the general population, the business sector and<br />
government. This combination of factors may explain why the nation is the<br />
seventh-largest recipient of foreign investment in Europe. Yet despite all<br />
these factors contributing to their success, the Dutch refuse to allow<br />
themselves to become complacent. The government is constantly working<br />
to adapt and improve the Dutch business climate so as to meet the<br />
challenges of the future.<br />
This publication compares the Netherlands’ performance in these and<br />
other economic areas to that of other EU and OECD countries. If after<br />
reading this publication you still have questions about the quality of life or<br />
the business environment in the Netherlands, the team at the<br />
Netherlands Foreign Investment Agency (info@nfia.nl) will be glad to<br />
answer them.<br />
Renée Jones-Bos<br />
Secretary-General, Ministry of Foreign Affairs<br />
7
Source: Energising the Future
1. General<br />
Information<br />
The Netherlands is traditionally the land of<br />
windmills, cheese and tulips, but isn’t this<br />
image something of a cliché nowadays?<br />
Well, not really. Centuries of expertise in land<br />
drainage (using the famous windmills) have<br />
made the Netherlands world-renowned for its<br />
water management skills. So what about the<br />
cheese and the tulips? The answer is that the<br />
Netherlands is also one of the largest<br />
exporters of agri-food and horticultural<br />
products in the world.<br />
9
Brake on<br />
population growth<br />
Population by age (2014)<br />
4<br />
4<br />
5<br />
5<br />
1<br />
1<br />
3<br />
3<br />
2<br />
1. 1. 0-19 22.9% 2. 2. 20-39 24.5% 3. 40-64 23.3% 4. 65-79 13.1% 5. Older than 79 4.3%<br />
Source: Statistics Netherlands, 2014.<br />
In total 16.9 million people live on the relatively small piece of land that<br />
is the Netherlands, which makes the country one of the most densely<br />
populated in the world. However, population growth is slowing down in<br />
the Netherlands, as it is in many other Western countries. This slowdown,<br />
together with an increasingly healthy generation aged 65 and above,<br />
has resulted in an ageing population.<br />
10 General information
Attractive<br />
place to live<br />
Quality of life (2014)<br />
Switzerland 9.73<br />
Austria 9.55<br />
Norway 9.47<br />
Sweden 9.44<br />
Germany 9.38<br />
Netherlands 9.21<br />
Denmark 9.13<br />
New Zealand 9.13<br />
Australia 9.11<br />
Canada 9.04<br />
Source: IMD, 2014.<br />
Whether visiting for<br />
7business 7,5<br />
or pleasure,<br />
8,0<br />
the<br />
8,5<br />
Netherlands<br />
9,0<br />
is<br />
9,5<br />
home to<br />
10a<br />
highly pleasant living environment. It currently ranks sixth worldwide in<br />
terms of quality of life. Leisure amenities are within easy reach and Dutch<br />
cities have much to offer, such as the centuries-old architecture of<br />
Amsterdam, Delft, Groningen and Leiden as well as cultural activities and<br />
world-famous museums such as the Van Gogh Museum and the Hermitage<br />
Amsterdam. Housing is also fairly affordable compared to other countries,<br />
according to IMD. In addition to the various international schools in the<br />
Netherlands, a large and growing number of schools (119 in 2013) teach in<br />
two languages (mostly Dutch and English). Finally, the Dutch healthcare<br />
system officially ranks among the world’s best. According to the Commonwealth<br />
Fund, the Dutch healthcare system is the best in the world in terms<br />
of quality, access, efficiency, funding and the healthy lives, on average, of<br />
the general population.<br />
General information 11
One of the most<br />
competitive economies<br />
Global Competitiveness Index (2014-2015)<br />
Switzerland<br />
Singapore<br />
United States<br />
Finland<br />
Germany<br />
Japan<br />
Hong Kong, China<br />
Netherlands<br />
United Kingdom<br />
Sweden<br />
5.7<br />
5.65<br />
5.54<br />
5.5<br />
5.49<br />
5.47<br />
5.46<br />
5.45<br />
5.41<br />
5.41<br />
Source: World Economic Forum, 2014.<br />
5 5,1 5,2 5,3 5,4 5,5 5,6<br />
According to a number of international league tables published by<br />
renowned institutes such as IMD and the World Economic Forum, the<br />
Netherlands is among the world leaders when it comes to favourable<br />
business climate. There are numerous factors that form the basis for the<br />
favourable position that the Netherlands enjoys, including its open and<br />
international outlook, its strategic location in Europe, its well-educated,<br />
multilingual and flexible workforce, and the high level of labour productivity.<br />
The competitive fiscal climate, top-level physical and technological<br />
infrastructure and quality of life are key contributors to the country’s<br />
success. The Netherlands is thus an attractive location for companies<br />
seeking a European base and for those wishing to invest.<br />
12 General information
Source: DSM N.V.
Source: Hannah Anthonysz/Rotterdam Image Bank
2. Macro Indicators<br />
The impact of the downturn in world trade<br />
as a result of the global economic crisis was<br />
immediately tangible in the Netherlands with<br />
its buoyant and open economy. However, the<br />
Netherlands continues to perform well on<br />
many fronts. For example, the Netherlands<br />
has one of the highest incomes per capita in<br />
the EU, Rotterdam is still Europe’s largest<br />
port and the Netherland’s high-quality ICT<br />
infrastructure ensures that the country<br />
remains the gateway to Europe.<br />
15
Sixth-largest<br />
EU economy<br />
GDP in the EU (2014)<br />
Germany 2,903,790<br />
United Kingdom 2,217,872<br />
France 2,142,022<br />
Italy 1,616,047<br />
Spain 1,058,469<br />
Netherlands 653,476<br />
Sweden 436,342<br />
Poland 412,189<br />
Belgium 402,270<br />
Austria 328,996<br />
Millions of euros.<br />
Source: Eurostat, 2015.<br />
0 500.000 1.000.000 1.500.000 2.000.000 2.500.000 3.000.000<br />
In terms of surface area and population size, the Netherlands is not a<br />
particularly large country and ranks 133rd and 64st worldwide. In stark<br />
contrast, the country’s economic performance ranks much higher. The size<br />
of the economy, or the Gross Domestic Product (GDP), is about 615 billion<br />
euros in 2014. The Netherlands has the seventeenth-largest economy in<br />
the world and the sixth-largest in the European Union.<br />
16 Macro indicators
High average<br />
income<br />
GDP per capita (2013)<br />
Luxembourg<br />
90,457<br />
Switzerland<br />
United States*<br />
Austria<br />
Sweden<br />
Netherlands<br />
Ireland<br />
Denmark<br />
Germany<br />
54,133<br />
51,689<br />
44,176<br />
43,497<br />
43,416<br />
42,941<br />
42,777<br />
42,549<br />
EU-28 34,256<br />
*= 2012<br />
US dollars, corrected for Purchasing Power Parity.<br />
Source: OECD, 2014.<br />
0 20.000 40.000 60.000 80.000 83.802<br />
The Netherlands is one of the wealthiest nations in the European Union.<br />
The Netherlands also performs well compared to similar economies<br />
outside the European Union, such as that of the United States. The high<br />
average income in the Netherlands is the result of high productivity and a<br />
high level of labour participation.<br />
Macro indicators 17
High productivity<br />
per hour<br />
GDP per hour, corrected for purchasing power parity (2013)<br />
United States<br />
Belgium<br />
Netherlands<br />
France<br />
67<br />
61<br />
60<br />
59<br />
Germany<br />
Denmark<br />
Ireland<br />
Austria<br />
Sweden<br />
57<br />
56<br />
56<br />
55<br />
55<br />
Switzerland<br />
50<br />
US dollars.<br />
Source: The Conference Board and Groningen Growth and Development<br />
Centre, 2014.<br />
30 35 40 45 50 55 60 65 70 75<br />
The working population in the Netherlands is highly educated, employees<br />
have an international outlook, and many speak more than one foreign<br />
language. This high level of education and the strong economic structure<br />
(enabled by the physical and the knowledge infrastructure, for example)<br />
allow employees to be productive. Labour productivity per hour is among<br />
the highest in the world. It is noteworthy that the Netherlands has<br />
combined this high level of productivity with a high level of labour<br />
participation, also among semi-skilled and unskilled workers.<br />
18 Macro indicators
Prosperous, sustainable<br />
and enterprising<br />
Growth in GDP in % (2006-2013)<br />
Switzerland<br />
2.0<br />
Sweden<br />
1.8<br />
Germany<br />
Austria<br />
United States<br />
1.3<br />
1.4<br />
1.4<br />
Belgium<br />
1.0<br />
Netherlands<br />
France<br />
Finland<br />
Euro area<br />
0,7<br />
0.7<br />
0.7<br />
0.6<br />
Source: Eurostat, 2014.<br />
0 0,5 1,0<br />
1.5 2.0<br />
<strong>Compared</strong> to many other EU Member States, the Netherlands has a highly<br />
open economy, which is why the country was hit hard by the sharp<br />
downturn in world trade in 2008 and 2009. When considered over a longer<br />
period of time, the Netherlands shows reasonable economic growth<br />
compared to other prosperous EU Member States and the US. This is a<br />
good performance for a highly developed economy with a high standard of<br />
living (see also GDP per capita). The structural reforms that have been<br />
implemented in areas such as the labour market and the social security<br />
system, have created conditions for potentially healthy economic growth<br />
that offers room for investments in knowledge and innovation, for<br />
example, so that the Netherlands will remain a prosperous, sustainable<br />
and enterprising nation.<br />
Macro indicators 19
Moderate<br />
inflation<br />
Average annual inflation (2006-2013)<br />
Switzerland 0.4<br />
1.5<br />
Ireland 1.1.6<br />
Sweden 1.7<br />
1.6<br />
France 2.0<br />
1.8<br />
Germany 1.8 2.1<br />
Netherlands 2.2<br />
Euro area 2.2<br />
Denmark 2.3<br />
Austria 2.4<br />
1.9<br />
2.0<br />
2.0<br />
2.2<br />
Belgium 2.32.6<br />
Average annual price increases as a percentage.<br />
Source: Eurostat, 2014.<br />
The Netherlands enjoys a good reputation in monetary terms. Long<br />
before the introduction of the euro, price rises in the Netherlands were<br />
at a moderate level, thanks to sound monetary policies on the part of DNB<br />
(the Dutch central bank). The product and labour markets also operate<br />
relatively well, which helps to moderate price increases. According to the<br />
IMD (2014), the Netherlands ranks third worldwide in the fight against<br />
unfair competition.<br />
20 Macro indicators
High labour<br />
participation rate<br />
Employment rates (2014)<br />
Switzerland<br />
Sweden<br />
Germany<br />
Netherlands<br />
Denmark<br />
Austria<br />
United Kingdom<br />
Finland<br />
United States<br />
OECD-countries<br />
75.879.7<br />
74.9 75.7<br />
72.2 74.0<br />
71.6 73.9<br />
70.6 73.6<br />
70.4 72.6<br />
68.4 72.0<br />
67.6 68.7<br />
.<br />
68,5 67.5<br />
65.7 66.3<br />
Source: OECD, 2015.<br />
0 10 20 30 40 50 60 70 75,8<br />
In the last two decades, the level of employment in the Netherlands has<br />
increased by more than 30%. The strong growth in jobs is largely due to<br />
the structural economic reforms that have been implemented. The lack of<br />
unrest in the labour market - there are relatively few strikes in the<br />
Netherlands - is also a contributory factor as regards maintaining a<br />
favourable business climate. Thanks to the firm growth in employment, a<br />
large proportion of the potential working population is in work. Indeed,<br />
the proportion is considerably greater than the average of the OECD<br />
countries.<br />
Macro indicators 21
Many part-time<br />
employees<br />
Part-time work (2013)<br />
Netherlands 39.9<br />
Switzerland 25.4<br />
Ireland 25.1<br />
United Kingdom 23.9<br />
Germany 22.8<br />
Denmark 19.8<br />
Belgium 19.8<br />
Austria 19.3<br />
Luxembourg 14.5<br />
France 14.3<br />
Measured as a percentage of employment as a whole.<br />
Source: OECD, 2015.<br />
0 5 10 15 20 25 30 35 37,1<br />
A relatively high proportion of Dutch people work part-time. This is often<br />
a deliberate decision, allowing employees to combine work with caring for<br />
their family. From an international perspective, the number of people - and<br />
particularly women - in the Netherlands who work part-time is high: nearly<br />
75% of all Dutch part-time workers are women. Nevertheless, the average<br />
working week for full-time employees is more or less on a par with most<br />
other Eurozone countries. The same applies to the number of hours<br />
worked in a year by full-time employees.<br />
22 Macro indicators
Relatively low<br />
unemployment<br />
Average unemployment (2006-2013)<br />
Switzerland<br />
Netherlands<br />
3.8<br />
4.3<br />
4.4 4.3<br />
Austria<br />
4.5<br />
4.8<br />
Luxembourg<br />
4.9<br />
5.5<br />
Denmark<br />
United Kingdom<br />
5.8<br />
5.9<br />
6.96.3<br />
United States<br />
7.3<br />
7.1<br />
Germany<br />
7.3<br />
7.8<br />
Sweden<br />
7.5<br />
8.3<br />
Euro area<br />
8.4<br />
9.6<br />
Measured as a percentage of the working population.<br />
Source: OECD, 2014.<br />
0 2 4 6 8<br />
The rate of unemployment in the Netherlands is one of the lowest in<br />
Europe. From 2006 to 2013, an average of 4.4% of the potential working<br />
population was unemployed, while the corresponding rate in the euro<br />
countries was 9.6%. As a result of the crisis the unemployment in the<br />
Netherlands increased. In February 2015 it amounted to 7.1% (Eurostat,<br />
2015), compared to an average of 11.3% in the euro countries. Moreover,<br />
youth unemployment is also still low in the Netherlands. In February 2015,<br />
the portion of <strong>Holland</strong>’s potential working population aged under-25 that<br />
was unemployed amounted to 11.0%. In the EU-28, the average was 21.1%.<br />
Macro indicators 23
Source: Netherlands Enterprise Agency
3. Trade and<br />
Foreign Investment<br />
The Netherlands plays a prominent role in the<br />
world economy due to its exports, imports,<br />
attracting foreign investors, and investments<br />
abroad. Its favourable location in relation to the<br />
European hinterland and its world-class<br />
infrastructure – such as the Port of Rotterdam<br />
and Schiphol Airport – have helped the<br />
Netherlands become an important distribution<br />
centre.<br />
25
Open<br />
economy<br />
Dutch exports of goods and services<br />
1970 44.8<br />
1975 49.8<br />
1980 52.3<br />
1985 62.1<br />
1995 56.1<br />
2000 70.1<br />
2005 69.6<br />
2014 83.2<br />
Measured as a percentage of GDP.<br />
Source: CPB, 2015.<br />
0 10 20 30 40 50 60 70 72,6<br />
The Netherlands has traditionally always had an open economy and the<br />
level of trade with other countries is very significant. According to<br />
research carried out by the Netherlands Bureau for Economic Policy<br />
Analysis, the Netherlands earns some 33% of its income from the export of<br />
goods and services. In 2014, the value of exports was 83.2% of the<br />
Netherlands’ GDP.<br />
26 Trade and foreign investment
World’s fifth-largest<br />
exporter of goods<br />
Top 10 exporters of goods (2013)<br />
Millions of US dollars Share in world exports (%)<br />
China 2,210,523<br />
United States<br />
Germany<br />
Japan<br />
Netherlands<br />
France<br />
South Korea<br />
United Kingdom<br />
Russian<br />
Federation<br />
Italy<br />
715,097<br />
4.0<br />
664,178<br />
3.7<br />
566,879<br />
3.2<br />
559,619<br />
3.1<br />
548,967<br />
3.1<br />
526,392<br />
2.9<br />
517,659<br />
2.9<br />
12.3<br />
1,578,001<br />
8.8<br />
1,458,647<br />
8.1<br />
Source: World Trade Organisation, 2014<br />
As the fifth-largest exporter of goods in the world, the Netherlands<br />
occupies a prominent position when it comes to world trade. In 2013, the<br />
Netherlands exported goods worth a total of almost 664 billion US dollars,<br />
which is about 3.7% of the world’s total exports. The Netherlands is also a<br />
significant exporter of commercial services: exports of commercial<br />
services amounted to 142 billion US dollars (110 billion euros) in 2013,<br />
which placed the country ninth in the world rankings.<br />
Trade and foreign investment 27
Strong in agri-food<br />
production<br />
Top 5 exporters of agricultural products (2013)<br />
Millions of US dollars Share in world imports (%)<br />
United States 175,567<br />
10.4<br />
Netherlands<br />
111,458<br />
6.2<br />
Germany<br />
99,232<br />
5.5<br />
Brazil<br />
5.2<br />
90,664<br />
France<br />
82,227<br />
4.7<br />
Source: World Trade Organisation, 2013.<br />
The Netherlands is the world’s second-largest exporter of agri-food<br />
products. For decades, the Dutch agriculture sector has succeeded in<br />
maintaining its lead over international competitors through continual<br />
investment in innovation in agri-food value chains. The Netherlands is a<br />
hotbed of R&D in the area of agri-food, due largely to the excellent<br />
knowledge infrastructure and close collaborations between knowledge<br />
institutes, government and the private sector, the so-called “golden<br />
triangle”. Key R&D centres include Wageningen University and Research<br />
Centre (WUR), the Top Institute Food & Nutrition and the public-private<br />
innovation program FND+. Some 12 out of the 40 largest Food & Beverage<br />
companies in the world have R&D facilities located in the Netherlands.<br />
WUR is the foremost university in Europe in the field of agriculture, and<br />
second in the world, according to the Higher Education Evaluation &<br />
Accreditation Council of Taiwan.<br />
28 Trade and foreign investment
Major importer of<br />
goods and services<br />
Top 10 importers of goods (2013)<br />
United States 2,328,329<br />
China<br />
Germany<br />
Japan<br />
Hong Kong, China<br />
France<br />
United Kingdom<br />
Netherlands<br />
South Korea<br />
India<br />
Millions of US dollars Share in world imports (%)<br />
2.7<br />
2.6<br />
3.5<br />
3.1<br />
3.7<br />
3.6<br />
4.4<br />
703,872<br />
668,658<br />
655,698<br />
509,844<br />
515,573<br />
488,442<br />
6.4<br />
833,166<br />
10.4<br />
12.4<br />
1,194,483<br />
Source: International Trade Organisation, 2014.<br />
1,949,935<br />
As well as being a major exporter, the Netherlands also imports large<br />
quantities of goods: 591 billion-US-dollars-worth in 2013. With a about 3.1%<br />
share of the global total, the country is the ninth-largest importer of<br />
goods in the world. The Netherlands is also a significant importer of<br />
commercial services - imports of commercial services amounted to 121<br />
billion US dollars (94 billion Euros) in 2013, which placed the Netherlands<br />
eight in the world rankings.<br />
Trade and foreign investment 29
Most significant trading<br />
partner: Western Europe<br />
Geographical destination of Dutch exports (2013)<br />
5<br />
4<br />
6<br />
5 5<br />
4 4<br />
6<br />
7<br />
6<br />
7<br />
7<br />
3<br />
3<br />
3<br />
2<br />
2<br />
2<br />
1<br />
1<br />
1<br />
1. All of Europe 340.8<br />
1. All of 1. Europe All of 340.8 Europe 340.8<br />
2. All of Africa 14.4<br />
2. All of 2. Africa All of 14.4 Africa 14.4<br />
3. All of North America 19.4<br />
3. All of 3. North All of America North America 19.4 19.4<br />
4. All of Central and<br />
4. All of 4. Central All of and Central and<br />
South America 9,7<br />
South America South America 9,7 9,7<br />
5. Near and Middle East 7.9<br />
5. Near 5. and Near Middle and East Middle 7.9 East 7.9<br />
6. Asia 39<br />
6. Asia 6. 39 Asia 39<br />
7. Oceania 2.6<br />
7. Oceania 7. Oceania 2.6 2.6<br />
Values in billions of euros.<br />
Source: Statistics Netherlands, 2014.<br />
The role of the Netherlands as a key distribution location is also indicated<br />
by the volume of import and export activities. Almost 79% of Dutch exports<br />
remain within Europe, especially Western Europe. Germany is easily the<br />
Netherlands’ most significant trading partner, followed by Belgium,<br />
the United Kingdom and France.<br />
30 Trade and foreign investment
Gateway<br />
to Europe<br />
Geographical origin of Dutch imports (2013)<br />
rur<br />
6<br />
6<br />
6<br />
7<br />
7<br />
7<br />
5<br />
5<br />
5<br />
4<br />
4<br />
4<br />
3<br />
3<br />
3<br />
2<br />
2<br />
2<br />
1<br />
1<br />
1<br />
1. All of Europe 242.5<br />
1. All of 1. Europe All of Europe 242.5 242.5<br />
2. All of Africa 15.4<br />
2. All of 2. Africa All of 15.4 Africa 15.4<br />
3. All of North America 27.9<br />
3. All of 3. North All of America North America 27.9 27.9<br />
4. All of Central and<br />
4. All of 4. Central All of Central and and<br />
South America 16.6<br />
South America South America 16.6 16.6<br />
5. Near and Middle East 10.5<br />
5. Near 5. and Near Middle and East Middle 10.5 East 10.5<br />
6. Asia 70.1<br />
6. Asia 6. 70.1Asia 70.1<br />
7. Oceania 1.4<br />
7. Oceania 7. Oceania 1.4 1.4<br />
Values in billions of euros.<br />
Source: Statistics Netherlands, 2014.<br />
The Netherlands has become a key hub for distribution in Europe because<br />
of its favourable location in relation to the European hinterland and the<br />
country’s world-class air and sea ports such as the Port of Rotterdam<br />
(Europort) and Amsterdam Airport Schiphol. The Netherlands is home<br />
to more distribution centres than anywhere else in Europe and has the<br />
largest inland shipping fleet in Europe.<br />
Trade and foreign investment 31
Dutch paints add a touch<br />
of colour to the world<br />
Composition of Dutch exports (2013)<br />
9 9<br />
9<br />
10 10<br />
10<br />
1 1<br />
1<br />
2 2<br />
2<br />
3 3<br />
3<br />
8 8<br />
8<br />
4 4<br />
4<br />
7 7<br />
7<br />
6 6<br />
6<br />
5 5<br />
5<br />
1. 1. Animal Animal feed feed and and live live animals animals 53.8 53.8 6. 6. Chemical products 74.6 74.6<br />
2. 2.<br />
1. Beverages Animal feed and and<br />
and tobacco live animals 7.4 7.4<br />
53.8 7. 6.<br />
7. Manufactured Chemical products goods goods<br />
74.6 35.3 35.3<br />
3. 3.<br />
2. Raw Raw<br />
Beverages materials,<br />
and tobacco 7.4<br />
8. 7.<br />
8. Machinery Manufactured and and transportation<br />
goods 35.3<br />
3. inedible Raw materials,<br />
(not (not fuels) fuels) 19.8 19.8<br />
8. equipment Machinery and transportation<br />
108.6 108.6<br />
4.<br />
inedible (not fuels) 19.8<br />
4. Mineral Mineral fuels, fuels, lubricants 87.1 87.1 9.<br />
equipment 108.6<br />
9. Miscellaneous manufactured<br />
5.<br />
4. Mineral fuels, lubricants 87.1<br />
9. Miscellaneous manufactured<br />
5. Animal Animal and and vegetable<br />
goods goods 40.5 40.5<br />
5. Animal and vegetable<br />
oils<br />
goods 40.5<br />
oils and and fats fats 4.3 4.3<br />
10. 10. Other Other goods goods 2.5 2.5<br />
oils and fats 4.3<br />
10. Other goods 2.5<br />
Values in billions of euros. Source: Statistics Netherlands, 2014.<br />
The Netherlands is the second-largest exporter of agricultural products<br />
worldwide, after the United States. Horticulture is by far the most<br />
important segment within the agricultural sector. Other significant Dutch<br />
exports include chemical products (e.g. Sikkens paint), machinery (e.g.<br />
ASML lithography systems) and vehicles (DAF trucks and Scania trucks).<br />
The Netherlands is also a well-known exporter of high-quality aerospace<br />
components and systems (Fokker), ships (IHC Merwede), yachts (Royal Van<br />
Lent Shipyard) and busses and car parts (VDL Group).<br />
32 Trade and foreign investment
Biggest trading partner:<br />
Germany<br />
Composition of Dutch imports (2013)<br />
9 9<br />
9<br />
10 10<br />
10<br />
1 1<br />
2 2<br />
3 3<br />
8 8 8<br />
4<br />
4<br />
7 7<br />
7<br />
1. Animal feed and live animals 35<br />
1. 1. Animal feed feed and and live live animals 35 35<br />
2. Beverages and tobacco 3.8<br />
2. 2. Beverages and and tobacco 3.8 3.8<br />
3. Raw materials, inedible<br />
3. 3. Raw Raw materials, inedible<br />
(not fuel)s 13.8<br />
(not (not fuel)s 13.8 13.8<br />
4. Mineral fuels, lubricants 95.9<br />
4. 4. Mineral fuels, lubricants 95.9 95.9<br />
5. Animal and vegetable<br />
5. 5. Animal and and vegetable<br />
oils and fats 4.8<br />
oils oils and and fats fats 4.8 4.8<br />
5 5<br />
6 6<br />
6. Chemical products 51.8<br />
6. 6. Chemical products 51.8 51.8<br />
7. Manufactured goods 34.9<br />
7. 7. Manufactured goods 34.9 34.9<br />
8. Machinery and transportation<br />
8. 8. Machinery and and transportation<br />
equipment 103<br />
equipment 103 103<br />
9. Miscellaneous manufactured<br />
9. 9. Miscellaneous manufactured<br />
goods 40<br />
goods 40 40<br />
10. Other goods 1.4<br />
10. 10. Other goods 1.4 1.4<br />
Values in billions of euros.<br />
Source: Statistics Netherlands, 2014.<br />
In 2013, 16.5% of all imports into the Netherlands originated in Germany.<br />
Almost half of all products purchased by the Netherlands in Germany were<br />
related to chemical products and machinery. Of all of the cars imported<br />
into the Netherlands, more than 90% came from Europe, particularly<br />
Belgium, France and Germany. Belgium (9.8% of total imports of goods) and<br />
China (8.3%) were respectively second and third Dutch import partner.<br />
In 2013 the value of Dutch imports (of goods) was 384.3 billion Euros.<br />
Trade and foreign investment 33
Seventh-largest foreign<br />
investor in the world<br />
Foreign investors in the world (2013)<br />
United States 6,350<br />
China<br />
(incl. Hong Kong)<br />
United Kingdom<br />
France 1,637<br />
Switzerland 1,259<br />
Netherlands 1,072<br />
1,966<br />
1,885<br />
Germany 1,710<br />
Belgium 1,009<br />
Japan 993<br />
Canada 732<br />
Most important foreign investors in the world, in billions of US dollars.<br />
Source: UNCTAD, 2014.<br />
500 510 520 530 540 550<br />
Dutch businesses are truly international in their orientation. Dutch-based<br />
multinationals, such as AkzoNobel, Heineken, KPN, ING, Philips, Unilever<br />
and Shell have made substantial foreign investments in the past. The total<br />
value of Dutch investments in other countries is considerable. In late 2013,<br />
investments overseas totalled in excess of 1,072 billion US dollars, making<br />
the Netherlands the seventh-largest foreign investor in the world.<br />
34 Trade and foreign investment
Attractive for inward<br />
foreign investments<br />
Main recipients of foreign investment in Europe (2013)<br />
United Kingdom 1,606<br />
France<br />
1,081<br />
Belgium 924<br />
Germany<br />
852<br />
Switzerland 747<br />
Spain 716<br />
Netherlands 670<br />
Russian Federation 576<br />
Sweden 378<br />
Ireland 378<br />
Stocks, in billions of US dollars.<br />
Source: UNCTAD, 2014.<br />
200 600 1000 1400 540 550<br />
In 2013, foreign companies had inward direct investments worth 670<br />
billion US dollars. As a result, the Netherlands is the world’s eleventhlargest<br />
and Europe’s seventh-largest recipient of foreign investment. In<br />
2013 inward Dutch FDI stock amounted to 497.7 billion Euros or 82.2% of<br />
the Netherlands’ GDP. More than 6,300 foreign companies have established<br />
over 8,110 operations in the Netherlands. Among the many prominent<br />
international companies are firms like Abbott Laboratories, Boeing,<br />
Bombardier, Bosch, Cisco Systems, Danone, Dow, Eastman Chemical,<br />
Heinz, Hitachi, Huawei, ICBC, Medtronic, NCR Corporation, Reebok, RWE,<br />
Samsung, Siemens and Teijin.<br />
Trade and foreign investment 35
Source: Netherlands Enterprise Agency
4. <strong>Holland</strong> Digital<br />
Gateway<br />
The Netherlands is a leading ICT innovator and<br />
a digital gateway to Europe. It has strong ICT<br />
infrastructure and an open innovation model<br />
that leads to high-level research. Moreover, the<br />
Dutch are keenly focused on cyber security and<br />
have developed various centres of expertise<br />
such as The Hague Security Delta. The<br />
Netherlands plays a key role in global Internet<br />
traffic. About a third of Europe’s Internet traffic<br />
with the US goes via the Amsterdam Internet<br />
Exchange. The quality of ICT infrastructure<br />
and security in The Netherlands makes it an<br />
attractive location for foreign investors: 25% are<br />
ICT related.<br />
37
<strong>Holland</strong>’s ICT Playing<br />
Field<br />
Metropolitan Amsterdam<br />
Regional cooperation and<br />
innovation in the area of<br />
transport, distribution, and<br />
data processing (new<br />
media, social sciences, data<br />
infrastructure). Dominant<br />
players: Amsterdam Start<br />
Up Delta, Amsterdam<br />
Internet Exchange<br />
(AMS-IX), Science Park<br />
Watergraafsmeer, SURF.<br />
Groningen<br />
Regional cooperation on<br />
focus areas big data and<br />
radio astronomy.<br />
Dominant players: IBM,<br />
Google, RUG, Astron.<br />
East Netherlands<br />
Regional cooperation on focus<br />
areas e-Health and human<br />
capital. Dominant players:<br />
Roessingh Institute, TU Twente,<br />
health care institutions,<br />
businesses in the Health Valley.<br />
The Hague<br />
The Hague Security Delta (HSD), largest security<br />
cluster in Europe. Public and private innovation in<br />
cyber security. Dominant players: Hague Security<br />
Delta Campus, Twente Safety & Security (TS&S),<br />
Dutch Institute for Technology Safety & Security,<br />
Brabant (DITSS).<br />
Eindhoven<br />
Regional cooperation<br />
on focus areas human<br />
capital and big data for<br />
industrial processes.<br />
Dominant players:<br />
ICT-driven companies<br />
such as Philips and<br />
various high tech<br />
suppliers, TU Eindhoven,<br />
Brainport.<br />
38 HOLLAND DIGITAL GATEWAY
The Dutch and ICT<br />
Strong in innovation, security and connectivity<br />
• The Netherlands is an international internet hub. It has the most<br />
competitive internet market and the second highest online<br />
connectivity in the world. 98% of households are connected to<br />
(broadband) internet compared to the European average of 62%.<br />
• The Dutch are active internet users: 91% of Dutch aged 16-74<br />
compared to average 75% of Europeans in same age group. 75% of<br />
Dutch between 16-74 years have basic ICT skills. The European<br />
average is 59%.<br />
• Businesses from within and outside <strong>Holland</strong> invest in data centres<br />
and fibre optics connections in <strong>Holland</strong>, due to the country’s good<br />
digital infrastructure.<br />
• As a result, a third main-port of large economic importance has<br />
come into being: the digital hub. This hub has created 140,000<br />
jobs (Research by Deloitte. In comparison, Schiphol airport has<br />
166,000 jobs and the Port of Rotterdam, 184,000.)<br />
• For further economic growth, The Netherlands continues to invest<br />
in economic opportunities in the cyber domain and to stimulate<br />
research there<br />
• In addition, the Netherlands is committed to renewing laws and<br />
regulations that limit restrictions to digital innovation and growth.<br />
• The Netherlands actively supports the adoption of international<br />
internet standards and open and secure international internet<br />
hosting.<br />
• COMMIT is the biggest ICT research project in The Netherlands,<br />
including 100 ICT companies, users and universities, working<br />
together.<br />
HOLLAND DIGITAL GATEWAY 39
40 HOLLAND DIGITAL GATEWAY
HOLLAND DIGITAL GATEWAY 41
Everyone’s into ICT<br />
Most advanced ICT economies (2015)<br />
Singapore 6.00<br />
Finland 6.00<br />
Sweden 5.80<br />
Netherlands 5.80<br />
Norway 5.80<br />
Switzerland 5.70<br />
United States 5.60<br />
United Kingdom 5.60<br />
Luxembourg 5.60<br />
Japan<br />
5.60<br />
Source: World Economic Forum, 2015.<br />
Research done in 20158, by the<br />
7,5<br />
WEF<br />
7,6<br />
into<br />
7,7<br />
network<br />
7,8 5,5<br />
readiness,<br />
5,6 5,7<br />
awarded<br />
5,8 5,9<br />
<strong>Holland</strong><br />
6 8,5<br />
an excellent score: 4th place (in 2013 and 2014) in a list of 143 countries. The<br />
WEF-Networked Readiness Index (NRI) is one of the most comprehensive and<br />
authoritative assessments of the impact of ICT on competitiveness of nations<br />
and the well-being of their citizens. The NRI assesses the preparedness of an<br />
economy to fully leverage ICT in terms of: (1) ICT infrastructure, cost of access<br />
and the presence of the necessary skills to ensure an optimal use; (2) Uptake<br />
and use of ICT among governments, business and individuals; (3) Business<br />
and innovation environment, and the political and regulatory framework; and<br />
(4) Economic and social impacts accruing from ICT, and according to the<br />
International Telecommunication Union, the Netherlands ranks 7th among<br />
the world’s most advanced ICT economies, above countries such as Japan and<br />
the U.K. ITU’s ICT Development Index ranks 166 countries according to their<br />
level of ICT access, use and skills.<br />
42 HOLLAND DIGITAL GATEWAY
HOLLAND DIGITAL GATEWAY 43
Leading the field<br />
in broadband<br />
Number of broadband connections (2013)<br />
Switzerland<br />
44.9<br />
Netherlands<br />
Denmark<br />
40.4<br />
35.640.0<br />
France<br />
Korea<br />
Norway<br />
32.8<br />
33.5<br />
33.9<br />
37.0<br />
37.6<br />
37.5<br />
Iceland<br />
United Kingdom<br />
Germany 30.4<br />
31.9<br />
32.4<br />
35.2<br />
34.8<br />
35.8<br />
Belgium 30.3<br />
34.4<br />
Measured per 100 inhabitants.<br />
Source: OECD, 2015.<br />
28 29 30 32 33 34 35 36 37 38 39 40 41 42 43 44<br />
In December 2013, the Netherlands had the second-highest number of<br />
broadband connections per 100 inhabitants in the world. Almost<br />
every household in the Netherlands can be reached by a cable or<br />
DSL connection. With the world’s largest digital data distributor, the<br />
Amsterdam Internet Exchange (AMS-IX), the Netherlands also has an<br />
outstanding data connection network, which is essential for businesses<br />
such as banks, insurers, internet-based companies and computer and<br />
advertising companies.<br />
44 HOLLAND DIGITAL GATEWAY
Source: Netherlands Enterprise Agency<br />
45
Source: Netherlands Enterprise Agency
5. Top Sectors in<br />
Focus<br />
In its economic policy, the Dutch government is<br />
focussing on nine business sectors that are key<br />
to <strong>Holland</strong>’s international trade and investment.<br />
These are sectors that are leading the way in<br />
innovation and sustainability, collaborating<br />
with <strong>Holland</strong>’s knowledge institutes on worldclass<br />
research and development. Expertise and<br />
products from these Dutch sectors is on demand<br />
around the world. Together, these sectors are<br />
the drivers of the Dutch economy.<br />
47
Source: Netherlands Enterprise Agency
Agriculture & Food<br />
Sector<br />
World-leading supplier of agri-food products<br />
• <strong>Holland</strong> is the world’s 2nd largest exporter of agricultural<br />
products, after the USA. Together with the USA and Spain, <strong>Holland</strong><br />
is one of the top 3 exporters of vegetables and fruit.<br />
• The total value of Dutch agricultural exports was 80.7 billion euros<br />
in 2014.<br />
• In 2012 the Dutch agri-food industry contributed 48.7 billion euros<br />
of added value to Dutch GDP.<br />
• The Netherlands is the largest exporter of tomatoes and potatoes<br />
in the world. In 2013 the Dutch agrifood sector exported tomatoes<br />
to the value of about 1.8 billion US dollars.<br />
• Four out of the world’s top-30 food and beverage companies<br />
WORDT Three out of the world’s top-25 food and beverage<br />
companies.<br />
• The Food Valley region, centred at Wageningen University and<br />
Research Center, is one of the most authoritative agri-food and<br />
nutrition research centres in Europe. Wageningen University<br />
occupies the first place in the European ranking, and the second<br />
place worldwide in the QS World University Rankings by Subject<br />
2014, in the category Agriculture & Forestry.<br />
• NIZO food research owns the largest food testing pilot plant in<br />
Europe and is open to the entire food and ingredient industry.<br />
• <strong>Holland</strong> is one of the world’s leading developers and<br />
manufacturers of food processing machinery. Dutch industry<br />
produces 80% of the world’s capacity of poultry processing<br />
machinery, and a substantial amount of cheese production<br />
machinery.<br />
• Dutch agricultural entrepreneurs use efficient and sustainable<br />
production systems and processes, resulting in a productivity that<br />
is five times higher than the European average.<br />
• Amsterdam is the largest cocoa port in the world.<br />
TOP SECTORS IN FOCUS 49
Source: Green Chemistry Campus
Chemical Sector<br />
Chemical portal to Europe<br />
• The chemical industry is one of the leading business sectors in the<br />
Netherlands, making a significant contribution to the economy. In<br />
2013, the turnover was 57 billion euros.<br />
• The Netherlands is the world’s 5th ranking chemical exporting<br />
country. In 2013, Dutch chemical exports were valued at some<br />
75 billion euros.<br />
• <strong>Holland</strong> is one of Europe’s leading suppliers of chemical products<br />
and services.<br />
• The competitiveness of the Dutch chemical industry lies in its<br />
internal and inter-company integration. Chemical companies work<br />
together on innovation and production, and take advantage of<br />
regional clustering.<br />
• The Netherlands hosts 16 of the world’s top 25 leading chemical<br />
companies, including BASF, AkzoNobel and Shell.<br />
• <strong>Holland</strong> is also home to world-class R&D institutes for<br />
fundamental and applied research such as TNO, Delft University,<br />
Twente University, Wageningen University and Eindhoven<br />
University.<br />
• Within the strong chemical community, the Dutch have formalized<br />
and structured the approach to co-operation. This is done with<br />
formal, long-term public-private partnerships (such as BE-Basic,<br />
the Institute for Sustainable Process Technology and the Dutch<br />
Polymer Institute) as well as through ‘open innovation’ in so called<br />
Centres for Open Chemical Innovation (COCI). The five COCIs are<br />
Chemelot; the Green Chemistry Campus; Plant One; Biotech<br />
Campus; and Green Polymer Application Valley.<br />
• In the area of advanced materials (polymers, composites, etc), the<br />
Netherlands consistently punches above its weight, producing<br />
world-renowned innovations in materials such as Twaron,<br />
Dyneema and Glare, as well as the folding tires for the automotive<br />
industry.<br />
TOP SECTORS IN FOCUS 51
Source: Netherlands Enterprise Agency
Creative Industries<br />
Masters in architecture, design, fashion and gaming<br />
• <strong>Holland</strong>’s creative industry ranks among the world’s top 10 in<br />
terms of trade figures, jobs and registrations of brands and<br />
patterns.<br />
• The annual turnover of Dutch creative industries is 32.8 billion<br />
euros.<br />
• Dutch architects are commissioned to design prestigious<br />
buildings around the world such as the Mercedes Benz Museum<br />
in Stuttgart, the CCTV Headquarters in Beijing and Battery Park in<br />
New York. Renowned Dutch architects/agencies include Rem<br />
Koolhaas (OMA), Francine Houben (Mecanoo), Ben van Berkel and<br />
Caroline Bos (UNStudio).<br />
• <strong>Holland</strong> has a long tradition of interior design, epitomized by<br />
Rietveld’s furniture designs. Marcel Wanders is currently one the<br />
world’s best known furniture designers.<br />
• Dutch fashion designers with international acclaim Viktor & Rolf,<br />
Spijkers and Spijkers, Iris van Herpen, Jan Taminiau and Marlies<br />
Dekkers. World-famous Dutch fashion brands include G-Star,<br />
Sandwich, Gsus and Supertrash.<br />
• <strong>Holland</strong> is the world’s 3rd largest exporter of television formats. TV<br />
producers such as John de Mol, Endemol and Eyeworks are the<br />
creative engine behind some of the world’s most popular TV<br />
shows, such as The Voice, Big Brother, Deal or No Deal, Obese and<br />
So You Wannabe a Popstar.<br />
• The Netherlands is a world-leading developer of computer games<br />
including serious games such as VStep’s Ship Simulator. Famous<br />
Dutch leisure games include Killzone and Age of Wonders.<br />
• The Netherlands is a pioneer in the area of dance music and large<br />
dance events such as Sensation. Dutch DJ Hardwell was voted<br />
world’s best DJ 2013 and 2014, and prior to that DJ Armin van<br />
Buuren was voted the world’s best DJ for five years.<br />
TOP SECTORS IN FOCUS 53
Source: Netherlands Enterprise Agency
Energy Sector<br />
Innovative, sustainable energy solutions<br />
• The Netherlands is a major natural gas producer and the source of<br />
advanced gas technology. Besides it is also Europe’s leading gas<br />
broker and a strategic gas hub. The country produced 84.9 billion<br />
cubic metres (bcm) in 2013; gas exports amounted to 67.3 bcm.<br />
• The distribution network for gas is the densest in Europe and of a<br />
very high standard.<br />
• The Dutch have unmatched capacity to cope with seasonal<br />
fluctuations in gas demand, providing north-western Europe with<br />
much-needed flexibility.<br />
• <strong>Holland</strong> has an international reputation for research in renewable<br />
energy, for instance in the field of solar energy, with institutes<br />
such as FOM and ECN, as well as various universities. The Dutch<br />
team from Delft University of Technology has won the World Solar<br />
Challenge, the biennial competition for solar cars, in 2001, 2003,<br />
2005, 2007 and 2013.<br />
• The Dutch have leading expertise in offshore wind energy,<br />
co-combustion of biomass in coal-fired power plants, pretreatment<br />
methods of biomass, the use of landfill gas, and the use<br />
of heat pumps combined with heat and cold storage.<br />
• There is extensive experience in the field of energy efficiency due<br />
to a long tradition of multi-annual voluntary agreements on<br />
energy efficiency between Dutch industry and the government.<br />
This has made Dutch industry one of the most energy efficient in<br />
the world.<br />
• 7.5 million tons of municipal waste is converted in 13 efficient and<br />
clean waste incinerators to power, heat and reusable resources<br />
from the ashes.<br />
• The Netherlands is establishing itself as leader in green gas.<br />
‘Green gas’ technology, the gasification of biomass, has been<br />
patented by Dutch energy company ECN.<br />
• The Netherlands plays a key role as a major oil-refining centre in<br />
Europe, with an extensive supply network of ports, storage<br />
facilities and pipeline connections playing a critical role for oil<br />
supplies to the continent.<br />
TOP SECTORS IN FOCUS 55
Source: Netherlands Enterprise Agency
High Tech Sector<br />
New technologies for health, mobility, energy and security<br />
• <strong>Holland</strong>’s high-tech sector is a world leader in the development of<br />
new technologies and materials for use in communication<br />
systems, aircraft and automobiles, medical devices, energy<br />
generation and semiconductor production.<br />
• Dutch companies invented WiFi, the CD and the DVD. Bluetooth<br />
was invented by Dutchman Jaap Haartsen. And high-tech<br />
equipment from Dutch companies are used in 90% of all silicon<br />
chips produced worldwide.<br />
• The Netherlands is strong in nanotechnology research. Dutch<br />
publications in nanotechnology are the most frequently cited by<br />
patents, compared to all other countries in the world. The country<br />
ranks 3rd in citation impact.<br />
• The Netherlands is also world leader in designing, developing and<br />
making high-tech equipment and micro/nano components.<br />
Characteristic features of this equipment are: highly intelligent<br />
(embedded systems, software, sensors); very precise (nanoelectronics,<br />
high precision manufacturing), and highly efficient<br />
(mechatronics and smart electronics)<br />
• Dutch multinational ASML is the world’s leading provider of<br />
lithography machines for the semiconductor industry.<br />
• In 2012 the export value from the HTSM sector was 45 billion<br />
euros, and the added value 42 billion euros.<br />
• The Netherlands has a world-leading position in the design and<br />
manufacture of milking robots.<br />
• In 2014, Tech United, a team from the Technical University<br />
Eindhoven (TU/e), became World Champion Robot Soccer for the<br />
second time at the RoboCup 2014 in Brazil.<br />
TOP SECTORS IN FOCUS 57
Source: Netherlands Enterprise Agency
Horticulture Sector<br />
World’s leading supplier of flowers, plants and trees<br />
• The Dutch horticulture sector is a global trendsetter and the<br />
undisputed international market leader in flowers, plants, bulbs<br />
and propagation material.<br />
• A quarter of the world trade in horticultural products (24%) is in<br />
Dutch hands. <strong>Holland</strong> has a 52% share of the worldwide trade in<br />
floricultural products, making it the dominant global supplier of<br />
flowers and flower products. Some 80% of all flower bulbs traded<br />
worldwide come from the Netherlands, the majority of which are<br />
tulips.<br />
• The sector is the number 3 exporter in nutritional horticulture<br />
products.<br />
• Dutch horticultural innovations include intelligent greenhouses<br />
that can float on water, moving platforms, robots, innovative<br />
lighting, water and waste recycling, and greenhouses that<br />
generate more energy than they consume and thus contribute to<br />
a reduction in CO2.<br />
• Of the approximately 1,800 new plant varieties that enter the<br />
European market each year, 65% originate in the Netherlands. In<br />
addition, Dutch breeders account for more than 35% of all<br />
applications for community plant variety rights.<br />
• The Dutch are the world’s largest exporter of seeds: the exports of<br />
seeds amounted to 1.6 billion dollars in 2014.<br />
• In 2014 the Netherlands was the world’s second largest exporter<br />
(in value) of fresh vegetables. The Netherlands exported<br />
vegetables with a market value of 7.8 billion US dollars.<br />
TOP SECTORS IN FOCUS 59
Source: Enraf-Nonius
Life Sciences and Health<br />
Sector<br />
Helping to advance health worldwide<br />
• The Netherlands ranks 4th worldwide in patent applications for<br />
medical technology and 9th in patent applications for<br />
biotechnology..<br />
• With approximately 375 innovative life sciences companies<br />
clustered within a 120 mile radius, <strong>Holland</strong> is the most<br />
geographically concentrated region in the world when it comes to<br />
creating economic and social value in Life Sciences and Health.<br />
• Expertise in healthcare infrastructure is characterised by a<br />
turn-key plus approach: Dutch companies are able to cover all<br />
aspects from hospital design & engineering, financing, waste<br />
management, medical equipment etc. while paying special<br />
attention paid to energy efficiency and ‘healing environments’.<br />
• In 2011, Brainport Eindhoven’s Brainport region was named the<br />
world’s most intelligent ICT and health cluster.<br />
• The excellent medical research infrastructure is strongly focused<br />
on translational research in the different medical fields such<br />
oncology, cardiovascular, immunology and neuroscience.<br />
• The Netherlands is a global market leader in mobile health care,<br />
which enables the Dutch to contribute to rural health care in<br />
developing countries around the globe.<br />
• The industry annually exports around 37 billion euros in total of<br />
which 25 billion euros is pharmaceutical and the rest medical<br />
technology and medical and laboratory instruments.<br />
• The sector invests over 2 billion euros in R&D in the Netherlands<br />
each year and is becoming a globally recognized stronghold of<br />
open innovation. It already accounts for 2.5% of GDP.<br />
• Philips is the world leader in medical imaging and patient<br />
monitoring; DSM is a biomaterials leader.<br />
• The Dutch public-private partnership model, such as the<br />
Netherlands Genomics Initiative (NGI) and the three top institutes<br />
(TI Pharma, CTMM and BMM), have set an international standard.<br />
TOP SECTORS IN FOCUS 61
Source: Netherlands Enterprise Agency
Logistics Sector<br />
Strategic gateway to Europe and the world<br />
• The Netherlands was ranked 2nd in the 2014 World Bank global<br />
Logistics Performance Index (based on terms of efficiency and<br />
effectiveness of its customs, quality of transport, IT infrastructure<br />
for logistics and ease and affordability of shipping).<br />
• The Port of Rotterdam is the world’s 8th-largest and Europe’s<br />
largest port with a throughput of 445 million tons in 2014. From<br />
the Port of Rotterdam, all major industrial and economic centres<br />
in Western Europe can be reached in less than 24 hours.<br />
• In 2013, Schiphol won the ‘ACI EUROPE Best Airport’ award for the<br />
fourth time. Amsterdam Schiphol Airport won two awards at the<br />
2012 Asian Freight & Supply Chain Awards: Best Airport in Europe<br />
and the Best Air Cargo Terminal in Europe. At the 2014 World<br />
Airport Awards air travellers voted Amsterdam Airport Schiphol<br />
the Best Airport in Western Europe.<br />
• According to the World Economic Forum, the quality of the Dutch<br />
infrastructure is among the best in the world, reflecting excellent<br />
facilities for maritime, air, road and railroad transport, ranked 1st,<br />
4th, 5th and 9th, respectively in 2014. IMD Business School ranked<br />
the Netherlands first worldwide in 2014 with regards to the quality<br />
of its water transport infrastructure.<br />
• Dutch inland shipping accounts for 54% of all trade shipping in<br />
Western Europe. The Dutch fleet is, with 7,000 vessels, the biggest<br />
and most modern in Europe. 79% of all containers transported via<br />
inland navigation in the EU-28 countries passes through Dutch<br />
territory.<br />
• Over 1,000 American and Asian companies have centralised their<br />
European distribution activities in the Netherlands. The country<br />
hosts over 20 million square metres of distribution centres.<br />
• The Netherlands has the third cooling and freezing storage<br />
capacity in the EU.<br />
TOP SECTORS IN FOCUS 63
Source: Netherlands Enterprise Agency
Water Sector<br />
World leaders in hydraulic engineering, water treatment and<br />
shipbuilding<br />
• The Dutch are renowned for their integrated water management<br />
and multi-disciplinary approach that balances social, economic,<br />
environmental and engineering needs (‘Building with Nature’).<br />
Dutch companies are involved in the sustainable development of<br />
low-lying urban agglomerations such as Jakarta and Bangladesh,<br />
and coastal development in areas such as Dubai, Vietnam and<br />
Romania.<br />
• 40% of the freely accessible market for water management is in<br />
Dutch hands.<br />
• The Dutch Delta Works are listed in the Guinness Book of Records<br />
as the largest flood defence project in the world. With almost<br />
16,500 kilometres of dykes and 300 structures, the project is one<br />
of the most extensive engineering projects in the world. The<br />
Oosterscheldedam is the largest single tidal barrier in the world,<br />
at 9km in length.<br />
• The Dutch invest heavily in innovation and R&D through publicprivate<br />
partnerships. These include renowned institutes such as<br />
Deltares, MARIN, Wetsus and KWR Watercycle Research Institute.<br />
TNO and large Dutch private firms are also recognised for their<br />
water R&D.<br />
• In the field of water technology and maritime technology, the<br />
Netherlands ranks 8th worldwide for global patents.<br />
• The Dutch began using innovative waste water treatment<br />
techniques in the 1970s. Some 99.9% of Dutch households have<br />
access to clean, entirely chlorine-free drinking water. Additionally,<br />
the level of recycling of industrial waste water is high, and this<br />
recycled water is of such high quality that it can be used in the<br />
food and beverage industries.<br />
• The Dutch maritime cluster comprises 12 sub sectors and 12,000<br />
companies, which employ 224,000 employees. The cluster has a<br />
strong international focus: 60% of the seagoing ships produced in<br />
the Netherlands are destined for export.<br />
TOP SECTORS IN FOCUS 65
Source: Netherlands Enterprise Agency
6. Human Capital<br />
and Innovation<br />
Dutch products are ‘typically’ highly<br />
innovative. The Netherlands provides<br />
solutions to keep rising water levels in check,<br />
create islands in the sea and make waterways<br />
navigable. Apart from solutions for use in the<br />
natural environment, the Dutch also have the<br />
knowledge and the skills to develop products<br />
such as navigation systems with worldwide<br />
appeal (TomTom). This capacity to innovate is<br />
evidenced by the large number of patents that<br />
are applied for every year, and by the presence<br />
of several world-renowned knowledge and<br />
research institutes in the Netherlands.<br />
67
Well-educated<br />
working population<br />
Education level: upper secondary education (2012)<br />
United States 89<br />
Sweden 88<br />
Switzerland 86<br />
Germany 86<br />
Finland 85<br />
Austria 83<br />
United Kingdom 78<br />
Denmark 78<br />
Ireland 73<br />
Netherlands 73<br />
Measured as percentage of population (25-64 years old)<br />
that has attained upper secondary education.<br />
0Source: 10OECD, 20<br />
2014.<br />
30 40 50 60 70 80 90<br />
The internationally-oriented working population of the Netherlands is well<br />
educated, with many people able to speak more than one foreign language<br />
(European Commission, 2012). According to the EF English Proficiency<br />
Index, the Netherlands ranks third out of 54 countries. In addition to<br />
English, and in comparison with neighbouring countries, a good proportion<br />
of the population also speak German and French. According to the<br />
European Commission, the Netherlands has a world-class vocational<br />
education and training (VET) system, with built-in mechanisms to adapt to<br />
current and future skills needs so that training is more demand-driven.<br />
Furthermore, compared to many other EU member states, life-long learning<br />
is commonplace in the Netherlands: adults regularly engage in further<br />
education in order to continually improve their skills and knowledge levels.<br />
68 Human capital and innovation
Dutch schoolchildren<br />
are second in the EU<br />
PISA Score<br />
Singapore<br />
Hong Kong,<br />
China<br />
South Korea<br />
Japan<br />
540<br />
543<br />
555<br />
554<br />
Taiwan<br />
535<br />
Finland<br />
529<br />
Canada<br />
Netherlands<br />
Switzerland<br />
519<br />
518<br />
522<br />
Germany<br />
515<br />
Measured as PISA scores (points). OECD average = 500.<br />
Source: OECD, 2013<br />
500 510 520 530 540 550<br />
Dutch schoolchildren achieve good scores in the OECD Programme for<br />
International Student Assessment (PISA): fifth place within the OECD and<br />
second in the EU. The PISA survey is conducted every three years among<br />
500,000 school pupils across 70 countries, and evaluates the capacity of<br />
15-year-old schoolchildren to understand and solve academic problems.<br />
Moreover, according to the OECD the Dutch labour force is well equipped<br />
for the dynamic, fast changing IT-society of the 21e century. In comparison<br />
to other OECD countries, Dutch employees have leading positions in<br />
literacy proficiency, numeracy proficiency and proficiency in problem<br />
solving in technology-rich environments.<br />
Human capital and innovation 69
Fourth most prosperous<br />
country<br />
Human Development Index (2014)<br />
Norway<br />
0.9440.971<br />
Australia<br />
0.933<br />
Switzerland<br />
Netherlands<br />
0.917<br />
0.915<br />
United States<br />
Germany<br />
0.911<br />
0.914<br />
New Zealand<br />
Canada<br />
Singapore<br />
Denmark<br />
0.910<br />
0.902<br />
0.901<br />
0.900<br />
0.963<br />
Source: United Nations Development Programme, 2014.<br />
,58 ,69 ,60 ,61 ,62 ,63 ,64 ,65 ,66 ,67 ,68 ,69 ,70 ,71<br />
According to the UNDP, the Netherlands ranks 4th place worldwide with<br />
regard to prosperity. In determining ‘prosperity’, the UNDP takes into<br />
account a country’s GDP as well as other aspects of human well-being,<br />
such as life expectancy, public health, literacy levels and educational<br />
standards. Of the 186 countries listed in the UNDP index, the Netherlands<br />
ranks 4th.<br />
70 Human capital and innovation
Entrepreneurs create<br />
dynamism<br />
Number of entrepreneurs (2009)<br />
Australia<br />
Canada<br />
12.2<br />
1212.3<br />
14.4<br />
Netherlands<br />
Belgium<br />
EU-27<br />
Ireland<br />
United Kingdom<br />
9.9<br />
9.7<br />
11.611.9<br />
11.411.5<br />
11.311.5<br />
11.4<br />
11.4<br />
Germany<br />
Finland<br />
8.8<br />
8.5 9.3<br />
9.8<br />
United States<br />
6.9<br />
9.3<br />
Measured as a percentage of the working population<br />
Source: Statistics Netherlands, 2012.<br />
The Dutch have always been well known for their entrepreneurial spirit,<br />
which is reflected in the country’s large number of entrepreneurs: 11.9%<br />
of the Dutch working population is self-employed. The Dutch government<br />
promotes start-ups because they create economic vitality and innovation<br />
and because they challenge existing firms, giving them the incentive to<br />
adapt and continue to innovate.<br />
Human capital and innovation 71
Worldwide innovation<br />
index: fifth position<br />
Most innovative countries (2014)<br />
Switzerland 64.8<br />
United Kingdom 62.4<br />
Sweden 62.3<br />
Finland 60.7<br />
Netherlands 60.6<br />
United States 60.1<br />
Singapore 59.2<br />
Denmark 57.5<br />
Luxembourg 56.9<br />
Hong Kong, China<br />
56.8<br />
Source: INSEAD, 2014.<br />
The Netherlands scores<br />
4<br />
well<br />
4,1<br />
on<br />
4,2<br />
the Global<br />
4,3 4,4<br />
Innovation<br />
4,5 4,6<br />
Index<br />
4,7(GII) 4,8<br />
2014.<br />
4,9<br />
The GII ranks 143 countries on parameters such as ‘institutions’, ‘human<br />
capacity’ and ‘business sophistication’, so as to arrive at a global innovation<br />
ranking for each country. The Netherlands scores particularly well on<br />
parameters such as ‘knowledge diffusion’, ‘online creativity‘ and ‘creative<br />
goods and services’.<br />
According to the Innovation Union Scoreboard 2015 (IUS) the Netherlands<br />
ranks fifth in the EU (European Commission/UNU-MERIT, 2015). The IUS<br />
distinguishes between 3 main types of indicators (enablers, firm activities<br />
and outputs) and 8 innovation dimensions (as human resources, research<br />
systems, finance and support, intellectual assets), capturing in total 25<br />
different indicators.<br />
72 Human capital and innovation
Source: Layar
Modest R&D<br />
expenditure<br />
R&D expenditure (2013)<br />
Finland<br />
Sweden<br />
Denmark<br />
Germany<br />
Austria<br />
3.32<br />
3.21<br />
2.73.05<br />
2.94 2.7<br />
2.81 2.6<br />
3.7<br />
United States*<br />
2.0<br />
2.81<br />
Belgium<br />
France<br />
1.8<br />
1.9<br />
2.28<br />
2.23<br />
Netherlands<br />
United Kingdom<br />
1.7<br />
1.8<br />
1.63<br />
1.98<br />
Measured as a percentage of GDP<br />
*= 2012<br />
Source: Eurostat, 2015.<br />
1 1,5 2,0 2,5 3,0 3,5 3,8<br />
At 2.16% of GDP, Research & Development expenditure in the Netherlands<br />
is modest from an international perspective (EU-average was 2.07% in<br />
2012). However, this can partly be explained by the Dutch sector structure<br />
because the services sector, which ‘naturally’ has a low R&D intensity,<br />
accounts for a relatively large share of the Dutch economy. Public-private<br />
partnerships in scientific research are a major factor, and the Netherlands<br />
is ranked sixth worldwide in this area, according to the Netherlands<br />
Observatory of Science and Technology (NOWT) (2008).<br />
74 Human capital and innovation
Home-grown knowledge<br />
multinationals<br />
Top 10 innovative Dutch businesses (2014)<br />
R&D expenditure (millions of euros)<br />
R&D personnel (FTE)<br />
ASML<br />
Philips<br />
799.5<br />
4263<br />
742<br />
4013<br />
Royal DSM<br />
NXP<br />
Semiconductors<br />
249<br />
1384<br />
244.2<br />
1486<br />
Thales<br />
Nederland<br />
DAF Trucks<br />
119<br />
717<br />
107.5<br />
884<br />
VDL Groep<br />
Synthon<br />
Friesland<br />
Campina<br />
Rijk Zwaan<br />
83<br />
69.4<br />
212<br />
66<br />
520<br />
65<br />
466<br />
874<br />
*Calculated by TW.<br />
Source: Technisch Weekblad, 2015.<br />
The Dutch economy has a broad and solid base. Leading multinationals<br />
with worldwide operations such as AkzoNobel, ASML, DAF Trucks,<br />
Heineken, NXP Semiconductors, Philips, Shell and Unilever have their<br />
roots in the Netherlands. Dutch industry includes a large number of<br />
innovative and knowledge-intensive companies that enjoy a sound<br />
reputation the world over and that carry out a great deal of R&D<br />
(including the aforementioned multinationals). In addition, there are also<br />
many other global businesses that conduct R&D activities in the<br />
Netherlands, such as Danone, Dow and Yakult.<br />
Human capital and innovation 75
Large base of knowledge<br />
and research<br />
A selection of knowledge and research institutes (2014)<br />
Budget in millions of euros<br />
Personnel in FTE<br />
TNO<br />
ECN<br />
140<br />
550<br />
626.4<br />
3028<br />
Deltares<br />
FOM<br />
NLR<br />
KNMI<br />
MESA +<br />
MARIN<br />
J.M. Burgercentrum<br />
TI Food and<br />
Nutrition<br />
74<br />
104<br />
102<br />
59.1<br />
347<br />
51<br />
42.7<br />
366<br />
30<br />
60<br />
28<br />
177<br />
578<br />
819<br />
1019<br />
643<br />
Source: Technisch Weekblad Special R&D, april 2015.<br />
0 1000 2000 3000 4000<br />
Dutch universities score quite highly for teaching and research in a<br />
number of international rankings (see: www.vsnu.nl). Wageningen<br />
University (WUR), for example, is a global leader in green biotechnology,<br />
and Leiden University leads the way in the biomedical life sciences (see<br />
box). In addition, the Netherlands is also home to a significant number of<br />
renowned knowledge and research institutes such as ECN and TNO, which<br />
play an important role in the government-initiated public-private<br />
innovation programmes.<br />
76 Human capital and innovation
TNO<br />
Organisation for Applied Scientific Research<br />
ECN<br />
Energy Research Centre of the Netherlands<br />
Deltares Institute for Deltatechnology<br />
FOM<br />
Foundation for the Fundamental Research on Matter<br />
NLR<br />
National Aerospace Laboratory<br />
KNMI Royal Netherlands Meteorological Institute<br />
MESA+ Institute for Nanotechnology<br />
MARIN Research Institute in Hydrodynamics and Nautical Research<br />
J.M. Burgers- Research School for Fluid Mechanics<br />
centrum<br />
TI Food and Public private partnership for interdisciplinary research<br />
Nutrition in food and nutrition<br />
Brainport Eindhoven Region is a top technology breeding ground for<br />
innovation and home to world-class businesses, knowledge institutes and<br />
research institutions. The five key target sectors are High Tech Systems &<br />
Materials, Food, Automotive, Lifetec and Design. Brainport Eindhoven<br />
Region is a powerful innovative player in a European and global context. It<br />
accounts for a third of all Dutch private R&D expenditure, and is one of<br />
Europe’s top three regions in terms of patent density. In 2011 the Intelligent<br />
Community Forum declared Brainport the world’s smartest region. In 2012<br />
Fortune magazine suggested that this region could be the new Silicon<br />
Valley.<br />
Energy Valley is the energy cluster in the north of the Netherlands. The<br />
Energy Valley Region is an incubation zone for clean, reliable and innovative<br />
energy. The region is strategically positioned, centrally in the European gas<br />
and power grid, and directly at the North sea with excellent harbour<br />
facilities for transport of raw materials and offshore wind developments.<br />
Companies, knowledge institutes and governments work closely together<br />
to create a sustainable energy economy and new green jobs. Currently<br />
there are over 3,000 companies en 22,500 employees in the Northern<br />
energy cluster.<br />
Human capital and innovation 77
Dutch scientists<br />
frequently cited<br />
Citation impact (2009-2012)<br />
Denmark 1.63<br />
Netherlands 1.6<br />
Switzerland 1.56<br />
United Kingdom<br />
United States<br />
1.49<br />
1.5<br />
Ireland 1.44<br />
Finland 1.44<br />
Norway 1.42<br />
Sweden<br />
Belgium<br />
1.37<br />
1.37<br />
Source: WTI 2 , 2015, data processing: Netherlands Enterprise Agency, 2015.<br />
1,40 1,42 1,44 1,46 1,48 1,50 1,52 1,54 1,56 1,58 1,60 1,62 1,64<br />
The citation impact score is a key indicator of scientific quality.<br />
The score refers to the number of times a scientist is cited by other<br />
scientists. These citations indicate how much they value each other’s<br />
work. The global average citation impact score is ‘1’. Dutch scientists<br />
are cited above the global average and claim third place in the world.<br />
Furthermore, Dutch scientists score highly for joint publications, which is<br />
evidence of the international significance of research taking place in the<br />
Netherlands.<br />
78 Human capital and innovation
Refreshing business<br />
approach<br />
Number of PCT-patent applications (2013)<br />
United States 57,239<br />
Japan 43,918<br />
China 21,516<br />
Germany 17,927<br />
South Korea 12,386<br />
France 7,899<br />
United Kingdom 4,865<br />
Switzerland 4,367<br />
Netherlands 4,198<br />
Sweden<br />
3,960<br />
Source: World Intellectual Property Organisation, 2014.<br />
75 85 95 105 115 125 135 145 155 165 175 185 195 205 210213<br />
PCT (Patent Cooperation Treaty)-patents are patent applications that are<br />
registered with the World Intellectual Property Organisation (WIPO). The<br />
Netherlands is well represented in this area and is ranked ninth in the<br />
world (fourth in the EU). Patents are in many cases the result of R&D<br />
activities which, if successful, can lead to greater labour productivity and<br />
an advantage over foreign competitors. This high score means that Dutch<br />
industry is an attractive potential partner - one that is innovative, inviting<br />
and stimulating.<br />
Human capital and innovation 79
Source: Amsterdam Airport Schiphol
7. Infrastructure<br />
The Netherlands has a number of key logistics<br />
hubs such as the Port of Rotterdam and Schiphol<br />
Airport, as well as a high penetration of broadband<br />
Internet. This provides the country with a sound<br />
physical infrastructure and consequently enables<br />
it to be a top performer in terms of logistics.<br />
81
Navigable inland<br />
waterways<br />
Quality of water transportation (2014)<br />
Netherlands 9.60<br />
Finland 9.10<br />
Iceland 8.98<br />
Denmark 8.97<br />
Germany 8.79<br />
Hong Kong, China 8.72<br />
Singapore 8.72<br />
Sweden 8.62<br />
Canada 8.53<br />
United States 8.37<br />
Harbours, canals, locks, etc.<br />
Source: IMD, 2014.<br />
0 2 4 6 8 9,6<br />
The Netherlands has a good physical infrastructure, with the world-class<br />
(main)ports and the navigable inland waterway system being prime<br />
examples. The extensive network of inland waterways has excellent<br />
connections to the waterways in the rest of Europe. The Netherlands has<br />
the best water transport infrastructure in the world. The country also has<br />
an extensive road transport network and is second in the world as regards<br />
road network density (IMD, 2014). According to IMD (2014), the Dutch<br />
energy infrastructure also scores well, taking second place overall.<br />
82 Infrastructure
Strong in<br />
logistics<br />
Logistics performance index (2014)<br />
Germany 4.12<br />
Netherlands 4.05<br />
Belgium 4.04<br />
United Kingdom 4.01<br />
Singapore 4.00<br />
Sweden 3.96<br />
Norway<br />
3.96<br />
Luxembourg 3.95<br />
United States 3.92<br />
Japan 3.91<br />
Source: World Bank, 2014.<br />
3,8 3,9 4,0 4,1<br />
4,2<br />
The Netherlands’ strong position in terms of logistics is due to the<br />
favourable geographic location of the country, at the heart of Europe;<br />
a sound infrastructure that includes the Port of Rotterdam, the Port of<br />
Amsterdam, Amsterdam Airport Schiphol; and a sophisticated logistics<br />
sector. This is reflected in the World Bank Logistics Performance Index<br />
2014, where the Netherlands is ranked second. The Netherlands came out<br />
on top in terms of the efficiency and effectiveness of its Customs and<br />
other border procedures, the quality of its transport and IT infrastructure<br />
for logistics, the ease of use and affordability of its shipping, and the level<br />
of professionalism in the Dutch logistics industry.<br />
Infrastructure 83
Third-largest airport<br />
in Europe<br />
European airport traffic and transport (2013)<br />
Cargo transport x1,000 tonnes<br />
Passenger transport x1,000 passengers<br />
Frankfurt am Main<br />
Germany<br />
Paris Charles de Gaulle<br />
France<br />
Amsterdam Airport Schiphol<br />
Netherlands<br />
2,016<br />
57,896<br />
1,877<br />
61,985<br />
1,531<br />
52,528<br />
London Heathrow<br />
United Kingdom<br />
1,423<br />
Source: Schiphol Group, 2014.<br />
72,3333<br />
In 2013, Amsterdam Airport Schiphol was Europe’s fourth-largest airport<br />
in terms of passenger numbers and third in cargo volumes, welcoming<br />
52.6 million passengers and processing 1.5 million tonnes of cargo. A<br />
total of 99 airlines offer direct flights from Schiphol to 323 destinations.<br />
This makes Amsterdam Airport Schiphol one of the four most important<br />
Main Ports (or hubs) in Europe. It is also one of the two European home<br />
bases of Air France-KLM and the SkyTeam alliance. In addition, Schiphol<br />
is an important contributor to the regional economy, providing direct<br />
employment for around 65,000 people at the airport. The contribution to<br />
the national economy amounts to around 26 billion euros, and a total of<br />
290,000 jobs nationwide. Schiphol is also renowned for its inspiring<br />
facilities for passengers and innovative technical solutions such as the<br />
extensive baggage handling system. The airport has won over 200<br />
national and international awards since 1980.<br />
84 Infrastructure
Largest port<br />
in Europe<br />
Trans-shipment of goods (2013)<br />
9,743<br />
Trans-shipment (in millions of tonnes)<br />
Containers (in millions of TEU)<br />
Netherlands<br />
Rotterdam<br />
440.5<br />
11.6<br />
Belgium<br />
Antwerp<br />
183.8<br />
8.6<br />
Germany<br />
Hamburg<br />
132.2<br />
Source: Port of Rotterdam, 2014.<br />
9.3<br />
The port of Rotterdam is the largest port in Europe. The trans-shipment<br />
in Rotterdam added up to 440.5 million tons in 2013. The number of<br />
containers handled remained at 11.6 million TEUs in 2013.<br />
Business often choose to locate in and around the Port of Rotterdam<br />
because of its strategic location in north-west Europe, its depth, the<br />
many port facilities, and its excellent links with the hinterland. Many<br />
companies from America and Asia use Rotterdam as their base for the<br />
distribution of goods throughout Europe. Work on the ‘Maasvlakte 2’<br />
project is currently on-going. This historic land reclamation project will<br />
expand the area of the Port of Rotterdam. The first phase will be<br />
completed in 2014, which is when the first containers will cross the quay.<br />
The combined activities of the port account for about 5% of GDP. More<br />
than 90,000 people work directly for the port of Rotterdam.<br />
Infrastructure 85
Source: Hans Kouwenhoven
8. Government<br />
The complex of buildings known as the ‘Binnenhof’<br />
[‘Inner Court’] in The Hague is the seat of the Dutch<br />
government, which enjoys a good international<br />
reputation and functions effectively.<br />
The Netherlands is one of the most stable nations<br />
in the world with a competitive fiscal climate.<br />
Besides, government finances are relatively healthy.<br />
87
Effective<br />
government<br />
Government effectiveness (2013)<br />
Finland 2.2<br />
Singapore 2.1<br />
Denmark 2.0<br />
Norway 1.9<br />
Switzerland 1.9<br />
Canada 1.8<br />
Netherlands 1.8<br />
Sweden 1.8<br />
Liechtenstein 1.7<br />
New Zealand<br />
1.7<br />
Source: World Bank, 2015.<br />
75 85 90 1 2 3 4 5 6 7 8 9 100 1 2 213<br />
According to the World Bank, the government of the Netherlands is<br />
one of the most effective in the world, thus making it easier for<br />
companies to make medium and long-term decisions.<br />
The figures for government effectiveness capture the perceptions of the<br />
quality of public services; the quality of the civil service and the degree<br />
of its independence from political pressures; the quality of policy<br />
formulation and implementation; and the credibility of the<br />
government’s commitment to such policies.<br />
88 Government
One of the least<br />
corrupt countries<br />
Corruption perception index (2014)<br />
Denmark<br />
New Zealand<br />
Finland<br />
Sweden<br />
Norway<br />
Switzerland<br />
Singapore<br />
Netherlands<br />
Luxembourg<br />
Canada<br />
9.4 92.0<br />
9.391.0<br />
9.289.0<br />
9.2 87.0<br />
9.086.0<br />
8.986.0<br />
8.9 84.0<br />
8,783.0<br />
8.7 82.0<br />
8.7 81.0<br />
Source: Transparency International, 2014.<br />
0 10 20 30 40 50 60 70 80 90<br />
According to the Transparency International Corruption Perception Index,<br />
levels of corruption and nepotism in the Netherlands are among the<br />
lowest anywhere in the world. Among the aspects of corruption that were<br />
examined were the degree to which people in authority - such as Customs<br />
officers, police officers, politicians, judges and other officials – misuse<br />
their position for personal gain (financial or otherwise). IMD (2014) also<br />
concludes that bribery and corruption are rare in the Netherlands: the<br />
country ranks sixth worldwide.<br />
Government 89
Moderate level of<br />
government debt<br />
National debt as a percentage of GDP (2013)<br />
Luxembourg<br />
23.1<br />
Sweden<br />
Denmark<br />
40.6<br />
44.5<br />
Finland<br />
57<br />
Netherlands<br />
Austria<br />
Germany<br />
73.5<br />
74.5<br />
78.4<br />
United Kingdom<br />
Euro area<br />
France<br />
90.6<br />
92.6<br />
93.5<br />
Source: Eurostat, 2014.<br />
0 10 20 30 40 50 60 70 80 90<br />
The Netherlands was able to dramatically reduce its level of government<br />
debt in the years preceding the global economic crisis thanks to a stable<br />
economy and a reasonably stringent fiscal policy. In 2008, there was even a<br />
budget surplus for the third consecutive year. In 2014, Dutch government<br />
debt as a percentage of GDP was higher than the EMU standard of 60%<br />
(69.0%), but it was still well below the average for the Euro zone (90.9%).<br />
According to the CPB – Netherlands Bureau for Economic Policy Analysis –<br />
the budget deficit will amount to 1.8% of GDP in 2015 and 1.2% in 2016. The<br />
government debt will amount to 68.8% of GDP in 2015 (EMU-definition)<br />
and 67.8% in 2016 (CPB, March 2015).<br />
90 Government
Competitive<br />
taxation climate<br />
Corporate tax rate on profit 2014 (%)<br />
Ireland 12.5<br />
Finland 20.0<br />
Switzerland 21.2<br />
Sweden 22.0<br />
United Kingdom 23.0<br />
Denmark 24.5<br />
Austria 25.0<br />
Netherlands 25.0<br />
Luxembourg 29.2<br />
Germany 30.2<br />
Source: IMD, 2014.<br />
0 10 20 30 40 50 60 70 79<br />
The corporate income tax rate is 20% on the first 200,000 euros and 25% for<br />
taxable profits exceeding 200,000 euros which is well below the EU<br />
national average. Furthermore, companies can benefit from an effective<br />
tax rate of only 5% for R&D income from self-developed, patented,<br />
intangible assets and also from self-developed, unpatented, intangible<br />
assets which qualify for the WBSO subsidy. Other features of the Dutch tax<br />
system include a wide tax treaty network - the participation exemption -<br />
which states that all benefits related to a qualifying shareholding are<br />
exempt from Dutch corporate income tax, and, finally, a 30% tax-break for<br />
highly qualified foreign employees.<br />
Government 91
Explanatory notes regarding this publication<br />
This publication is intended to provide a concise and representative<br />
picture of the state of the Dutch economy. Every attempt has been<br />
made to carefully and judiciously select indicators from internationally<br />
renowned and reliable sources. In the case of most of the indicators,<br />
the Dutch economy has been compared with surrounding countries and<br />
the United States, many of which are similar in terms of their economic<br />
structures. Comparisons have also been made in a number of cases<br />
with other countries, such as with various worldwide rankings.<br />
92
Sources<br />
Amsterdam Airport Schiphol<br />
www.schipholgroup.nl<br />
The Conference Board<br />
www.conference-board.org<br />
Economist Intelligence Unit<br />
www.eiu.com<br />
European Commission<br />
www.ec.europa.eu<br />
Eurostat<br />
www.epp.eurostat.ec.europa.eu<br />
IMD<br />
www.imd.ch<br />
IMF<br />
www.imf.org<br />
INSEAD<br />
www.globalinnovationindex.org<br />
Ministry of Foreign Affairs<br />
www.government.nl/ministries/bz<br />
Netherlands Bureau for<br />
Economic Policy Analysis<br />
www.cpb.nl<br />
The Netherlands Observatory<br />
of Science and Technology<br />
www.nowt.nl<br />
The Netherlands Organisation<br />
for Applied Scientific Research<br />
www.tno.nl<br />
OECD<br />
www.oecd.org<br />
Port of Rotterdam Authority<br />
www.portofrotterdam.com<br />
Social and Cultural Planning<br />
Office of the Netherlands<br />
www.scp.nl<br />
Statistics Netherlands<br />
www.cbs.nl<br />
Technisch Weekblad<br />
www.technischweekblad.nl<br />
Transparency International<br />
www.transparency.org<br />
UNCTAD<br />
www.unctad.org<br />
United Nations<br />
http://comtrade.un.org/<br />
United Nations Development<br />
Programme<br />
www.hdr.undp.org<br />
World Bank<br />
www.worldbank.org<br />
World Economic Forum<br />
www.weforum.org<br />
World Trade Organization<br />
www.wto.org<br />
93
Other sources of information<br />
More detailed information is available on the websites below,<br />
almost all of which include sections in English.<br />
Information regarding innovation<br />
Benelux Office for<br />
Intellectual Property<br />
www.boip.int<br />
Statistics Netherlands<br />
www.cbs.nl<br />
Ministry of Economic Affairs<br />
www.government.nl/ministries/ez<br />
Netherlands Patent Office<br />
www.agentschapnl.nl/<br />
octrooicentrum<br />
Netherlands Enterprise Agency<br />
www.rvo.nl/innovatie<br />
Trendwatchers for<br />
Innovation and Technology<br />
www.rvo.nl/en/nost<br />
Information regarding the labour market and higher education<br />
http://www.studyinholland.nl/<br />
Statistics Netherlands<br />
www.cbs.nl<br />
Netherlands Bureau for<br />
Economic Policy Analysis<br />
www.cpb.nl<br />
Association of Universities<br />
in the Netherlands<br />
www.vsnu.nl<br />
Netherlands Organization<br />
for International Cooperation<br />
in Higher Education<br />
www.nuffic.nl<br />
Ministry of Social Affairs<br />
and Employment<br />
www.government.nl/ministries/szw<br />
General information about the Netherlands<br />
Ministry of Foreign Affairs<br />
www.government.nl/ministries/bz<br />
Statistics Netherlands<br />
www.cbs.nl<br />
94
Information regarding enterprise (including internationally),<br />
investing and partnerships in the Netherlands<br />
Ministry of Economic Affairs<br />
www.government.nl/ministries/ez<br />
Netherlands Foreign<br />
Investment Agency<br />
www.nfia.nl<br />
Netherlands Enterprise Agency,<br />
focus on sustainability,<br />
innovation and international<br />
www.hollandtradeandinvest.com<br />
www.rvo.nl<br />
Ministry of Finance<br />
www.government.nl/ministries/fin<br />
Statistics Netherlands<br />
www.cbs.nl<br />
Chambers of Commerce<br />
www.kvk.nl<br />
95
Information regarding Top Sectors<br />
Food Tech <strong>Holland</strong><br />
www.foodtechholland.nl<br />
Dutch Federation of<br />
Agriculture and Horticulture<br />
(LTO)<br />
www.lto.nl<br />
Association of the Dutch<br />
Chemical Industry<br />
www.vnci.nl<br />
Dutch Design Fashion<br />
Architecture Programme<br />
(DFA)<br />
www.dutchdfa.com<br />
Dutch export platform for<br />
Dutch clean tech companies<br />
www.cleantechholland.nl<br />
Energy Research Centre of<br />
the Netherlands<br />
www.ecn.nl<br />
Association of Suppliers of<br />
Environmental Technology<br />
www.vlm.fme.nl<br />
<strong>Holland</strong> High Tech Sector<br />
www.hollandhightech.nl<br />
Plantum (Dutch Association<br />
for Plant Propagation<br />
Material)<br />
www.plantum.nl<br />
Dutch Flower Auction<br />
www.floraholland.com<br />
96
Greenport <strong>Holland</strong> (Dutch<br />
Horticultural Association)<br />
www.greenportholland.com<br />
(Dutch only)<br />
Life Sciences and Health<br />
Sector<br />
www.lifescienceshealth.com<br />
<strong>Holland</strong> International<br />
Distribution Council<br />
www.hidc.nl<br />
Port of Rotterdam<br />
www.portofrotterdam.com<br />
Amsterdam Airport Schiphol<br />
www.schipholgroup.com<br />
Dutch Water Sector<br />
www.dutchwatersector.com<br />
Wetsus, Dutch Centre of<br />
Excellence for Sustainable<br />
Water Technology<br />
www.wetsus.nl<br />
<strong>Holland</strong> Shipbuilding<br />
Association<br />
www.hme.nl<br />
The Association of Dutch<br />
Suppliers in the Oil and Gas<br />
Industry (IRO)<br />
www.iro.nl and www.iro-noc.nl<br />
97
Imprint 2015 Edition<br />
This publication, <strong>Holland</strong> <strong>Compared</strong> Cyber Security Special 2015, is<br />
published by the Dutch Ministry of Foreign Affairs. For further information<br />
please contact the Dutch embassy, consulate or Netherlands Business<br />
Support Office in your area, or visit www.hollandtrade.com to learn even<br />
more about Dutch commerce.<br />
Editor-in-Chief<br />
Angelina Helder-Klamer<br />
Economic editor<br />
Ron Hogenboom<br />
Gea Blok (assistant)<br />
English language editor<br />
Jacqueline Meeuwisse<br />
Coordination<br />
Elles van Egmond<br />
Editorial address<br />
<strong>Holland</strong> <strong>Compared</strong><br />
Netherlands Enterprise Agency<br />
Intelligence Unit<br />
P.O. Box 20105<br />
2500 EC The Hague<br />
The Netherlands<br />
Design<br />
Tigges, Voorburg<br />
Copyright<br />
Articles may be reprinted or reproduced only with acknowledgement<br />
of the source: Source: <strong>Holland</strong> <strong>Compared</strong> 2015<br />
No rights may be derived from the contents of this publication.<br />
Photo front, source: Netherlands Enterprise Agency<br />
98
Source: Heerema Marine Contractors Nederland B.V.
Source: Energising the Future
What companies say<br />
about the Netherlands<br />
Strategic location<br />
“Opening a base at Schiphol is an important<br />
strategic move for easyJet. easyJet is already the<br />
second largest airline at Amsterdam - one of<br />
Europe’s leading airports serving a large and<br />
growing aviation market with strong passenger<br />
demand both to and from the Dutch capital.”<br />
EasyJet (UK)<br />
Digital Gateway<br />
“Now, this is just the European Headquarters, but it<br />
is a matter of time before this office will serve as<br />
the headquarters for Africa and the Middle East as<br />
well.”<br />
Netflix (USA)<br />
Superior logistics and technology infrastructure<br />
“Aside from the great infrastructure and the<br />
Netherlands excellent location in Europe, the<br />
Netherlands also appeals to us because of<br />
developments in the fields of smart cities, smart<br />
environments, and smart mobility.”<br />
Huawei (China)<br />
www.hollandtrade.com