

S11
facts&utm_content=27590917&utm_medium=social&utm_source=twitter
facts&utm_content=27590917&utm_medium=social&utm_source=twitter

You also want an ePaper? Increase the reach of your titles
YUMPU automatically turns print PDFs into web optimized ePapers that Google loves.
6 ESG & Corporate Financial Performance Deutsche Asset & Wealth Management<br />
2. Context and parameters of the study<br />
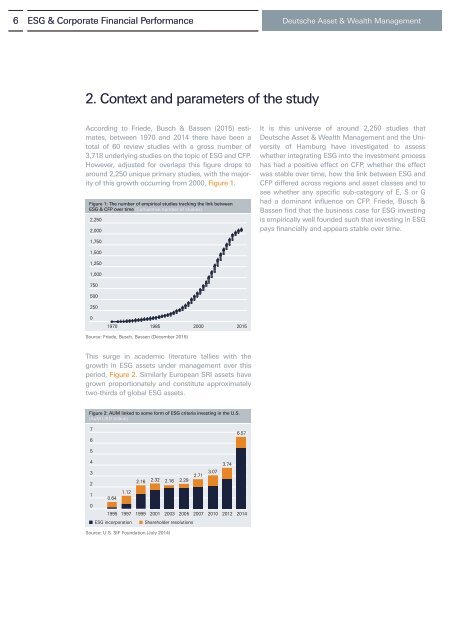
According to Friede, Busch & Bassen (2015) estimates,<br />
between 1970 and 2014 there have been a<br />
total of 60 review studies with a gross number of<br />
3,718 underlying studies on the topic of ESG and CFP.<br />
However, adjusted for overlaps this figure drops to<br />
around 2,250 unique primary studies, with the majority<br />
of this growth occurring from 2000, Figure 1.<br />
Figure 1: The number of empirical studies tracking the link between<br />
ESG & CFP over time (Cumulative number of studies)<br />
2,250<br />
2,000<br />
It is this universe of around 2,250 studies that<br />
Deutsche Asset & Wealth Management and the University<br />
of Hamburg have investigated to assess<br />
whether integrating ESG into the investment process<br />
has had a positive effect on CFP, whether the effect<br />
was stable over time, how the link between ESG and<br />
CFP differed across regions and asset classes and to<br />
see whether any specific sub-category of E, S or G<br />
had a dominant influence on CFP. Friede, Busch &<br />
Bassen find that the business case for ESG investing<br />
is empirically well founded such that investing in ESG<br />
pays financially and appears stable over time.<br />
1,750<br />
1,500<br />
1,250<br />
1,000<br />
750<br />
500<br />
250<br />
0<br />
1970 1985 2000 2015<br />
Source: Friede, Busch, Bassen (December 2015)<br />
This surge in academic literature tallies with the<br />
growth in ESG assets under management over this<br />
period, Figure 2. Similarly European SRI assets have<br />
grown proportionately and constitute approximately<br />
two-thirds of global ESG assets.<br />
Figure 2: AUM linked to some form of ESG criteria investing in the U.S.<br />
(AuM USD trillion)<br />
7<br />
6<br />
6.57<br />
5<br />
4<br />
3.74<br />
3<br />
3.07<br />
2.71<br />
2.16 2.32 2.16 2.29<br />
2<br />
1.12<br />
1<br />
0.64<br />
0<br />
1995 1997 1999 2001 2003 2005 2007 2010 2012 2014<br />
ESG incorporation Shareholder resolutions<br />
Source: U.S. SIF Foundation (July 2014)