

S11
facts&utm_content=27590917&utm_medium=social&utm_source=twitter
facts&utm_content=27590917&utm_medium=social&utm_source=twitter

You also want an ePaper? Increase the reach of your titles
YUMPU automatically turns print PDFs into web optimized ePapers that Google loves.
8 ESG & Corporate Financial Performance Deutsche Asset & Wealth Management<br />
3.2. E, S or G impacts<br />
Another area of interest relates to which of the three<br />
ESG letters has a dominating influence on CFP. For<br />
our sample of vote-count studies with identifiable<br />
ESG categories in 644 studies we find relatively similar<br />
positive results for E, S and G. However, the highest<br />
proportion of positive results occurs in G with<br />
62.3% of all studies delivering a positive correlation,<br />
Figure 5. In a recent Hermes Investment Management<br />
survey of over 100 institutional investors into<br />
responsible capitalism, 90% of those surveyed<br />
believed fund managers should price in corporate<br />
governance risks as a core part of their investment<br />
analysis, alongside financial metrics. This reveals the<br />
increasing awareness of seemingly extra-financial<br />
considerations.<br />
Figure 5: Environmental, social & governance categories<br />
and their relationship to CFP<br />
70%<br />
60%<br />
50%<br />
40%<br />
30%<br />
20%<br />
10%<br />
0%<br />
Positive<br />
58.7%<br />
4.3%<br />
E<br />
Negative<br />
55.1%<br />
Source: Friede, Busch, Bassen (December 2015)<br />
S<br />
5.1%<br />
62.3%<br />
However, governance-related aspects also exhibited<br />
the highest percentage of negative correlations at<br />
9.2%. If the share of negative findings is subtracted<br />
from the positives, environmental studies offer the<br />
most favourable result with social focused studies<br />
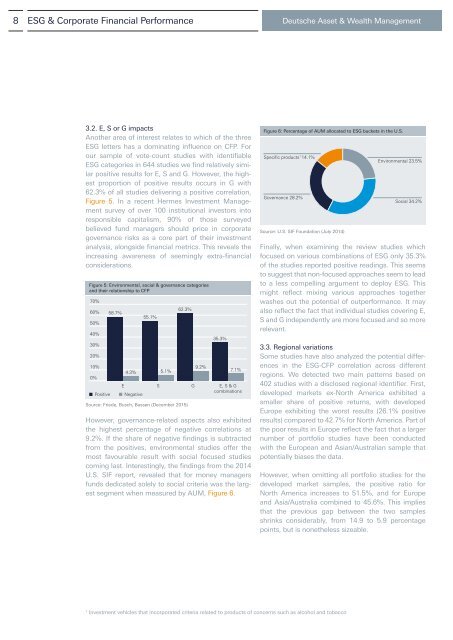
coming last. Interestingly, the findings from the 2014<br />
U.S. SIF report, revealed that for money managers<br />
funds dedicated solely to social criteria was the largest<br />
segment when measured by AUM, Figure 6.<br />
G<br />
9.2%<br />
35.3%<br />
7.1%<br />
E, S & G<br />
combinations<br />
Figure 6: Percentage of AUM allocated to ESG buckets in the U.S.<br />
Specific products 1 14.1%<br />
Governance 28.2%<br />
Source: U.S. SIF Foundation (July 2014)<br />
Environmental 23.5%<br />
Social 34.2%<br />
Finally, when examining the review studies which<br />
focused on various combinations of ESG only 35.3%<br />
of the studies reported positive readings. This seems<br />
to suggest that non-focused approaches seem to lead<br />
to a less compelling argument to deploy ESG. This<br />
might reflect mixing various approaches together<br />
washes out the potential of outperformance. It may<br />
also reflect the fact that individual studies covering E,<br />
S and G independently are more focused and so more<br />
relevant.<br />
3.3. Regional variations<br />
Some studies have also analyzed the potential differences<br />
in the ESG-CFP correlation across different<br />
regions. We detected two main patterns based on<br />
402 studies with a disclosed regional identifier. First,<br />
developed markets ex-North America exhibited a<br />
smaller share of positive returns, with developed<br />
Europe exhibiting the worst results (26.1% positive<br />
results) compared to 42.7% for North America. Part of<br />
the poor results in Europe reflect the fact that a larger<br />
number of portfolio studies have been conducted<br />
with the European and Asian/Australian sample that<br />
potentially biases the data.<br />
However, when omitting all portfolio studies for the<br />
developed market samples, the positive ratio for<br />
North America increases to 51.5%, and for Europe<br />
and Asia/Australia combined to 45.6%. This implies<br />
that the previous gap between the two samples<br />
shrinks considerably, from 14.9 to 5.9 percentage<br />
points, but is nonetheless sizeable.<br />
1<br />
Investment vehicles that incorporated criteria related to products of concerns such as alcohol and tobacco