DOCUMENTO
n?u=RePEc:ioe:doctra:461&r=lam
n?u=RePEc:ioe:doctra:461&r=lam
You also want an ePaper? Increase the reach of your titles
YUMPU automatically turns print PDFs into web optimized ePapers that Google loves.
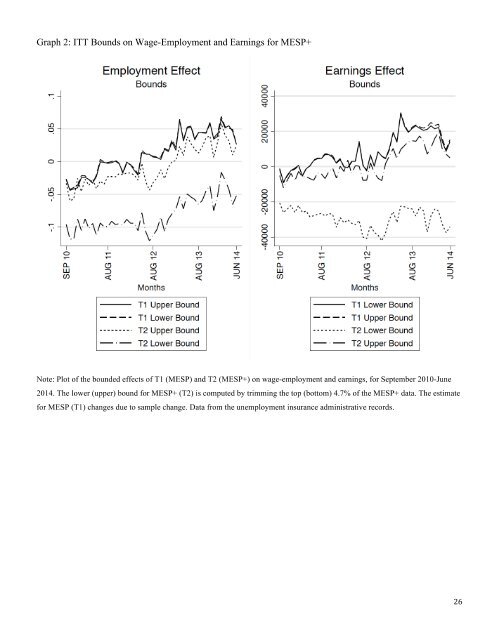
Graph 2: ITT Bounds on Wage-Employment and Earnings for MESP+<br />
Note: Plot of the bounded effects of T1 (MESP) and T2 (MESP+) on wage-employment and earnings, for September 2010-June<br />
2014. The lower (upper) bound for MESP+ (T2) is computed by trimming the top (bottom) 4.7% of the MESP+ data. The estimate<br />
for MESP (T1) changes due to sample change. Data from the unemployment insurance administrative records.<br />
26


