DOCUMENTO
n?u=RePEc:ioe:doctra:461&r=lam
n?u=RePEc:ioe:doctra:461&r=lam

Create successful ePaper yourself
Turn your PDF publications into a flip-book with our unique Google optimized e-Paper software.
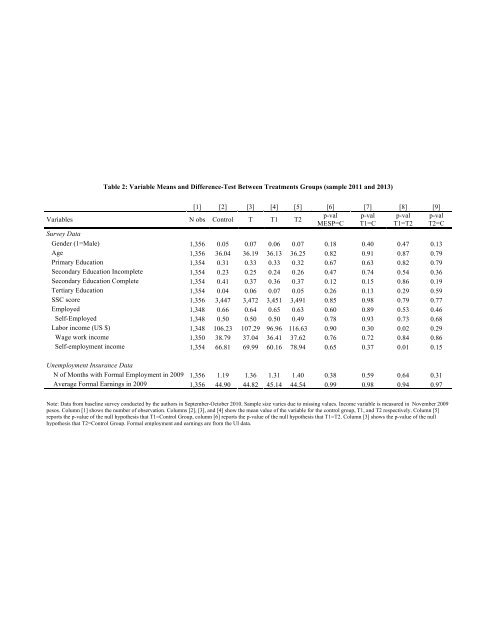
Table 2: Variable Means and Difference-Test Between Treatments Groups (sample 2011 and 2013)<br />
[1] [2] [3] [4] [5] [6] [7] [8] [9]<br />
p-val p-val p-val p-val<br />
Variables N obs Control T T1 T2<br />
MESP=C T1=C T1=T2 T2=C<br />
Survey Data<br />
Gender (1=Male) 1,356 0.05 0.07 0.06 0.07 0.18 0.40 0.47 0.13<br />
Age 1,356 36.04 36.19 36.13 36.25 0.82 0.91 0.87 0.79<br />
Primary Education 1,354 0.31 0.33 0.33 0.32 0.67 0.63 0.82 0.79<br />
Secondary Education Incomplete 1,354 0.23 0.25 0.24 0.26 0.47 0.74 0.54 0.36<br />
Secondary Education Complete 1,354 0.41 0.37 0.36 0.37 0.12 0.15 0.86 0.19<br />
Tertiary Education 1,354 0.04 0.06 0.07 0.05 0.26 0.13 0.29 0.59<br />
SSC score 1,356 3,447 3,472 3,451 3,491 0.85 0.98 0.79 0.77<br />
Employed 1,348 0.66 0.64 0.65 0.63 0.60 0.89 0.53 0.46<br />
Self-Employed 1,348 0.50 0.50 0.50 0.49 0.78 0.93 0.73 0.68<br />
Labor income (US $) 1,348 106.23 107.29 96.96 116.63 0.90 0.30 0.02 0.29<br />
Wage work income 1,350 38.79 37.04 36.41 37.62 0.76 0.72 0.84 0.86<br />
Self-employment income 1,354 66.81 69.99 60.16 78.94 0.65 0.37 0.01 0.15<br />
Unemployment Insurance Data<br />
N of Months with Formal Employment in 2009 1,356 1.19 1.36 1.31 1.40 0.38 0.59 0.64 0.31<br />
Average Formal Earnings in 2009 1,356 44.90 44.82 45.14 44.54 0.99 0.98 0.94 0.97<br />
Note: Data from baseline survey conducted by the authors in September-October 2010. Sample size varies due to missing values. Income variable is measured in November 2009<br />
pesos. Column [1] shows the number of observation. Columns [2], [3], and [4] show the mean value of the variable for the control group, T1, and T2 respectively. Column [5]<br />
reports the p-value of the null hypothesis that T1=Control Group, column [6] reports the p-value of the null hypothesis that T1=T2. Column [3] shows the p-value of the null<br />
hypothesis that T2=Control Group. Formal employment and earnings are from the UI data.