


Create successful ePaper yourself
Turn your PDF publications into a flip-book with our unique Google optimized e-Paper software.
300<br />
250<br />
200<br />
150<br />
100<br />
50<br />
0<br />
3. Key f<strong>in</strong>d<strong>in</strong>gs<br />
England<br />
The key f<strong>in</strong>d<strong>in</strong>g from our research is that <strong>in</strong> total<br />
£22.2 million has been cut from supported bus<br />
fund<strong>in</strong>g <strong>in</strong> England <strong>in</strong> 2015-16. With a £1.6 million<br />
<strong>in</strong>crease <strong>in</strong> spend<strong>in</strong>g by some local authorities, a net<br />
reduction <strong>in</strong> fund<strong>in</strong>g of £20.5 million has been made<br />
to supported bus services <strong>in</strong> England. This is an<br />
8.4 per cent reduction s<strong>in</strong>ce 2014-15. S<strong>in</strong>ce 2010-11<br />
a total of £73.8 million has been cut from supported<br />
bus services <strong>in</strong> England, a reduction of 25 per cent.<br />
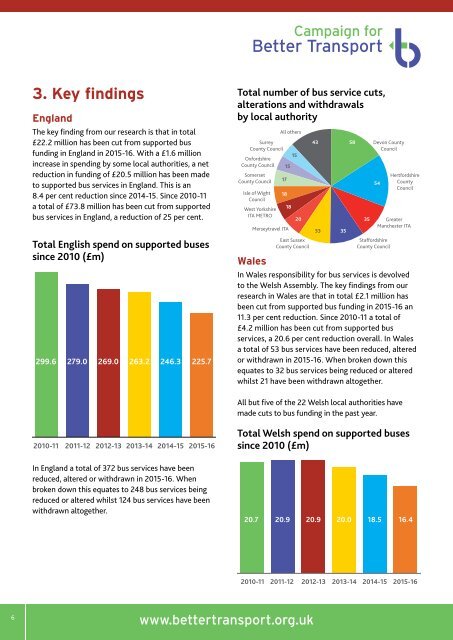
Total English spend on supported buses<br />
s<strong>in</strong>ce 2010 (£m)<br />
299.6 279.0 269.0 263.2 246.3 225.7<br />
2010-11 2011-12 2012-13 2013-14 2014-15 2015-16<br />
Total number of bus service cuts,<br />
alterations and withdrawals<br />
by local authority<br />
Surrey<br />
County Council<br />
Oxfordshire<br />
County Council<br />
Somerset<br />
County Council<br />
Isle of Wight<br />
Council<br />
West Yorkshire<br />
ITA METRO<br />
Wales<br />
Merseytravel ITA<br />
All others<br />
17<br />
18<br />
15<br />
18<br />
15<br />
20<br />
East Sussex<br />
County Council<br />
43<br />
33<br />
35<br />
58<br />
35<br />
Devon County<br />
Council<br />
54<br />
Staffordshire<br />
County Council<br />
Hertfordshire<br />
County<br />
Council<br />
Greater<br />
Manchester ITA<br />
In Wales responsibility for bus services is devolved<br />
to the Welsh Assembly. The key f<strong>in</strong>d<strong>in</strong>gs from our<br />
research <strong>in</strong> Wales are that <strong>in</strong> total £2.1 million has<br />
been cut from supported bus fund<strong>in</strong>g <strong>in</strong> 2015-16 an<br />
11.3 per cent reduction. S<strong>in</strong>ce 2010-11 a total of<br />
£4.2 million has been cut from supported bus<br />
services, a 20.6 per cent reduction overall. In Wales<br />
a total of 53 bus services have been reduced, altered<br />
or withdrawn <strong>in</strong> 2015-16. When broken down this<br />
equates to 32 bus services be<strong>in</strong>g reduced or altered<br />
whilst 21 have been withdrawn altogether.<br />
All but five of the 22 Welsh local authorities have<br />
made cuts to bus fund<strong>in</strong>g <strong>in</strong> the past year.<br />
Total Welsh spend on supported buses<br />
s<strong>in</strong>ce 2010 (£m)<br />
England and Wales<br />
Our research shows that this year 63 per cent of local<br />
authorities <strong>in</strong> England and Wales have cut fund<strong>in</strong>g<br />
for bus services, whilst 44 per cent have reduced or<br />
withdrawn services. S<strong>in</strong>ce 2010-11 over 2,400 bus<br />
services have been reduced, altered or withdrawn<br />
altogether across England and Wales. S<strong>in</strong>ce 2010-11<br />
the total cuts to supported bus services <strong>in</strong> England and<br />
Wales is £78.1 million, a reduction of 25 per cent.<br />
Cuts across England and Wales<br />
2014/15 vs 2015/16 (£m)<br />
18.9<br />
20.4<br />
North<br />
East<br />
55.4<br />
North<br />
West<br />
32.6<br />
53.2 47.0<br />
Yorks &<br />
Humber<br />
17.1<br />
East<br />
Mids<br />
17.5<br />
28.7 25.6<br />
West<br />
Mids<br />
21.3<br />
24.1<br />
East of<br />
England South<br />
East<br />
28.8<br />
50.2<br />
34.8 34.1<br />
South<br />
West<br />
2015-16<br />
2014-15<br />
16.4<br />
20.7<br />
Wales<br />
When compar<strong>in</strong>g the budgets <strong>in</strong> the metropolitan<br />
areas covered by the six Comb<strong>in</strong>ed Authorities/<br />
Passenger Transport Executives (PTEs) 2 and nonmetropolitan<br />
area budgets there are some <strong>in</strong>terest<strong>in</strong>g<br />
results: s<strong>in</strong>ce 2014-15 non-metropolitan areas have<br />
cut <strong>in</strong> total 10.6 per cent from their supported bus<br />
budgets whilst overall metropolitan areas have cut<br />
4.6 per cent. S<strong>in</strong>ce 2010 non-metropolitan areas<br />
have cut 25.3 per cent of bus fund<strong>in</strong>g whereas<br />
metropolitan areas have cut 7.3 per cent of fund<strong>in</strong>g.<br />
Total number of bus service cuts,<br />
alterations and withdrawals by region<br />
North East 5<br />
North West 62<br />
East of England 57<br />
South East 97<br />
South West 84<br />
Wales 53<br />
East Midlands 10<br />
West Midlands 38<br />
North East<br />
North West<br />
Yorkshire &<br />
The Humber<br />
East Midlands<br />
West Midlands<br />
East of England<br />
Yorkshire & the Humber 19<br />
Spend per person 2014/15 to 2015/16<br />
£7.40<br />
£7.30<br />
£8.50<br />
£7.86<br />
£6.36<br />
£6.17<br />
£4.10<br />
£3.76<br />
£3.48<br />
£3.11<br />
£4.06<br />
£3.64<br />
In England a total of 372 bus services have been<br />
reduced, altered or withdrawn <strong>in</strong> 2015-16. When<br />
broken down this equates to 248 bus services be<strong>in</strong>g<br />
reduced or altered whilst 124 bus services have been<br />
withdrawn altogether.<br />
20.7 20.9 20.9 20.0 18.5 16.4<br />
South East<br />
South West<br />
Wales<br />
£4.58<br />
£3.94<br />
£6.04<br />
£5.36<br />
£6.05<br />
£5.36<br />
Spend 2014-15<br />
2010-11 2011-12 2012-13 2013-14 2014-15 2015-16<br />
Spend 2015-16<br />
6<br />
7<br />
www.bettertransport.org.uk www.bettertransport.org.uk