- Page 2 and 3:
C 161 Norges offisielle statistikk
- Page 4 and 5:
Forord Statistisk årbok 1994 inneh
- Page 6 and 7:
Innhold Contents Side Page Tabellre
- Page 8 and 9:
Tabell 33 Antall barn 0-17 år ette
- Page 10 and 11:
Tabell 103 Personer tildelt doktorg
- Page 12 and 13:
Tabell 164 Sysselsatte etter kjønn
- Page 14 and 15:
Tabell 218 Forbruksutgift pr. husho
- Page 16 and 17:
Tabell Side 274 Fiskere og registre
- Page 18 and 19:
Tabell 339 Regnskapsstatistikk for
- Page 20 and 21:
Tabell 395 Hoteller og andre overna
- Page 22 and 23:
Tabell 456 Utlån fra finansinstitu
- Page 24 and 25:
Oversikt over geografiske forhold G
- Page 26 and 27:
NORGIÉ: NORWAÝ" 39' 45° Svalbard
- Page 28 and 29:
29 0 30 70° NORD-NORGE 25° 31° 1
- Page 30 and 31:
NATURRESSURSER OG MILJØ Tabell 1.
- Page 32 and 33:
År og fylke Year and county NATURR
- Page 34 and 35:
NATURRESSURSER OG MILJØ Tabell 7.
- Page 36 and 37:
Tabell 9 (forts.). Meteorologiske f
- Page 38 and 39:
BEFOLKNING 70 50 30 10 Tabell 13. F
- Page 40 and 41:
BEFOLKNING Tabell 17. Folkemengde i
- Page 42 and 43:
BEFOLKNING Tabell 18 (forts.). Area
- Page 44 and 45:
BEFOLKNING Tabell 18 (forts.). Area
- Page 46 and 47:
Tabell 19. Folkemengde etter kjønn
- Page 48 and 49:
BEFOLKNING Statsborgerskap Citizens
- Page 50 and 51:
BEFOLKNING Tabell 24. Utenlandske s
- Page 52 and 53:
BEFOLKNING Tabell 26. Familier ette
- Page 54 and 55:
BEFOLKNING Tabell 29. Andel samboen
- Page 56 and 57:
BEFOLKNING Tabell 33. Antall barn 0
- Page 58 and 59:
Tabell 35. Folkemengdens bevegelse
- Page 60 and 61:
BEFOLKNING Tabell 37. FocRe Births
- Page 62 and 63:
BEFOLKNING År Year Tabell 41. Fød
- Page 64 and 65:
BEFOLKNING Tabell 46. Beregnet ande
- Page 66 and 67:
BEFOLKNING Land Country Tabell 50.
- Page 68 and 69:
BEFOLKNING Year , Tabell 53. Dødsf
- Page 70 and 71:
HELSEFORHOLD OG HELSETJENESTE Tabel
- Page 72 and 73:
HELSEFORHOLD OG HELSETJENESTE Death
- Page 74 and 75:
HELSEFORHOLD OG HELSETJENESTE Tabel
- Page 76 and 77:
HELSEFORHOLD OG HELSETJENESTE Tabel
- Page 78 and 79:
Bostedsfylke County of residence HE
- Page 80 and 81:
HELSEFORHOLD OG HELSETJENESTE Tabel
- Page 82 and 83:
ICD-9 1 460-466 Akutte infeksjoner
- Page 84 and 85:
Tabell 75. Helsepersone11. 1 Fylke.
- Page 86 and 87:
Tabell 80. Nye tilfelle av kreft i
- Page 88 and 89:
HELSEFORHOLD OG HELSETJENESTE Risik
- Page 90 and 91:
UTDANNING OG SKOLEVESEN Skoleslag o
- Page 92 and 93:
UTDANNING OG SKOLEVESEN Tabell 89.
- Page 94 and 95:
Tabell 92. Videregående skoler. 1.
- Page 96 and 97:
UTDANNING OG SKOLEVESEN Tabell 95.
- Page 98 and 99:
UTDANNING OG SKOLEVESEN Tabell 98.
- Page 100 and 101:
UTDANNING OG SKOLEVESEN Tabell 101.
- Page 102 and 103:
UTDANNING OG SKOLEVESEN Tabell 104.
- Page 104 and 105:
KULTURELLE FORHOLD OG TIDSBRUK Tabe
- Page 106 and 107:
KULTURELLE FORHOLD OG TIDSBRUK Tabe
- Page 108 and 109:
KULTURELLE FORHOLD OG TIDSBRUK Kapa
- Page 110 and 111:
KULTURELLE FORHOLD OG TIDSBRUK Tabe
- Page 112 and 113:
KULTURELLE FORHOLD OG TIDSBRUK Tabe
- Page 114 and 115:
SOSIALE FORHOLD OG SOSIALVESEN Tabe
- Page 116 and 117:
SOSIALE FORHOLD OG SOSIALVESEN Tabe
- Page 118 and 119:
Fylke County Stønadstilfelle med
- Page 120 and 121:
SOSIALE FORHOLD OG SOSIALVESEN Tabe
- Page 122 and 123:
År Year Tabell 145. Pleie- og omso
- Page 124 and 125:
RETTSFORHOLD OG RETTSVESEN Tabell 1
- Page 126 and 127:
RETTSFORHOLD OG RETTSVESEN Tabell 1
- Page 128 and 129:
Kjønn År Alder Sex Year Age RETTS
- Page 130 and 131:
TTSFORHOLO OG S ESEN Tabell 156 (fo
- Page 132 and 133:
ARBEIDSKRAFT Tabell 159. Personer i
- Page 134 and 135:
ARBEIDSKRAFT Tabell 163. Sysselsatt
- Page 136 and 137:
Tabell 167. Arbeidssokere uten arbe
- Page 138 and 139:
ARBEIDSKRAFT Tabell 170. Lønnstake
- Page 140 and 141:
Nr. Yrke Tabell 172 (forts.). Sysse
- Page 142 and 143:
ARBEIDSKRAFT Tabell 175. Andel ansa
- Page 144 and 145:
Næring Industry Tabell 178. Arbeid
- Page 146 and 147:
ARBEIDSKRAFT Tabell 182. Yrkesorgan
- Page 148 and 149:
ARBEIDSKRAFT Tabell 184. Arbeidstak
- Page 150 and 151:
LØNNSFORHOLD Tabell 187. Timefortj
- Page 152 and 153:
LØNNSFORHOLD Tabell 190. Månedsfo
- Page 154 and 155:
LØNNSFORHOLD Tabell 193. Månedsfo
- Page 156 and 157:
LØNNSFORHOLD Tabell 196. Månedsfo
- Page 158 and 159:
Etat og stilling LONNSFORHOLD Tabel
- Page 160 and 161:
LØNNSFORHOLD Tabell 198 (forts.).
- Page 162 and 163:
PERSONLIG INNTEKT OG FORMUE Tabell
- Page 164 and 165:
PERSONLIG INNTEKT .OG'FORMUE Tabell
- Page 166 and 167:
PERSONLIG • INNTEKTOG .FORMUE •
- Page 168 and 169:
PERSONLIG INNTEKT OG FORMUE Tabell
- Page 170 and 171:
PERSONLIG INNTEKT OG FORMUE Tabell
- Page 172 and 173:
PERSONLIG INNTEKT OG FORMUE Tabell
- Page 174 and 175:
PERSONLIG FORBRUK År Year Tabell 2
- Page 176 and 177:
PERSONLIG FORBRUK Tabell 216. Indek
- Page 178 and 179:
PERSONLIG FORBRUK Tabell 216 (forts
- Page 180 and 181:
PERSONLIG FORBRUK Tabell 217. Forbr
- Page 182 and 183:
Tabell 220. Forbruksutgift pr. hush
- Page 184 and 185:
BOLIGER OG BOFORHOLD Tabell 223. Be
- Page 186 and 187:
BOLIGER OG BOFORHOLD Tabell 227. Pr
- Page 188 and 189:
NÆRINGSVIRKSOMHET GENERELT Tabell
- Page 190 and 191:
JORDBRUK OG SKOGBRUK Tabell 232. Jo
- Page 192 and 193:
JORDBRUK OG SKOGBRUK Tabell 234. Ar
- Page 194 and 195:
JORDBRUK OG SKOGBRUK Tabell 237. Ve
- Page 196 and 197:
JORDBRUK OG SKOGBRUK Tabell 240. Hu
- Page 198 and 199:
Tabell 245. Husdyrprodukter til sal
- Page 200 and 201:
JORDBRUK OG SKOGBRUK Tabell 250. Av
- Page 202 and 203:
Tabell 254. Jordbrukets prisindeks.
- Page 204 and 205: JORDBRUK OG SKOGBRUK Tabell 258. Re
- Page 206 and 207: JORDBRUK OG SKOGBRUK Tabell 260. B
- Page 208 and 209: JORDBRUK OG SKOGBRUK Tabell 263. Av
- Page 210 and 211: Tabell 266. Skogkultur, skogreising
- Page 212 and 213: JORDBRUK OG SKOGBRUK Tabell 270. Sk
- Page 214 and 215: FISKE OG FANGST År Year I alt Tota
- Page 216 and 217: FISKE OG FANGST Fiskeslag Species T
- Page 218 and 219: FISKE OG FANGST Tabell 280. Selfang
- Page 220 and 221: Tabell 283. Driftsresultater for he
- Page 222 and 223: OLJEUTVINNING, BERGVERKSDRIFT, INDU
- Page 224 and 225: OLJEUTVINNING, BERGVERKSDRIFT, INDU
- Page 226 and 227: OLJEUTVINNING, BERGVERKSDRIFT, INDU
- Page 228 and 229: OLJEUTVINNING, BERGVERKSDRIFT, INDU
- Page 230 and 231: OLJEUTVINNING, BERGVERKSDRIFT, INDU
- Page 232 and 233: OLJEUTVINNING, BERGVERKSDRIFT, INDU
- Page 234 and 235: OLJEUTVINNING, BERGVERKSDRIFT, INDU
- Page 236 and 237: • :.:OLJEUTVINNING..:..:B.ERGVERK
- Page 238 and 239: OLJEUTVINNING BERGVERKSDRIFT, INDUS
- Page 240 and 241: Olje Gass Olje Felt/blokk Mill. Sm
- Page 242 and 243: OLJEUTVINNING, BERGVERKSDRIFT, INDU
- Page 244 and 245: OLJEUTVINNING BERGVERKSDRIFT, INDUS
- Page 246 and 247: .OLJEUTVINNING.BERGVERKSDRIFTINDUST
- Page 248 and 249: OLJEUTVINNING, BERGVERKSDRIFT, INDU
- Page 250 and 251: ' OLJEUTVINNING, BERGVERKSDRIFT, IN
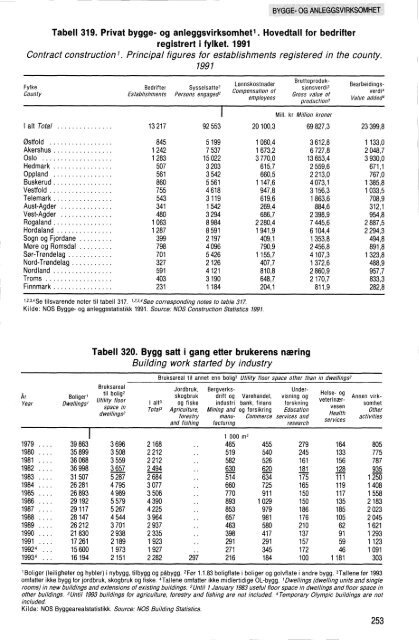
- Page 252 and 253: BYGGE- OG ANLEGGSVIRKSOMHET Tabell
- Page 256 and 257: BYGGE- OG ANLEGGSVIRKSOM Tabell 323
- Page 258 and 259: UTENRIKSHANDEL Tabell 328. Innførs
- Page 260 and 261: T',...UTENR1KSHANDEL Tabell 331. In
- Page 262 and 263: UTENRIKSHANDEL Tabell 331 (forts.).
- Page 264 and 265: UTENRIKSHANDEL Tabell 331 (forts.).
- Page 266 and 267: UTENRIKSHANDEL Tabell 331 (forts.).
- Page 268 and 269: Vare UTENRIKSHANDEL Tabell 332 (for
- Page 270 and 271: Vare UTENRIKSHANDEL Tabell 332 (for
- Page 272 and 273: Imports and exports, by countries a
- Page 274 and 275: UTENRIKSHANDEL Imports and exports,
- Page 276 and 277: Tabell 334. Innforsels- og ufforsel
- Page 278 and 279: Land Tabell 334 (forts.). Innforsel
- Page 280: Land Tabell 334 (forts.). Innforsel
- Page 283 and 284: VAREHANDEL Næringshovedgruppe Tabe
- Page 285 and 286: VAREHANDEL Tabell 336 (forts.). Var
- Page 287 and 288: VAREHANDEL Tabell 339. Regnskapssta
- Page 289 and 290: VAREHANDEL Tabell 340. Regnskapssta
- Page 291 and 292: VAREHANDEL Detaljhandel i alt Retai
- Page 293 and 294: VAREHANDEL Varesort Commodity Tabel
- Page 295 and 296: VAREHANDEL Tabell 347. Tinglyste om
- Page 297 and 298: SAMFERDSEL OG REISELIV Tabell 351.
- Page 299 and 300: SAMFERDSEL OG REISELIV Tabell 356.
- Page 301 and 302: SAMFERDSEL OG REISELIV Tabell 360.
- Page 303 and 304: SAMFERDSEL OG REISELIV Tabell 363.
- Page 305 and 306:
SAMFERDSEL OG REISELIV Tabell 367.
- Page 307 and 308:
SAMFERDSEL OG REISELIV Tabell 368.
- Page 309 and 310:
SAMFERDSEL OG REISELIV Tabell 369 (
- Page 311 and 312:
SAMFERDSEL OG REISELIV Fylke County
- Page 313 and 314:
SAMFERDSEL OG REISELIV Tabell 376.
- Page 315 and 316:
SAMFERDSEL OG REISELIV Tabell 379.
- Page 317 and 318:
SAMFERDSEL OG REISELIV Tabell 383.
- Page 319 and 320:
SAMFERDSEL OG REISELIV Tabell 386.
- Page 321 and 322:
SAMFERDSEL OG REISELIV Tabell 390.
- Page 323 and 324:
SAMFERDSEL OG REISELIV Tabell 393.
- Page 325 and 326:
SAMFERDSEL OG REISELIV Tabell 396.
- Page 327 and 328:
SAMFERDSEL OG REISELIV Tabell 400.
- Page 329 and 330:
SAMFERDSEL OG REISELIV Tabell 404.
- Page 331 and 332:
TJENESTEYTING Tabell 407. Forretnin
- Page 333 and 334:
TENESTEYTING Tabell 410. Bilverkste
- Page 335 and 336:
TJENESTEYTING Tabell 413. Fotografv
- Page 337 and 338:
NASJONALREGNSKAP Tabell 416. Privat
- Page 339 and 340:
NASJONALREGNSKAP Tabell 418. Brutto
- Page 341 and 342:
NASJONALREGNSKAP Tabell 420. Lønns
- Page 343 and 344:
NASJONALREGNSKAP Tabell 423. Hushol
- Page 345 and 346:
NASJONALREGNSKAP Tabell 427. Brutto
- Page 347 and 348:
NASJONALREGNSKAP Tabell 429. Privat
- Page 349 and 350:
NASJONALREGNSKAP Tabell 430 (forts.
- Page 351 and 352:
NASJONALREGNSKAP Tabell 432. Utenri
- Page 353 and 354:
NASJONALREGNSKAP Tabell 434. Import
- Page 355 and 356:
NASJONALREGNSKAP Tabell 436. Realka
- Page 357 and 358:
OFFENTLIG FORVALTNING Tabell 438. O
- Page 359 and 360:
OFFENTLIG FORVALTNING Tabell 441. O
- Page 361 and 362:
OFFENTLIG FORVALTNING Tabell 441 (f
- Page 363 and 364:
OFFENTLIG FORVALTNING Tabell 442. S
- Page 365 and 366:
OFFENTLIG FORVALTNING Tabell 443 (f
- Page 367 and 368:
OFFENTLIG FORVALTNING Tabell 445. F
- Page 369 and 370:
OFFENTLIG FORVALTNING Tabell 448. K
- Page 371 and 372:
13 CI El I ITITIVin FINANSINSTITUSJ
- Page 373 and 374:
FINANSINSTITUSJONER, PENGER OG KRED
- Page 375 and 376:
FINANSINSTITUSJONER, PENGER OG KRED
- Page 377 and 378:
FINANSINSTITUSJONER, PENGER OG KRED
- Page 379 and 380:
FINANSINSTITUSJONER, PENGER OG KRED
- Page 381 and 382:
▪ FINANSINSTITUSJONER, PENGER OG
- Page 383 and 384:
FINANSINSTITUSJONER, PENGER OG KRED
- Page 385 and 386:
FINANSINSTITUSJONER, PENGER OG KRED
- Page 387 and 388:
FINANSINSTITUSJONER, PENGER OG KRED
- Page 389 and 390:
FINANSINSTITUSJONER, PENGER OG KRED
- Page 391 and 392:
FINANSINSTITUSJONER, PENGER OG KRED
- Page 393 and 394:
FINANSINSTITUSJONER, PENGER OG KRED
- Page 395 and 396:
ADMINISTRATIVE OG POLITISKE EMNER F
- Page 397 and 398:
ADMINISTRATIVE OG POLITISKE EMNER T
- Page 399 and 400:
ADMINISTRATIVE OG POLITISKE EMNER T
- Page 401 and 402:
ADMINISTRATIVE OG POLITISKE EMNER T
- Page 403 and 404:
SVALBARD Tabell 491. Svalbard. Post
- Page 405 and 406:
INTERNASJONALE OVERSIKTER Tabell 49
- Page 407 and 408:
INTERNASJONALE OVERSIKTER Tabell 49
- Page 409 and 410:
INTERNASJONALE OVERSIKTER Land Tabe
- Page 411 and 412:
INTERNASJONALE OVERSIKTER Land Tabe
- Page 413 and 414:
INTERNASJONALE OVERSIKTER Land og b
- Page 415 and 416:
INTERNASJONALE OVERSIKTER Tabell 50
- Page 417 and 418:
INTERNASJONALE OVE RS IKTE R Tabell
- Page 419 and 420:
INTERNASJONALE OVERSIKTER Tabell 50
- Page 421 and 422:
INTERNASJONALE OVERSIKTER Tabel 502
- Page 423 and 424:
INTERNASJONALE OVERSIKTER Tabell 50
- Page 425 and 426:
INTERNASJONALE OVERSIKTER Norge 1 9
- Page 427 and 428:
INTERNASJONALE OVERSIKTER Land Tabe
- Page 429 and 430:
INTERNASJONALE OVERSIKTER Tabell 50
- Page 431 and 432:
INTERNASJONALE OVERSIKTER Tabell 50
- Page 433 and 434:
INTERNASJONALE OVERSIKTER Tabell 51
- Page 435 and 436:
INTERNASJONALE OVERSIKTER Land Area
- Page 437 and 438:
INTERNASJONALE OVERSIKTER Land Tabe
- Page 439 and 440:
INTERNASJONALE OVERSIKTER Tabell 51
- Page 441 and 442:
INTERNASJONALE OVERSIKTER Varesort
- Page 443 and 444:
INTERNASJONALE OVERSIKTER Tabell 51
- Page 445 and 446:
INTERNASJONALE OVERSIKTER Varesort
- Page 447 and 448:
INTER NASJONALE OVERSIKTER Varesort
- Page 449 and 450:
INTERNASJONALE OVERSIKTER Tabell 51
- Page 451 and 452:
.H INTERNASJONALE OVERSIKTER Innfø
- Page 453 and 454:
INTERNASJONALE OVERSIKTER Tabell 52
- Page 455 and 456:
INTERNASJONALE OVERSIKTER Tabell 52
- Page 457 and 458:
INTERNASJONALE OVERSIKTER Tabell 52
- Page 459 and 460:
INTERNASJONALE OVERSIKTER Tabell 52
- Page 461 and 462:
INTERNASJONALE OVERSIKTER Tabell 52
- Page 463 and 464:
INTERNASJONALE OVERSIKTER Tabell 52
- Page 465 and 466:
INTERNASJONALE OVERSIKTER Tabell 53
- Page 467 and 468:
INTERNASJONALE OVERSIKTER Land Tabe
- Page 469 and 470:
INTERNASJONALE OVERSIKTER Selskapen
- Page 471 and 472:
INTERNASJONALE Tabell 540. Nasjonal
- Page 473 and 474:
INTERNASJONALE OVERSIKTER Tabell 54
- Page 475 and 476:
RNASJONALE Land Tabell 546. Interna
- Page 477 and 478:
INTERNASJONALE OVERSIKTER Tabell 55
- Page 480 and 481:
Alfabetisk sakregister A Administra
- Page 482 and 483:
Industrifunksjonærer, lønn 192 In
- Page 484:
Teforbruk 513 Telefon, tilgang til
- Page 487 and 488:
Education rates 88 Education, time
- Page 489 and 490:
Potato crop 250 Precipitation 9 Pre
- Page 491 and 492:
Publikasjoner sendt ut fra Statisti
- Page 493 and 494:
32. Arbeidskraft Labour Arbeidsmark
- Page 495 and 496:
47. Tjenesteyting Services Forretni
- Page 497 and 498:
NATURMILJØET I TALL 1994 - et nytt