Development
Raichur-DHDR-English-2014
Raichur-DHDR-English-2014

You also want an ePaper? Increase the reach of your titles
YUMPU automatically turns print PDFs into web optimized ePapers that Google loves.
Raichur District Human <strong>Development</strong> Report 2014<br />
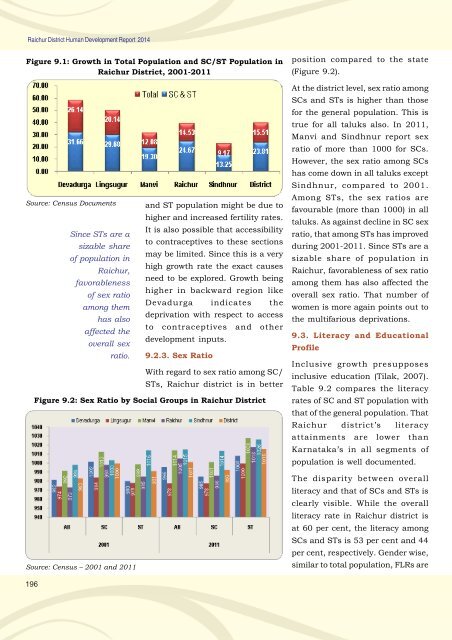
Figure 9.1: Growth in Total Population and SC/ST Population in<br />
Raichur District, 2001-2011<br />
Source: Census Documents<br />
Since STs are a<br />
sizable share<br />
of population in<br />
Raichur,<br />
favorableness<br />
of sex ratio<br />
among them<br />
has also<br />
affected the<br />
overall sex<br />
ratio.<br />
and ST population might be due to<br />
higher and increased fertility rates.<br />
It is also possible that accessibility<br />
to contraceptives to these sections<br />
may be limited. Since this is a very<br />
high growth rate the exact causes<br />
need to be explored. Growth being<br />
higher in backward region like<br />
Devadurga indicates the<br />
deprivation with respect to access<br />
to contraceptives and other<br />
development inputs.<br />
9.2.3. Sex Ratio<br />
With regard to sex ratio among SC/<br />
STs, Raichur district is in better<br />
Figure 9.2: Sex Ratio by Social Groups in Raichur District<br />
Source: Census – 2001 and 2011<br />
position compared to the state<br />
(Figure 9.2).<br />
At the district level, sex ratio among<br />
SCs and STs is higher than those<br />
for the general population. This is<br />
true for all taluks also. In 2011,<br />
Manvi and Sindhnur report sex<br />
ratio of more than 1000 for SCs.<br />
However, the sex ratio among SCs<br />
has come down in all taluks except<br />
Sindhnur, compared to 2001.<br />
Among STs, the sex ratios are<br />
favourable (more than 1000) in all<br />
taluks. As against decline in SC sex<br />
ratio, that among STs has improved<br />
during 2001-2011. Since STs are a<br />
sizable share of population in<br />
Raichur, favorableness of sex ratio<br />
among them has also affected the<br />
overall sex ratio. That number of<br />
women is more again points out to<br />
the multifarious deprivations.<br />
9.3. Literacy and Educational<br />
Profile<br />
Inclusive growth presupposes<br />
inclusive education (Tilak, 2007).<br />
Table 9.2 compares the literacy<br />
rates of SC and ST population with<br />
that of the general population. That<br />
Raichur district’s literacy<br />
attainments are lower than<br />
Karnataka’s in all segments of<br />
population is well documented.<br />
The disparity between overall<br />
literacy and that of SCs and STs is<br />
clearly visible. While the overall<br />
literacy rate in Raichur district is<br />
at 60 per cent, the literacy among<br />
SCs and STs is 53 per cent and 44<br />
per cent, respectively. Gender wise,<br />
similar to total population, FLRs are<br />
196