Development
Raichur-DHDR-English-2014
Raichur-DHDR-English-2014

You also want an ePaper? Increase the reach of your titles
YUMPU automatically turns print PDFs into web optimized ePapers that Google loves.
Urban Issues in Human <strong>Development</strong><br />
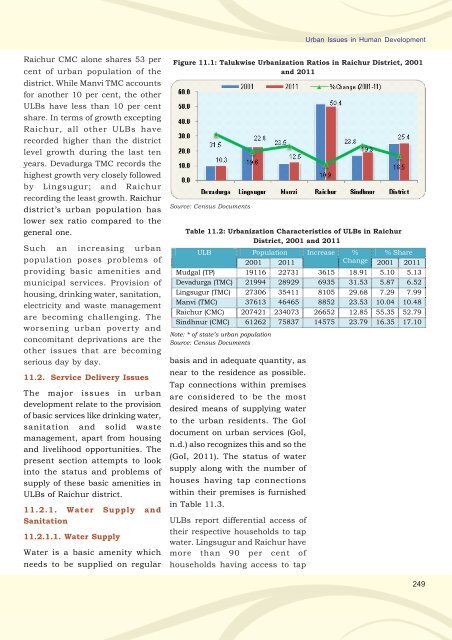
Raichur CMC alone shares 53 per<br />
cent of urban population of the<br />
district. While Manvi TMC accounts<br />
for another 10 per cent, the other<br />
ULBs have less than 10 per cent<br />
share. In terms of growth excepting<br />
Raichur, all other ULBs have<br />
recorded higher than the district<br />
level growth during the last ten<br />
years. Devadurga TMC records the<br />
highest growth very closely followed<br />
by Lingsugur; and Raichur<br />
recording the least growth. Raichur<br />
district’s urban population has<br />
lower sex ratio compared to the<br />
general one.<br />
Such an increasing urban<br />
population poses problems of<br />
providing basic amenities and<br />
municipal services. Provision of<br />
housing, drinking water, sanitation,<br />
electricity and waste management<br />
are becoming challenging. The<br />
worsening urban poverty and<br />
concomitant deprivations are the<br />
other issues that are becoming<br />
serious day by day.<br />
11.2. Service Delivery Issues<br />
The major issues in urban<br />
development relate to the provision<br />
of basic services like drinking water,<br />
sanitation and solid waste<br />
management, apart from housing<br />
and livelihood opportunities. The<br />
present section attempts to look<br />
into the status and problems of<br />
supply of these basic amenities in<br />
ULBs of Raichur district.<br />
11.2.1. Water Supply and<br />
Sanitation<br />
11.2.1.1. Water Supply<br />
Water is a basic amenity which<br />
needs to be supplied on regular<br />
Figure 11.1: Talukwise Urbanization Ratios in Raichur District, 2001<br />
and 2011<br />
Source: Census Documents<br />
Table 11.2: Urbanization Characteristics of ULBs in Raichur<br />
District, 2001 and 2011<br />
ULB Population Increase % % Share<br />
2001 2011 Change 2001 2011<br />
Mudgal (TP) 19116 22731 3615 18.91 5.10 5.13<br />
Devadurga (TMC) 21994 28929 6935 31.53 5.87 6.52<br />
Lingsugur (TMC) 27306 35411 8105 29.68 7.29 7.99<br />
Manvi (TMC) 37613 46465 8852 23.53 10.04 10.48<br />
Raichur (CMC) 207421 234073 26652 12.85 55.35 52.79<br />
Sindhnur (CMC) 61262 75837 14575 23.79 16.35 17.10<br />
Note: * of state’s urban population<br />
Source: Census Documents<br />
basis and in adequate quantity, as<br />
near to the residence as possible.<br />
Tap connections within premises<br />
are considered to be the most<br />
desired means of supplying water<br />
to the urban residents. The GoI<br />
document on urban services (GoI,<br />
n.d.) also recognizes this and so the<br />
(GoI, 2011). The status of water<br />
supply along with the number of<br />
houses having tap connections<br />
within their premises is furnished<br />
in Table 11.3.<br />
ULBs report differential access of<br />
their respective households to tap<br />
water. Lingsugur and Raichur have<br />
more than 90 per cent of<br />
households having access to tap<br />
249