COMMUNICATION IN THE WORLD OF APPS
Yi8Qn
Yi8Qn

Create successful ePaper yourself
Turn your PDF publications into a flip-book with our unique Google optimized e-Paper software.
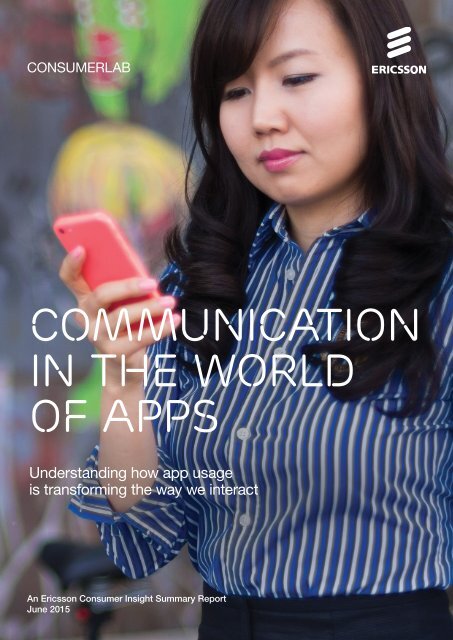
CONSUMERLAB<br />
<strong>COMMUNICATION</strong><br />
<strong>IN</strong> <strong>THE</strong> <strong>WORLD</strong><br />
<strong>OF</strong> <strong>APPS</strong><br />
Understanding how app usage<br />
is transforming the way we interact<br />
An Ericsson Consumer Insight Summary Report<br />
June 2015
contents<br />
3 <strong>THE</strong> FUTURE <strong>OF</strong> <strong>IN</strong>TERACTION<br />
4 ALWAYS ON<br />
6 CULTURAL VARIATION<br />
7 CLASSIFY<strong>IN</strong>G COMMUNICATORS<br />
8 EXPLOR<strong>IN</strong>G NEW <strong>APPS</strong><br />
9 RICHER <strong>COMMUNICATION</strong>S<br />
11 CIRCLES <strong>OF</strong> <strong>COMMUNICATION</strong><br />
Methodology<br />
This report presents research into<br />
app usage behavior using on-device<br />
measurements across several markets,<br />
with a particular focus on how messaging<br />
and social media apps influence the way<br />
we communicate – now and in the future.<br />
The research sample represents Android<br />
smartphone users in India, Japan,<br />
South Korea, the UK, and the US.<br />
Prospective panelists were recruited by<br />
email, through partner companies or via<br />
online/mobile advertising. Data was<br />
collected by Nielsen in 2014.<br />
COUNTRY<br />
<strong>IN</strong>DIA<br />
JAPAN<br />
SOUTH KOREA<br />
UK<br />
US<br />
Sample size<br />
7,500 Android users<br />
1,800 Android users<br />
7,500 Android users<br />
3,000 Android users<br />
4,000 Android users<br />
Representation<br />
100 million<br />
Android users<br />
25.2 million<br />
Android users<br />
29.3 million<br />
Android users<br />
20.7 million<br />
Android users<br />
94.6 million<br />
Android users<br />
the voice of the consumer<br />
Ericsson ConsumerLab has 20 years’ experience of studying<br />
people’s behaviors and values, including the way they act and think<br />
about ICT products and services. Ericsson ConsumerLab provides<br />
unique insights on market and consumer trends.<br />
Ericsson ConsumerLab gains its knowledge through a global<br />
consumer research program based on interviews with<br />
100,000 individuals each year, in more than 40 countries and<br />
15 megacities – statistically representing the views of 1.1 billion<br />
people. Both quantitative and qualitative methods are used, and<br />
hundreds of hours are spent with consumers from different cultures.<br />
To be close to the market and consumers, Ericsson ConsumerLab<br />
has analysts in all regions where Ericsson is present, developing a<br />
thorough global understanding of the ICT market and business models.<br />
All reports can be found at:<br />
www.ericsson.com/consumerlab<br />
2 ERICSSON CONSUMERLAB <strong>COMMUNICATION</strong> <strong>IN</strong> <strong>THE</strong> <strong>WORLD</strong> <strong>OF</strong> <strong>APPS</strong>
The future of<br />
interaction<br />
In this report, we aim to explain how people<br />
communicate today in the world of apps, and<br />
what the future will look like as technology<br />
continues to develop to accommodate our needs.<br />
Through messaging and social media, keeping<br />
in touch with those around us has never been<br />
easier – even with those we see infrequently.<br />
From smartphone user personalities to cultural<br />
variations, we examine the differing ways that<br />
today’s users relate to communication apps.<br />
Key findings<br />
Communication continues<br />
to be the dominant activity<br />
on smartphones<br />
> Although smartphones have<br />
a wide range of functions,<br />
more than 30 percent of<br />
time spent using them is<br />
on communication apps<br />
(US, UK and India)<br />
Communication apps are<br />
‘always on’ and are a key driver<br />
of mobile broadband usage<br />
> Communication apps are<br />
accessed most frequently<br />
and have a higher dependence<br />
on mobile broadband.<br />
Around 40-50 percent<br />
of data consumption for<br />
communication apps<br />
happens when using mobile<br />
broadband, whereas the<br />
corresponding figure for<br />
video apps is only around<br />
20 percent<br />
Different people use<br />
communication apps differently<br />
> Although there is a pioneer<br />
app communicator group who<br />
are heavy users of both social<br />
networking and chat apps,<br />
24 percent of smartphone<br />
users in the US predominantly<br />
use social networking,<br />
whereas 12 percent are<br />
more focused on chat apps<br />
Culture and language<br />
influence communication<br />
patterns and adoption of<br />
communication apps<br />
> British and American<br />
users make more voice<br />
calls, while Japanese and<br />
South Korean users prefer<br />
texting. Communication apps<br />
developed with a local flavor,<br />
for example Line and KakaoTalk,<br />
are very popular in Japan and<br />
South Korea respectively<br />
There is growing interest<br />
in visual communication apps<br />
with built-in privacy and<br />
accessibility features<br />
> Instagram and Pinterest,<br />
whose core offering is<br />
visual communication, have<br />
witnessed 20 and 60 percent<br />
growth respectively compared<br />
to 2014. The growing popularity<br />
of Snapchat shows consumers’<br />
preference for visual apps with<br />
built-in privacy<br />
There is high interest among<br />
consumers for human-like<br />
communications with machines<br />
> 1 in 2 smartphone users<br />
across 10 major cities<br />
would consider getting a<br />
robot to teach them how<br />
to use new technology. It<br />
remains to be seen how<br />
humans will communicate<br />
with devices and robots in<br />
different ways in the future<br />
ERICSSON CONSUMERLAB <strong>COMMUNICATION</strong> <strong>IN</strong> <strong>THE</strong> <strong>WORLD</strong> <strong>OF</strong> <strong>APPS</strong> 3
Always on<br />
Communication first<br />
Smartphones are replacing a variety of specialized<br />
devices. Among the myriad activities that you<br />
can carry out on smartphones, communication 1<br />
remains dominant, as illustrated in Figure 1.<br />
Respondents from the US and UK are more<br />
likely to communicate using their smartphones,<br />
compared to those from Japan and South Korea,<br />
who place equal importance on browsing and<br />
productivity tools, respectively.<br />
Figure 1: Percentage of time spent using different<br />
smartphone app categories (not including SMS)<br />
11<br />
14<br />
7<br />
11<br />
India<br />
10<br />
47<br />
6<br />
18<br />
16 20<br />
Japan<br />
26<br />
14<br />
21<br />
19<br />
South<br />
Korea<br />
17<br />
6<br />
28<br />
9<br />
6<br />
22<br />
18<br />
UK<br />
15<br />
30<br />
9<br />
8<br />
13<br />
20<br />
US<br />
13<br />
30<br />
16<br />
Source: Ericsson ConsumerLab, Communication in the world of apps, 2015<br />
Base: Android users in India, Japan, South Korea, the UK and the US<br />
Communication<br />
Games<br />
Entertainment<br />
Utility and productivity tools<br />
Browsing<br />
Other<br />
Communication is the<br />
dominant activity carried<br />
out on smartphones<br />
1<br />
Mobile communication encompasses everything from voice calls and SMS to instant messaging (IM),<br />
email and social networking. The data in this analysis applies to Android users only.<br />
4 ERICSSON CONSUMERLAB <strong>COMMUNICATION</strong> <strong>IN</strong> <strong>THE</strong> <strong>WORLD</strong> <strong>OF</strong> <strong>APPS</strong>
Reliance on mobile broadband<br />
Aside from traditional classification, smartphone<br />
apps can be classified based on two main factors.<br />
These are the average number of times the app<br />
is accessed – known as session frequency – and<br />
also the app’s dependence on mobile broadband<br />
versus Wi-Fi, as explained in Figure 2.<br />
Communication apps fall within the ‘always on’<br />
category. Consumers want constant access to<br />
them and use them frequently, which means they<br />
often rely on having mobile broadband coverage,<br />
especially when outdoors or on the move.<br />
Figure 2: App category classification<br />
Social networking<br />
Leisure time<br />
300<br />
Always on<br />
> May not be<br />
data-intensive<br />
> Usually accessed<br />
from the comfort<br />
of home<br />
250<br />
200<br />
Games<br />
IM/VoIP<br />
> Notification-based<br />
> Driven by fear<br />
of missing out<br />
(FOMO)<br />
Average number of times used<br />
in a month<br />
150<br />
100<br />
50<br />
Google Play<br />
Video<br />
Email<br />
Other entertainment<br />
Commerce/shopping<br />
News<br />
Music<br />
Search<br />
Finance<br />
Maps<br />
0<br />
Can postpone<br />
> Use can be<br />
postponed until<br />
cost-effective and<br />
stable connection<br />
is available<br />
10% 20% 30% 40% 50%<br />
Cannot wait<br />
> Need or time-based<br />
> Driven by the need<br />
for instant feedback<br />
Proportion of total data sent via mobile broadband rather than Wi-Fi<br />
Source: Ericsson ConsumerLab, Communication in the world of apps, 2015<br />
Base: Android users in India, Japan, South Korea, the UK and the US<br />
ERICSSON CONSUMERLAB <strong>COMMUNICATION</strong> <strong>IN</strong> <strong>THE</strong> <strong>WORLD</strong> <strong>OF</strong> <strong>APPS</strong> 5
CULTURAL VARIATION<br />
Figure 3: Percentage of time spent using different smartphone<br />
communication app categories<br />
Voice call<br />
Voice calling and instant messaging<br />
Social networking<br />
Email<br />
21<br />
11<br />
2<br />
6<br />
26<br />
1<br />
11<br />
21<br />
India<br />
42<br />
Japan<br />
51<br />
South<br />
Korea<br />
47<br />
25<br />
UK<br />
53<br />
US<br />
14 53<br />
66<br />
26<br />
1<br />
11<br />
12<br />
Source: Ericsson ConsumerLab, Communication in the world of apps, 2015<br />
Base: Android users in India, Japan, South Korea, the UK and the US<br />
Figure 4: Percentage of respondents using the top 5 apps<br />
in the voice calling and instant messaging app categories<br />
at least once a month<br />
India<br />
WhatsApp Messenger<br />
Hike<br />
Facebook Messenger<br />
Google+ Hangouts<br />
WeChat<br />
Japan<br />
L<strong>IN</strong>E<br />
Google+ Hangouts 11%<br />
Facebook Messenger 7%<br />
2chMate 7%<br />
Skype 6%<br />
44%<br />
37%<br />
32%<br />
26%<br />
62%<br />
98%<br />
East versus west<br />
In Japan and South Korea, local communication<br />
apps are particularly popular. American and<br />
British users also make relatively more voice<br />
calls, whereas Japanese and South Korean<br />
users prefer to text. This behavior demonstrates<br />
the influence culture has on communication.<br />
Another aspect that could influence the way people<br />
communicate is the communication plans offered by<br />
service providers. For example, unlimited voice calls in<br />
the US encourage this way of communicating. Japan<br />
has a pronounced email culture, likely influenced by<br />
the fact that SMS was not standardized in Japanese<br />
systems for some time. 1 in 4 Japanese smartphone<br />
users do not make traditional voice calls anymore.<br />
South Korea<br />
KakaoTalk<br />
L<strong>IN</strong>E 15%<br />
mypeople Messenger 5%<br />
NateOn UC 5%<br />
Between 3%<br />
UK<br />
WhatsApp Messenger<br />
Facebook Messenger<br />
Google+ Hangouts<br />
22%<br />
Snapchat<br />
18%<br />
Skype<br />
17%<br />
54%<br />
53%<br />
92%<br />
Language and culture shapes popularity<br />
Figure 4 shows that largely English-speaking<br />
countries (US, UK and India) are more likely<br />
to adopt communication apps developed<br />
for an English audience. These countries<br />
follow a similar pattern – although WhatsApp<br />
Messenger doesn’t feature highly in the US.<br />
In Japan and South Korea, local players L<strong>IN</strong>E and<br />
KakaoTalk dominate the communication app market.<br />
L<strong>IN</strong>E has become very popular due to its emoticons.<br />
The pattern of usage in these countries is unique,<br />
and these apps appeal to the cultural palate.<br />
US<br />
Facebook Messenger<br />
Google+ Hangouts<br />
Snapchat<br />
Skype<br />
Kik Messenger<br />
24%<br />
14%<br />
12%<br />
9%<br />
37%<br />
Source: Ericsson ConsumerLab, Communication in the world of apps, 2015<br />
Base: Android users in India, Japan, South Korea, the UK and the US<br />
Japanese smartphone<br />
users do not make<br />
1 in 4 traditional voice calls<br />
6 ERICSSON CONSUMERLAB <strong>COMMUNICATION</strong> <strong>IN</strong> <strong>THE</strong> <strong>WORLD</strong> <strong>OF</strong> <strong>APPS</strong>
CLASSIFY<strong>IN</strong>G<br />
COMMUNICATORS<br />
Smartphone users have evolved their behavior<br />
from using their phones just for voice calls and<br />
texting, to being more interested in social networking<br />
and voice calling and instant messaging apps (VoIP<br />
and IM apps). Due to this, a multitude of online<br />
personalities have emerged. Figure 5 depicts the<br />
5 main communicator personalities in the US – from<br />
traditional to heavier users.<br />
The pattern of communicator personalities in India<br />
and the UK is similar to the US. However, in Japan<br />
and South Korea, the proportion of conversationalists<br />
is higher than that of social networkers, owing to the<br />
fact that IM and VoIP apps are more popular than social<br />
networking apps.<br />
Figure 5: Smartphone communicator personalities<br />
9%<br />
Traditionalist<br />
44%<br />
Casual<br />
24%<br />
Social<br />
networker<br />
12%<br />
Conversationalist<br />
11%<br />
Pioneer app<br />
communicator<br />
Traditionalists use<br />
older and more<br />
established means of<br />
communication such<br />
as voice calls or SMS.<br />
They do not use any<br />
of the communication<br />
apps looked at<br />
in this report.<br />
They are present<br />
across age<br />
groups, but are<br />
overrepresented<br />
among retirees and<br />
the over-50s.<br />
Casuals are light users of<br />
social networking or IM<br />
and VoIP apps – or both.<br />
They are present<br />
across age groups, but<br />
are overrepresented<br />
among over-45s. On<br />
average, 10 minutes<br />
per day are spent on<br />
social networking,<br />
whereas less than<br />
30 minutes per month<br />
are spent on chat apps.<br />
Social networkers are<br />
heavy users of social<br />
networking apps, but<br />
don’t use VoIP and<br />
IM apps as much.<br />
They are present<br />
across age groups, but<br />
are overrepresented<br />
among females. On<br />
average, 1.5 hours<br />
per day are spent on<br />
social networking.<br />
Conversationalists are<br />
heavy users of IM and<br />
VoIP apps, but are less<br />
frequent users of social<br />
networking apps.<br />
They are overrepresented<br />
in the 13-24 age bracket<br />
as well as among<br />
students, males and the<br />
unmarried. On average,<br />
30 minutes per day are<br />
spent communicating<br />
via chat apps.<br />
Pioneer app<br />
communicators are<br />
highly active both on<br />
social networks and<br />
communication apps.<br />
They are overrepresented<br />
in the 21-30 age<br />
bracket and especially<br />
among students and<br />
the unmarried. On<br />
average, 2 hours per<br />
day are spent on<br />
social networking, and<br />
40 minutes per day are<br />
spent communicating<br />
via chat apps.<br />
Source: Ericsson ConsumerLab, Communication in the world of apps, 2015<br />
Base: Android users in the US<br />
ERICSSON CONSUMERLAB <strong>COMMUNICATION</strong> <strong>IN</strong> <strong>THE</strong> <strong>WORLD</strong> <strong>OF</strong> <strong>APPS</strong> 7
EXPLOR<strong>IN</strong>G NEW <strong>APPS</strong><br />
The app loyalty divide<br />
There are certain factors that foster loyalty to apps,<br />
and others that encourage openness to new ones.<br />
Key factors that drive loyalty to communication<br />
apps include ease of use and popularity among<br />
friends and peers. On the other hand, attractive<br />
and compelling features in new apps can disrupt<br />
legacy applications and encourage openness.<br />
Certain apps may begin to lose their charm for younger<br />
people as they become more mainstream – especially<br />
if their parents begin using them, for example.<br />
Endless choice<br />
There has been an explosion in the number of<br />
apps available, and users are intrigued by this.<br />
However, many of these apps do not satisfy the<br />
discerning smartphone user – hence opening<br />
doors for newer and more evolved apps.<br />
Figure 6: Likelihood of exploring new apps<br />
Likely to explore social networking apps<br />
Likely to explore IM and VoIP apps<br />
33%<br />
41%<br />
Casual<br />
Conversationalist<br />
73%<br />
Social networker<br />
78%<br />
45%<br />
Pioneer app<br />
communicator<br />
Total<br />
7%<br />
46%<br />
Casual<br />
Conversationalist<br />
13%<br />
Social networker<br />
55%<br />
Pioneer app<br />
communicator<br />
17%<br />
Total<br />
Heavy users of social networking apps are more likely<br />
to explore the social networking app space for newer<br />
options. By contrast, heavy users of IM and VoIP apps<br />
are more likely to explore communication apps.<br />
Source: Ericsson ConsumerLab, Communication in the world of apps, 2015<br />
Base: Android users in the US<br />
The figure above shows the proportion of respondents in each<br />
segment who use three or more apps in the social networking<br />
category, as well as in the IM and VoIP app categories, respectively.<br />
Our conclusion is that smartphone users who use three or more<br />
apps for a specific app category are more likely to explore new apps,<br />
since they do not feel that their socializing and communication needs<br />
are met by just two apps.<br />
8 ERICSSON CONSUMERLAB <strong>COMMUNICATION</strong> <strong>IN</strong> <strong>THE</strong> <strong>WORLD</strong> <strong>OF</strong> <strong>APPS</strong>
Richer Communications<br />
The way we use technology to communicate is<br />
constantly evolving, mirroring the innate habits of<br />
human communication.<br />
Looking ahead, communication apps are likely to<br />
evolve to become more appealing, instinctive and<br />
seamless. With the increasing digital footprint,<br />
users are more likely to value on-demand<br />
privacy and security in communication apps.<br />
We have already started to see early signs of these<br />
features being implemented in communication apps.<br />
1 in 3<br />
users agrees that sharing photos online is a<br />
good way to stay connected with friends<br />
Instinctive response<br />
Communication apps are likely to evolve to a state<br />
where communicating with each other digitally<br />
becomes natural, like human interactions.<br />
Figure 7: Percentage of smartphone users who have accessed<br />
Instagram and Pinterest throughout the year<br />
The word ‘selfie’ was added to dictionaries in 2013,<br />
and in 2014 selfie sticks emerged. In an Ericsson<br />
ConsumerLab survey of smartphone users in the US<br />
in 2014, 1 in 4 were willing to pay for a service<br />
offering that includes unlimited image shares without<br />
incurring any data charges. Apps like Instagram<br />
and Pinterest promote a ‘click and share’ culture.<br />
Apps such as Yo and Taptalk enable users to converse<br />
with just a tap, without typing or speaking. The stickers<br />
in chat apps like L<strong>IN</strong>E and KakaoTalk are so popular that<br />
they are being monetized. 40 percent believe that within<br />
a year, smartwatches that can send light pressure to<br />
mimic touch will become mainstream.<br />
25%<br />
11%<br />
Instagram<br />
Pinterest<br />
Oct<br />
2013<br />
27%<br />
15%<br />
Jan<br />
2014<br />
29%<br />
14%<br />
Apr<br />
2014<br />
31% 30%<br />
15%<br />
Jul<br />
2014<br />
18%<br />
Oct<br />
2014<br />
Consumers also anticipate that we will soon see<br />
advances in instinctive communication technology<br />
beyond the way humans currently communicate.<br />
Source: Ericsson ConsumerLab, Comscore USA, 2014-2015<br />
Base: 14,000 respondents, smartphone users who use the internet daily<br />
In an Ericsson ConsumerLab survey of smartphone<br />
users in major cities in 2014, 70 percent believed that by<br />
2020, devices that interpret brainwaves and allow you<br />
to communicate via thought will become common.<br />
ERICSSON CONSUMERLAB <strong>COMMUNICATION</strong> <strong>IN</strong> <strong>THE</strong> <strong>WORLD</strong> <strong>OF</strong> <strong>APPS</strong> 9
Seamless and uninterrupted<br />
Future digital communication will become more fluid<br />
and continuous – uninterrupted across devices,<br />
platforms and network connection types. This is<br />
particularly important in alleviating users’ fear<br />
of missing out (FOMO). They want the option to<br />
communicate at all times, from any place or device.<br />
40 percent of smartphone users across 10 cities<br />
claimed that smartphone notifications for meetings,<br />
activities, status updates and messages help them<br />
to be on top of things.<br />
Figure 8: Percentage of US smartphone users who<br />
accessed Facebook and Snapchat throughout the<br />
year in the age group of 18-34<br />
81%<br />
28%<br />
77%<br />
31% 31%<br />
75% 74%<br />
28%<br />
Facebook<br />
Snapchat<br />
70%<br />
34%<br />
Hike offers a feature that allows the user to chat with<br />
friends even when they are offline by sending the<br />
message as an SMS, at no cost to the user. When they<br />
reply, the message appears in Hike. Twitter has latched<br />
onto consumers’ FOMO too, with a new feature called<br />
‘While you were away’, which puts together a recap<br />
of important tweets tailored to the individual user.<br />
On-demand privacy<br />
The past year has seen a gradual decrease in<br />
Facebook usage in the US, especially among the<br />
18-34 age category. Due to Facebook’s popularity,<br />
especially among parents, overexposure could lead<br />
to privacy concerns for the younger generation. Some<br />
feel that they can be tracked, while some don’t like<br />
to be tagged in photos and posts by their parents.<br />
Jan<br />
2014<br />
Apr<br />
2014<br />
Jul<br />
2014<br />
Oct<br />
2014<br />
Source: Ericsson ConsumerLab, Comscore USA, 2014-2015<br />
Base: 14,000 respondents, smartphone users who use the internet daily<br />
Jan<br />
2015<br />
Figure 8 illustrates Facebook’s reach compared to that<br />
of Snapchat across one year, for the 18-34 age bracket<br />
in the US. It shows us that while Facebook’s reach is<br />
decreasing, Snapchat has gained in popularity owing<br />
to its transient nature.<br />
The images sent via Snapchat disappear within a few<br />
seconds, so users don’t have to worry about their digital<br />
footprint. Facebook, on the other hand, can store images<br />
for years once posted. In an Ericsson ConsumerLab<br />
survey of smartphone users in major cities in 2014,<br />
21 percent of smartphone users fear that embarrassing<br />
photos of them posted online will never be forgotten.<br />
10 ERICSSON CONSUMERLAB <strong>COMMUNICATION</strong> <strong>IN</strong> <strong>THE</strong> <strong>WORLD</strong> <strong>OF</strong> <strong>APPS</strong>
CIRCLES <strong>OF</strong><br />
<strong>COMMUNICATION</strong><br />
The circles of communication concept is based on the<br />
idea that the people we communicate with can be<br />
imagined as circles surrounding us. Close friends<br />
and family are the closest to us, and form the inner<br />
circle. Distant friends and relatives form the outer<br />
circle. Figure 9 compares the circles of communication<br />
today with how they could look in the future.<br />
Shrinking the gaps<br />
The use of social networking and chat apps is shrinking<br />
the gaps between the circles of communication, bringing<br />
them closer together. It is now easier to stay in touch with<br />
friends and acquaintances.<br />
The new circle of communication<br />
New aspects of communication are evolving as<br />
technology develops. Consumers today have<br />
started to have human-like communications with<br />
non-humans, like smart assistants, robots and smart<br />
devices, creating a new circle of communication.<br />
In a study across 10 major cities, 1 in 2 smartphone<br />
users believed that smart assistants that you can talk<br />
to for advice and ask to make reservations will become<br />
mainstream in a year. 48 percent of smartphone users<br />
said they would consider getting a robot to teach them<br />
how to use new technology, and 1 in 3 would consider<br />
keeping a robot for company.<br />
Figure 9: Evolving circles of communication<br />
New circle of communication<br />
Communication with smart assistants,<br />
robots and smart devices<br />
Shrinking gap between circles<br />
Present<br />
user<br />
future<br />
user<br />
Inner circle: Close friends and immediate family<br />
Friends: School and college friends, office colleagues and relatives<br />
Acquaintances: People known slightly; not close friends<br />
Outer circle: Distant friends and distant relatives<br />
Source: Ericsson ConsumerLab, Journey to the third place, 2003<br />
Ericsson ConsumerLab, Communication in the world of apps, 2015<br />
Our research shows that among smartphone users in<br />
New York, 14 percent already use a wearable activity<br />
wristband. 2 Could wearables soon evolve from mere<br />
tracking devices to generate meaningful insights and<br />
advice for users?<br />
It remains to be seen if the technology will reach a<br />
stage where wearables, along with other futuristic<br />
devices, also start to engage in human-like<br />
communications with consumers.<br />
2<br />
Ericsson ConsumerLab, 10 Hot Consumer Trends 2015<br />
ERICSSON CONSUMERLAB <strong>COMMUNICATION</strong> <strong>IN</strong> <strong>THE</strong> <strong>WORLD</strong> <strong>OF</strong> <strong>APPS</strong> 11
Ericsson is the driving force behind the Networked Society – a world leader in<br />
communications technology and services. Our long-term relationships with every major<br />
telecom operator in the world allow people, business and society to fulfill their potential<br />
and create a more sustainable future.<br />
Our services, software and infrastructure – especially in mobility, broadband and the<br />
cloud – are enabling the telecom industry and other sectors to do better business,<br />
increase efficiency, improve the user experience and capture new opportunities.<br />
With approximately 115,000 professionals and customers in 180 countries, we combine<br />
global scale with technology and services leadership. We support networks that connect<br />
more than 2.5 billion subscribers. Forty percent of the world’s mobile traffic is carried<br />
over Ericsson networks. And our investments in research and development ensure that<br />
our solutions – and our customers – stay in front.<br />
Founded in 1876, Ericsson has its headquarters in Stockholm, Sweden. Net sales in<br />
2014 were SEK 228.0 billion (USD 33.1 billion). Ericsson is listed on NASDAQ OMX stock<br />
exchange in Stockholm and the NASDAQ in New York.<br />
The content of this document is subject to revision without<br />
notice due to continued progress in methodology, design and<br />
manufacturing. Ericsson shall have no liability for any error or<br />
damage of any kind resulting from the use of this document.<br />
Ericsson<br />
SE-126 25 Stockholm, Sweden<br />
Telephone +46 10 719 00 00<br />
www.ericsson.com<br />
EAB-15:024601 Uen<br />
© Ericsson AB 2015