Key performance indicators (PDF) - Xstrata
Key performance indicators (PDF) - Xstrata
Key performance indicators (PDF) - Xstrata

You also want an ePaper? Increase the reach of your titles
YUMPU automatically turns print PDFs into web optimized ePapers that Google loves.
38 | Business review: strategy<br />
<strong>Key</strong> <strong>performance</strong> <strong>indicators</strong> continued<br />
Non-financial key<br />
<strong>performance</strong> <strong>indicators</strong><br />
In addition to monitoring the Group’s<br />
financial <strong>performance</strong>, as a measure<br />
of the Company’s <strong>performance</strong> against<br />
its objectives, <strong>Xstrata</strong>’s Board also<br />
regularly monitors a range of nonfinancial<br />
KPIs to assess <strong>performance</strong><br />
against sustainable development<br />
targets and strategic objectives.<br />
<strong>Xstrata</strong>’s Board sets and overviews the<br />
Group’s industry-leading Sustainable<br />
Development (SD) Framework. The<br />
SD Framework has been mapped to<br />
international standards and comprises<br />
<strong>Xstrata</strong>’s Statement of Business<br />
Principles, SD Policy, SD Standards<br />
and Assurance Programme.<br />
<strong>Xstrata</strong> operates a highly devolved<br />
management model. Each commodity<br />
business is responsible for the<br />
implementation of the Group’s SD<br />
Framework throughout its business.<br />
Performance against the SD Framework<br />
is reviewed and evaluated on a quarterly<br />
basis by the commodity businesses and<br />
progress reported to the Board’s Health,<br />
Safety, Environment and Community<br />
Committee. The Committee benchmarks<br />
<strong>Xstrata</strong>’s <strong>performance</strong> against other<br />
mining and extractive sector companies.<br />
The KPIs that relate to the SD Framework<br />
include safety, environmental incidents,<br />
water and energy usage, employee<br />
turnover, training, and support for<br />
community initiatives, and are regularly<br />
reported to <strong>Xstrata</strong>’s Board, Executive<br />
Committee and senior management. The<br />
Group’s internal audit programme also<br />
examines health, safety, environment,<br />
ethical and community risks.<br />
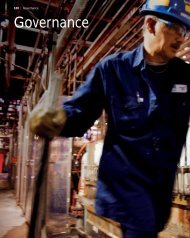
Safety<br />
(Injury frequency rate)<br />
We are committed to providing a<br />
safe workplace and believe that every<br />
work-related incident, illness and injury<br />
is preventable.<br />
In 2010, three people (two contractors and<br />
one employee) lost their lives at <strong>Xstrata</strong>’s<br />
managed operations in South Africa<br />
(2009: nine people). We value the safety of<br />
contractors in exactly the same way as our<br />
employees. We monitor the <strong>performance</strong> of<br />
all contractors and insist on full compliance<br />
with our safety standards and procedures.<br />
All of our sites implement regular and<br />
appropriate behaviour-based training,<br />
with emphasis on the identification and<br />
management of major hazards. Our<br />
managers work with their supervisors and<br />
operators in the field to identify appropriate<br />
topics to be covered in daily team talks and<br />
safety training.<br />
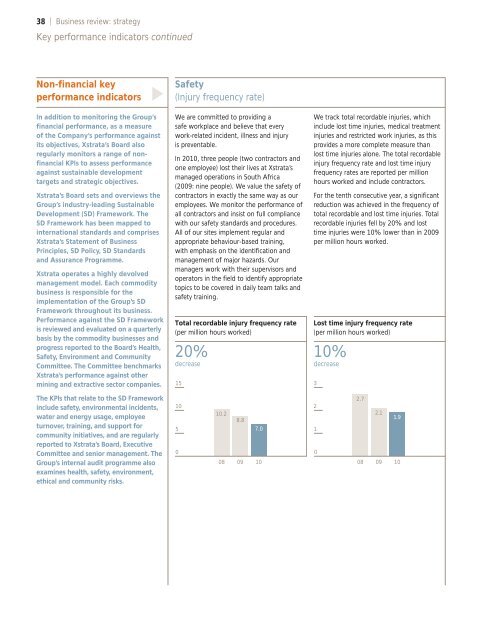
Total recordable injury frequency rate<br />
(per million hours worked)<br />
20%<br />
decrease<br />
15<br />
10<br />
5<br />
0<br />
10.2<br />
08<br />
8.8<br />
09<br />
7.0<br />
10<br />
We track total recordable injuries, which<br />
include lost time injuries, medical treatment<br />
injuries and restricted work injuries, as this<br />
provides a more complete measure than<br />
lost time injuries alone. The total recordable<br />
injury frequency rate and lost time injury<br />
frequency rates are reported per million<br />
hours worked and include contractors.<br />
For the tenth consecutive year, a significant<br />
reduction was achieved in the frequency of<br />
total recordable and lost time injuries. Total<br />
recordable injuries fell by 20% and lost<br />
time injuries were 10% lower than in 2009<br />
per million hours worked.<br />
Lost time injury frequency rate<br />
(per million hours worked)<br />
10%<br />
decrease<br />
3<br />
2<br />
1<br />
0<br />
2.7<br />
08<br />
2.1<br />
09<br />
1.9<br />
10