Key performance indicators (PDF) - Xstrata
Key performance indicators (PDF) - Xstrata
Key performance indicators (PDF) - Xstrata

Create successful ePaper yourself
Turn your PDF publications into a flip-book with our unique Google optimized e-Paper software.
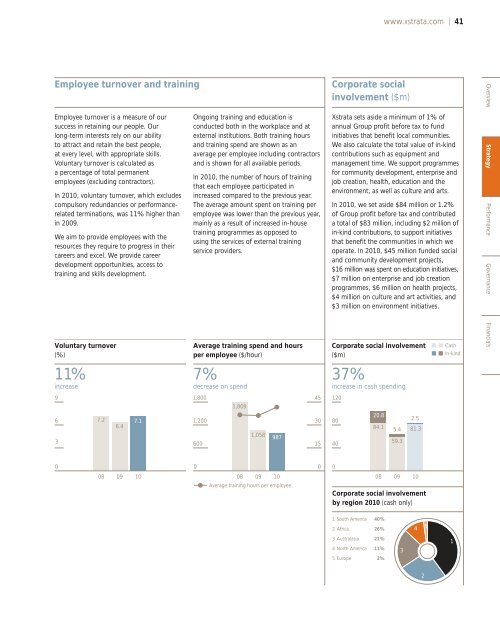
Employee turnover and training<br />
Employee turnover is a measure of our<br />
success in retaining our people. Our<br />
long-term interests rely on our ability<br />
to attract and retain the best people,<br />
at every level, with appropriate skills.<br />
Voluntary turnover is calculated as<br />
a percentage of total permanent<br />
employees (excluding contractors).<br />
In 2010, voluntary turnover, which excludes<br />
compulsory redundancies or <strong>performance</strong>related<br />
terminations, was 11% higher than<br />
in 2009.<br />
We aim to provide employees with the<br />
resources they require to progress in their<br />
careers and excel. We provide career<br />
development opportunities, access to<br />
training and skills development.<br />
Voluntary turnover<br />
(%)<br />
11%<br />
increase<br />
9<br />
6<br />
3<br />
0<br />
7.2<br />
08<br />
6.4<br />
09<br />
7.1<br />
10<br />
Ongoing training and education is<br />
conducted both in the workplace and at<br />
external institutions. Both training hours<br />
and training spend are shown as an<br />
average per employee including contractors<br />
and is shown for all available periods.<br />
In 2010, the number of hours of training<br />
that each employee participated in<br />
increased compared to the previous year.<br />
The average amount spent on training per<br />
employee was lower than the previous year,<br />
mainly as a result of increased in-house<br />
training programmes as opposed to<br />
using the services of external training<br />
service providers.<br />
Average training spend and hours<br />
per employee ($/hour)<br />
7%<br />
decrease on spend<br />
1,800<br />
1,200<br />
600<br />
0<br />
1,809<br />
08<br />
1,058<br />
09<br />
987<br />
10<br />
Average training hours per employee.<br />
45<br />
30<br />
15<br />
0<br />
Corporate social<br />
involvement ($m)<br />
www.xstrata.com | 41<br />
<strong>Xstrata</strong> sets aside a minimum of 1% of<br />
annual Group profit before tax to fund<br />
initiatives that benefit local communities.<br />
We also calculate the total value of in-kind<br />
contributions such as equipment and<br />
management time. We support programmes<br />
for community development, enterprise and<br />
job creation, health, education and the<br />
environment, as well as culture and arts.<br />
In 2010, we set aside $84 million or 1.2%<br />
of Group profit before tax and contributed<br />
a total of $83 million, including $2 million of<br />
in-kind contributions, to support initiatives<br />
that benefit the communities in which we<br />
operate. In 2010, $45 million funded social<br />
and community development projects,<br />
$16 million was spent on education initiatives,<br />
$7 million on enterprise and job creation<br />
programmes, $6 million on health projects,<br />
$4 million on culture and art activities, and<br />
$3 million on environment initiatives.<br />
Corporate social involvement<br />
($m)<br />
37%<br />
increase in cash spending<br />
120<br />
80<br />
40<br />
0<br />
20.8<br />
84.1<br />
08<br />
Corporate social involvement<br />
by region 2010 (cash only)<br />
1 South America 40%<br />
2 Africa 26%<br />
3 Australasia 21%<br />
4 North America 11%<br />
5 Europe 2%<br />
5.4<br />
59.3<br />
09<br />
3<br />
2.5<br />
81.3<br />
10<br />
4 5<br />
2<br />
Cash<br />
In-kind<br />
1<br />
Overview Strategy Performance Governance Financials