World Dressage Masters Guide 2016
By Equine MERC
By Equine MERC

You also want an ePaper? Increase the reach of your titles
YUMPU automatically turns print PDFs into web optimized ePapers that Google loves.
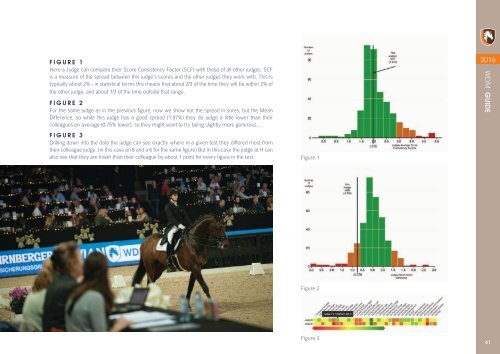
FIGURE 1<br />
Here a Judge can compare their Score Consistency Factor (SCF) with those of all other judges. SCF<br />
is a measure of the spread between this judge’s scores and the other judges they work with. This is<br />
typically about 2% - in statistical terms this means that about 2/3 of the time they will be within 2% of<br />
the other judge, and about 1/3 of the time outside that range.<br />
FIGURE 2<br />
For the same judge as in the previous figure, now we show not the spread in sores, but the Mean<br />
Difference, so while this judge has a good spread (1.97%) they do judge a little lower than their<br />
colleagues on average (0.75% lower), so they might want to try being slightly more generous….<br />
FIGURE 3<br />
Drilling down into the data the judge can see exactly where in a given test they differed most from<br />
their colleague judge. (in this case an 8 and a 6 for the same figure) But in this case the judge at H can<br />
also see that they are lower than their colleague by about 1 point for every figure in the test.<br />
Figure 1<br />
<strong>2016</strong><br />
WDM GUIDE<br />
Figure 2<br />
Figure 3<br />
61