

Technologies
fast16_full_proceedings
fast16_full_proceedings

Create successful ePaper yourself
Turn your PDF publications into a flip-book with our unique Google optimized e-Paper software.
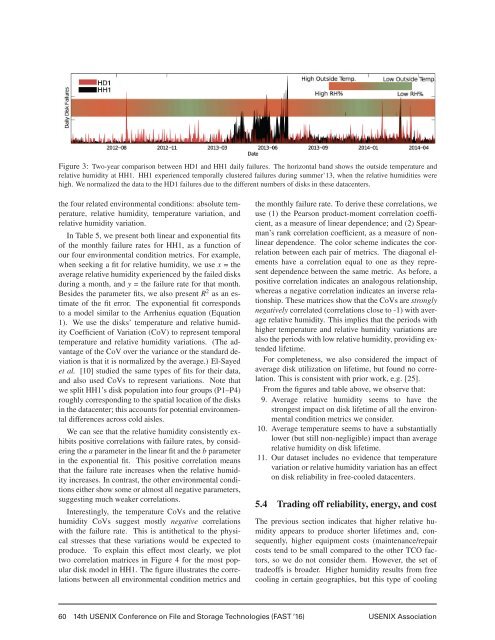
Figure 6: Normalized daily failures in CD1 over 4 years. Infant<br />
mortality seems clear.<br />
6 Modeling Lifetime in Modern DCs<br />
Models of hardware component lifetime have been used<br />
extensively in industry and academia to understand and<br />
predict failures, e.g. [9, 29, 30]. In the context of a datacenter,<br />
which hosts hundreds of thousands of components,<br />
modeling lifetimes is important to select the conditions<br />
under which datacenters should operate and prepare<br />
for the unavoidable failures. Because disk drives<br />
fail much more frequently than other components, they<br />
typically receive the most modeling attention. The two<br />
most commonly used disk lifetime models are the bathtub<br />
model and the failure acceleration model based on<br />
the Arrhenius equation (Equation 1). The latter acceleration<br />
model does not consider the impact of relative humidity,<br />
which has only become a significant factor after<br />
the advent of free cooling (Section 5.3).<br />
Bathtub model. This model abstracts the lifetime<br />
of large component populations as three consecutive<br />
phases: (1) in the first phase, a significant number of<br />
components fail prematurely (infant mortality); (2) the<br />
second phase is a stable period of lower failure rate; and<br />
(3) in the third phase, component failure increase again<br />
due to wear-out effects. We clearly observe infant mortality<br />
in some datacenters but not others, depending on<br />
disk model/vendor. For example, Figure 3 does not show<br />
any obvious infant mortality in HH1. The same is the<br />
case of CD3. (Prior works have also observed the absence<br />
of infant mortality in certain cases, e.g. [28].) In<br />
contrast, CD1 uses disks from a different vendor and<br />
does show clear infant mortality. Figure 6 shows the<br />
normalized number of daily failures over a period of 4<br />
years in CD1. This length of time implies 1 server refresh<br />
(which happened after 3 years of operation). The figure<br />
clearly shows 2 spikes of temporally clustered failures:<br />
one group 8 months after the first server deployment, and<br />
another 9 months after the first server refresh. A full deployment/refresh<br />
may take roughly 3 months, so the first<br />
group of disks may have failed 5-8 months after deployment,<br />
and the second 6-9 months after deployment.<br />
A new disk lifetime model for free-cooled datacenters.<br />
Section 5.3 uses multiple sources of evidence to argue<br />
that relative humidity has a significant impact on hardware<br />
reliability in humid free-cooled datacenters. The<br />
section also classifies the disk failures into two main<br />
groups: SMART and controller/connectivity. Thus, we<br />
extend the acceleration model above to include relative<br />
humidity, and recognize that there are two main disk lifetime<br />
processes in free-cooled datacenters: (1) one that affects<br />
the disk mechanics and SMART-related errors; and<br />
(2) another that affects its controller/connector.<br />
We model process #1 as the Arrhenius acceleration<br />
factor, i.e. AF 1 = AF T (we define AF T in Equation 1),<br />
as has been done in the past [10, 27]. For process #2,<br />
we model the corrosion rate due to high relative humidity<br />
and temperature, as both of them are known to affect corrosion<br />
[33]. Prior works have devised models allowing<br />
for more than one accelerating variable [12]. A general<br />
such model extends the Arrhenius failure rate to account<br />
for relative humidity, and compute a corrosion rate CR:<br />
CR(T ,RH)=const · e ( −Ea<br />
k·T ) (b·RH)+( c·RH<br />
· e k·T ) (2)<br />
where T is the average temperature, RH is the average<br />
relative humidity, E a is the temperature activation energy,<br />
k is Boltzmann’s constant, and const, b, and c are other<br />
constants. Peck empirically found an accurate model that<br />
assumes c = 0 [24], and we make the same assumption.<br />
Intuitively, Equation 2 exponentially relates the corrosion<br />
rate with both temperature and relative humidity.<br />
One can now compute the acceleration factor AF 2 by<br />
dividing the corrosion rate at the elevated temperature<br />
and relative humidity CR(T e ,RH e ) by the same rate at the<br />
baseline temperature and relative humidity CR(T b ,RH b ).<br />
Essentially, AF 2 calculates how much faster disks will<br />
fail due to the combined effects of these environmentals.<br />
This division produces:<br />
AF 2 = AF T · AF RH (3)<br />
where AF RH = e b·(RH e−RH b ) and AF T is from Equation 1.<br />
Now, we can compute the compound average failure<br />
rate FR as AF 1 · FR 1b + AF 2 · FR 2b , where FR 1b is the<br />
average mechanical failure rate at the baseline temperature,<br />
and FR 2b is the average controller/connector failure<br />
rate at the baseline relative humidity and temperature.<br />
The rationale for this formulation is that the two<br />
failure processes proceed in parallel, and a disk’s controller/connector<br />
would not fail at exactly the same time<br />
as its other components; AF 1 estimates the extra failures<br />
due to mechanical/SMART issues, and AF 2 estimates the<br />
extra failures due to controller/connectivity issues.<br />
To account for varying temperature and relative humidity,<br />
we also weight the factors based on the duration<br />
of those temperatures and relative humidities. Other<br />
works have used weighted acceleration factors, e.g. [31].<br />
For simplicity in the monitoring of these environmentals,<br />
we can use the average temperature and average relative<br />
62 14th USENIX Conference on File and Storage <strong>Technologies</strong> (FAST ’16) USENIX Association