Test-Retest Reliability and the Birkman Method - CareerLab
Test-Retest Reliability and the Birkman Method - CareerLab
Test-Retest Reliability and the Birkman Method - CareerLab

Create successful ePaper yourself
Turn your PDF publications into a flip-book with our unique Google optimized e-Paper software.
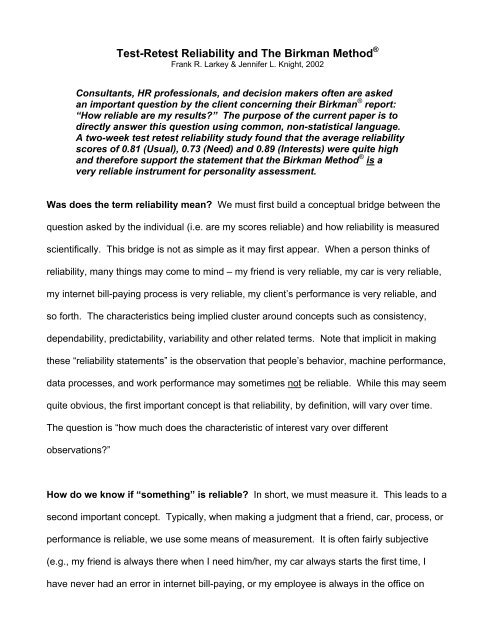
<strong>Test</strong>-<strong>Retest</strong> <strong>Reliability</strong> <strong>and</strong> The <strong>Birkman</strong> <strong>Method</strong> ®<br />
Frank R. Larkey & Jennifer L. Knight, 2002<br />
Consultants, HR professionals, <strong>and</strong> decision makers often are asked<br />
an important question by <strong>the</strong> client concerning <strong>the</strong>ir <strong>Birkman</strong> ® report:<br />
“How reliable are my results?” The purpose of <strong>the</strong> current paper is to<br />
directly answer this question using common, non-statistical language.<br />
A two-week test retest reliability study found that <strong>the</strong> average reliability<br />
scores of 0.81 (Usual), 0.73 (Need) <strong>and</strong> 0.89 (Interests) were quite high<br />
<strong>and</strong> <strong>the</strong>refore support <strong>the</strong> statement that <strong>the</strong> <strong>Birkman</strong> <strong>Method</strong> ® is a<br />
very reliable instrument for personality assessment.<br />
Was does <strong>the</strong> term reliability mean? We must first build a conceptual bridge between <strong>the</strong><br />
question asked by <strong>the</strong> individual (i.e. are my scores reliable) <strong>and</strong> how reliability is measured<br />
scientifically. This bridge is not as simple as it may first appear. When a person thinks of<br />
reliability, many things may come to mind – my friend is very reliable, my car is very reliable,<br />
my internet bill-paying process is very reliable, my client’s performance is very reliable, <strong>and</strong><br />
so forth. The characteristics being implied cluster around concepts such as consistency,<br />
dependability, predictability, variability <strong>and</strong> o<strong>the</strong>r related terms. Note that implicit in making<br />
<strong>the</strong>se “reliability statements” is <strong>the</strong> observation that people’s behavior, machine performance,<br />
data processes, <strong>and</strong> work performance may sometimes not be reliable. While this may seem<br />
quite obvious, <strong>the</strong> first important concept is that reliability, by definition, will vary over time.<br />
The question is “how much does <strong>the</strong> characteristic of interest vary over different<br />
observations?”<br />
How do we know if “something” is reliable? In short, we must measure it. This leads to a<br />
second important concept. Typically, when making a judgment that a friend, car, process, or<br />
performance is reliable, we use some means of measurement. It is often fairly subjective<br />
(e.g., my friend is always <strong>the</strong>re when I need him/her, my car always starts <strong>the</strong> first time, I<br />
have never had an error in internet bill-paying, or my employee is always in <strong>the</strong> office on
time). In this case you are using your cognitive abilities as your measuring device. If you<br />
carefully recall <strong>and</strong> scrutinize your past judgment of <strong>the</strong> reliability of people, machines,<br />
processes, <strong>and</strong> behaviors you would probably recall an incident or two when your car did not<br />
start <strong>the</strong> first time or your employee may have been late in getting to work. The fact is that<br />
you are ei<strong>the</strong>r categorizing this kind of behavior as non-typical <strong>and</strong> thus irrelevant or you may<br />
be doubting your own objectively in <strong>the</strong> matter - maybe you did not turn <strong>the</strong> key far enough or<br />
perhaps <strong>the</strong> employee was on time <strong>and</strong> you just did not notice. The question in this case is<br />
“could <strong>the</strong> variance in this characteristic be due to a limitation in my ability to measure <strong>the</strong><br />
characteristic perfectly?”<br />
Do o<strong>the</strong>r factors affect reliability? In <strong>the</strong> examples mentioned above, you may also<br />
attribute inconsistent behavior to “context” factors. For example, <strong>the</strong> car always starts except<br />
when <strong>the</strong> temperature is below 10 degrees, or <strong>the</strong> employee is probably late because of an<br />
unexpected traffic jam. Whatever <strong>the</strong> behavior or process we are measuring, most people<br />
often attribute non-typical behavior to factors outside <strong>the</strong> control of <strong>the</strong> individual (e.g.,<br />
“clearly Jane must have been under a lot of stress to make that big of a mistake!”). Errors<br />
are often caused by a change in <strong>the</strong> environment that is completely independent of individual<br />
inconsistency <strong>and</strong> variance in <strong>the</strong> measurement tool.<br />
How do we determine if inconsistency is due to <strong>the</strong> person, <strong>the</strong> measurement<br />
instrument, or <strong>the</strong> context? Let’s pull toge<strong>the</strong>r <strong>the</strong> three topics discussed above. The<br />
reliability/unreliability of <strong>Birkman</strong> ® scores can be attributed to: 1) individual differences in<br />
responses between <strong>the</strong> first <strong>and</strong> second assessment session; 2) <strong>Birkman</strong> ® items not<br />
producing consistent results; 3) environmental factors during two separate sessions being so<br />
different as to significantly affect individuals’ responses. Scientists measure <strong>the</strong> effects of
<strong>the</strong>se factors on reliability through application of <strong>the</strong> scientific method, <strong>and</strong> in <strong>the</strong> present<br />
analysis applied a test-retest design. The results for <strong>the</strong> latest <strong>Birkman</strong> ® test-retest study are<br />
shown in <strong>the</strong> table below.<br />
Two Weeks <strong>Test</strong>-<strong>Retest</strong> 2002<br />
Components Usual Need Interests<br />
Esteem 0.81 0.70 Persuasive 0.93<br />
Acceptance 0.85 0.76 SocialService 0.88<br />
Structure 0.75 0.72 Scientific 0.92<br />
Authority 0.82 0.59 Mechanical 0.96<br />
Advantage 0.80 0.77 Outdoor 0.94<br />
Activity 0.88 0.72 Numerical 0.89<br />
Challenge 0.72 0.72 Clerical 0.86<br />
Empathy 0.88 0.78 Artistic 0.89<br />
Change 0.80 0.74 Literary 0.90<br />
Freedom 0.77 0.78 Musical 0.72<br />
Thought 0.78 0.77 ave 0.89<br />
ave 0.81 0.73 stdev 0.07<br />
stdev 0.05 0.05 Range<br />
Range Range .72 to .96<br />
.72 to .88 .59 to .78<br />
All significant at <strong>the</strong> .0001 level<br />
The goal of <strong>the</strong> rest of <strong>the</strong> paper is to explain in common terms how to interpret <strong>the</strong> data<br />
represented in <strong>the</strong> current sample of 77 employees at a large petrochemical organization.<br />
.<br />
Unreliability Attributed to <strong>the</strong> Individual<br />
<strong>Reliability</strong> is a group ra<strong>the</strong>r than individual measure. Imagine that you are taking a<br />
multiple-choice exam in Management 101. You have always been an “A” student. Your<br />
exam is returned to you with a score of 82. How reliable is your score? If you took <strong>the</strong> test<br />
over immediately would your score be exactly <strong>the</strong> same? Besides <strong>the</strong> knowledge that you<br />
gained to prepare for <strong>the</strong> exam <strong>and</strong> given <strong>the</strong> fact that during a second testing you might not<br />
remember as much information, what o<strong>the</strong>r factors affect <strong>the</strong> “reliability” of your scores?<br />
Perhaps, <strong>the</strong> first exam was given in <strong>the</strong> morning <strong>and</strong> you did not have <strong>the</strong> time to have your
second cup of coffee. You might argue that you missed a few questions because you were<br />
not yet awake. Or you could argue <strong>the</strong> opposite, that you had four cups of coffee <strong>and</strong><br />
subsequently had so much caffeine that you could not keep your attention focused. In ei<strong>the</strong>r<br />
case, you might tell yourself that 82 does not accurately measure your knowledge since your<br />
average score in <strong>the</strong> class is a 96. In a word, your individual response has changed due to<br />
an internal change.<br />
Indeed, clients talk about reliability typically only in regards to <strong>the</strong>ir own individual scores.<br />
However, <strong>the</strong> scientific method is applied not to an individual’s score but to a group of scores.<br />
So when instrument reliability is discussed <strong>the</strong> unit of analysis is not <strong>the</strong> individual but a<br />
group. Therefore, an instrument might demonstrate a very high reliability but some individual<br />
scores will vary greatly. One way of thinking about this is that most people would be able to<br />
predict that bubbles would start appearing in a pan (boiling) on a range at 212°F. However, it<br />
is virtually impossible to predict where <strong>and</strong> which individual bubble would be first. While <strong>the</strong>re<br />
are exceptions, science typically measures groups <strong>and</strong> not individuals. In any case, <strong>the</strong><br />
measure of reliability reflects differences averaged across groups. Individual unreliability is<br />
greatly reduced by sampling a group of individuals. We can see <strong>the</strong> application of this<br />
principle by referring to <strong>the</strong> data below selected from Table 1 (see page 3).<br />
Components Usual Need<br />
Esteem 0.81 0.70<br />
The numbers (statistics) for Esteem Usual <strong>and</strong> Need reflect <strong>the</strong> strength of <strong>the</strong> relationship<br />
between responses in <strong>the</strong> first session <strong>and</strong> responses in <strong>the</strong> second session (this statistic is a<br />
correlation <strong>and</strong> is often referred to as <strong>the</strong> coefficient of stability). The important concept here<br />
to underst<strong>and</strong> is that <strong>the</strong>se scores reflect <strong>the</strong> average of <strong>the</strong> products (st<strong>and</strong>ardized) of all 77<br />
people participating in <strong>the</strong> study. Individual differences between <strong>the</strong> two sessions are not
singled out for analysis but measured as part of <strong>the</strong> group. If all participants would have<br />
made exactly <strong>the</strong> same responses on all items, <strong>the</strong> relationship between <strong>the</strong> two group<br />
scores would have been 1.00 – this would mean a perfect one-to-one relationship on each<br />
item for all members of <strong>the</strong> study. If all participants answered exactly <strong>the</strong> opposite on each<br />
item, <strong>the</strong> relationship between <strong>the</strong> two sessions would have been –1.00. If <strong>the</strong> participants<br />
secretly conspired to answer all items r<strong>and</strong>omly, <strong>the</strong> relationship would have been fairly close<br />
to 0.00.<br />
In general, correlations of .70 <strong>and</strong> above are considered highly related <strong>and</strong> correlations of .60<br />
<strong>and</strong> even .50 often are reported in personality assessment reliability studies. A simulation<br />
exercise is provided in Appendix 1 so that <strong>the</strong> reader can actually manipulate <strong>the</strong> data to<br />
learn how <strong>the</strong> correlation can change depending on <strong>the</strong> numbers used.<br />
To summarize, individual differences between <strong>the</strong> two scores are expected <strong>and</strong> serve as <strong>the</strong><br />
basis for computing <strong>the</strong> average strength of <strong>the</strong> relationship on each component.<br />
Unreliability Due to <strong>the</strong> Instrument<br />
The purpose of a test-retest design is to focus on <strong>the</strong> reliability of <strong>the</strong> instrument. In <strong>the</strong><br />
current study, 200 employees from a major petrochemical service company were invited to<br />
participate in a scientific study jointly sponsored by <strong>the</strong> company <strong>and</strong> <strong>Birkman</strong> International.<br />
Anonymity was guaranteed <strong>and</strong> employees were told that <strong>the</strong>y would be required to take two<br />
assessments. Anonymity was guaranteed because previous research has demonstrated that<br />
if employees feel that <strong>the</strong>ir results may be used in any evaluative sense <strong>the</strong> answers are<br />
biased towards socially desirable responses. Although <strong>the</strong>y were told that a second<br />
assessment would take place exactly two weeks after <strong>the</strong> first, no mention was made that
<strong>the</strong>y would take <strong>the</strong> <strong>Birkman</strong> ® twice. The purpose of this “design” is to limit individual<br />
differences in scores due to knowledge that <strong>the</strong>y would be retaking <strong>the</strong> <strong>Birkman</strong> ®<br />
questionnaire . Again, research has demonstrated that knowledge of <strong>the</strong> design or feedback<br />
between sessions biases participants’ responses.<br />
Table 1 on page three displays both <strong>the</strong> individual Component <strong>and</strong> Interest reliability scores<br />
as well as <strong>the</strong> average reliability across all interests. These average reliability scores of .81<br />
(Usual), .73 (Need) <strong>and</strong> .89 (Interests) are high <strong>and</strong> <strong>the</strong>refore support our earlier statement<br />
that <strong>the</strong> <strong>Birkman</strong> <strong>Method</strong> ® is reliable.<br />
Unreliability Due to Environmental Factors<br />
There are many environmental factors that can influence individual responses. Some<br />
examples are distractions such as noise <strong>and</strong> interruptions, differing time constraints,<br />
workplace <strong>and</strong> personal stress, <strong>and</strong> major life changes between testing periods. Unreliability<br />
due to environmental changes were minimized by providing clear instructions, having all<br />
employees take <strong>the</strong> <strong>Birkman</strong> ® at <strong>the</strong>ir personal computers, having strong managerial support<br />
for experimental control, <strong>and</strong> measuring individual time used for assessment.<br />
In summary, any scientific study assumes that some error will enter into <strong>the</strong> analysis due to<br />
factors beyond <strong>the</strong> control of <strong>the</strong> researchers. The positive results of <strong>the</strong> analysis support <strong>the</strong><br />
efforts made by <strong>the</strong> researchers <strong>and</strong> <strong>the</strong> design of <strong>the</strong> study to control for factors outside <strong>the</strong><br />
control of <strong>the</strong> employees.
Summary of <strong>Test</strong>-<strong>Retest</strong> Results 2002<br />
Table 1 provides <strong>the</strong> strength of relationship between tests for each Component <strong>and</strong> Interest<br />
score. In addition, <strong>the</strong> average of all Components <strong>and</strong> Interests scores are reported so that<br />
<strong>the</strong> reader can compare <strong>the</strong>se results to o<strong>the</strong>r instruments. The st<strong>and</strong>ard deviation scores<br />
are reported to indicate <strong>the</strong> variance of <strong>the</strong> score. Finally, <strong>the</strong> range of Usual, Need, <strong>and</strong><br />
Interest scores are presented as a second measure of variance.<br />
A History of <strong>Reliability</strong>. Roger <strong>Birkman</strong> <strong>and</strong> his colleagues have historically considered <strong>the</strong><br />
reliability <strong>and</strong> validity of The <strong>Birkman</strong> <strong>Method</strong> ® to be absolutely essential. On <strong>the</strong> following<br />
page a table is provided that reflects test-retest results over many years. Table 2 shows <strong>the</strong><br />
history of <strong>the</strong> high reliability of <strong>the</strong> <strong>Birkman</strong> ® .<br />
Table 2<br />
Immediate: N = 42 Two-Weeks: N = 132 15-Months: N = 50 Two-Weeks 2002: N = 77<br />
Usual Need Usual Need Usual Need Usual Need<br />
Esteem 0.78 0.87 0.84 0.80 0.32 0.64 0.81 0.70<br />
Acceptance 0.79 0.94 0.80 0.85 0.21 0.40 0.85 0.76<br />
Structure 0.78 0.77 0.70 0.71 0.48 0.57 0.75 0.72<br />
Authority 0.79 0.76 0.74 0.70 0.24 0.50 0.82 0.59<br />
Advantage 0.87 0.83 0.81 0.80 0.60 0.69 0.80 0.77<br />
Activity 0.69 0.86 0.52 0.48 0.48 0.45 0.88 0.72<br />
Challenge 0.72 0.72<br />
Empathy 0.82 0.91 0.84 0.82 0.56 0.45 0.88 0.78<br />
Change 0.81 0.82 0.77 0.76 0.62 0.44 0.80 0.74<br />
Freedom 0.71 0.76 0.81 0.80 0.40 0.60 0.77 0.78<br />
Thought 0.71 0.78 0.74 0.76 0.55 0.62 0.78 0.77<br />
ave 0.78 0.83 0.76 0.75 0.45 0.54 0.81 0.73<br />
stdev 0.06 0.06 0.10 0.11 0.15 0.10 0.05 0.05<br />
R=.69to.87 R=.76to.91 R=.52to.84 R=.48to.85 R=.21to.62 R=.40to.69 R=.72to.88 R=.59to.78<br />
Persuasive 0.72 0.65 0.93<br />
SocialService 0.81 0.75 0.88<br />
Scientific 0.70 0.81 0.92<br />
Mechanical 0.80 0.79 0.96<br />
Outdoor 0.75 0.72 0.94<br />
Numerical 0.58 0.73 0.89<br />
Clerical 0.84 0.78 0.86<br />
Artistic 0.81 0.81 0.89<br />
Literary 0.76 0.76 0.90<br />
Musical 0.81 0.81 0.72<br />
ave 0.76 0.76 0.89<br />
stdev 0.08 0.05 0.07
Table 2 was taken from The <strong>Birkman</strong> <strong>Method</strong> ® <strong>Reliability</strong> <strong>and</strong> Validity, 2002 (Please see <strong>the</strong><br />
entire report for additional reliability measures such as Cronbach’s alpha which measures <strong>the</strong><br />
internal consistency of a scale).<br />
The <strong>Birkman</strong> <strong>Method</strong> ® test-retest data have been collected over twenty years, <strong>and</strong> <strong>the</strong> strong<br />
research tradition here continues to drive <strong>the</strong> <strong>Birkman</strong> ® . These research efforts have<br />
continually revealed <strong>the</strong> impressive reliability of <strong>the</strong> <strong>Birkman</strong> <strong>Method</strong> ® , <strong>and</strong> <strong>the</strong>y exemplify <strong>the</strong><br />
historical <strong>and</strong> current commitment of <strong>Birkman</strong> International to research integrity.
Appendix 1 – Simulation of <strong>Reliability</strong> Statistic<br />
Use <strong>the</strong> spreadsheet above to learn <strong>the</strong> relationship between individual scores <strong>and</strong> <strong>the</strong><br />
coefficient of stability.<br />
A B C D E<br />
1 Session 1 Session 2<br />
2 Employee Esteem 1 Esteem 2<br />
3 1 1 1 Duplicate <strong>the</strong>se simulation scores<br />
4 2 10 10 for 11 employees. Once you have<br />
5 3 20 20 entered <strong>the</strong> scores, use <strong>the</strong><br />
6 4 30 30 formula at <strong>the</strong> bottom of <strong>the</strong> column<br />
7 5 40 40 to generate <strong>the</strong> coefficient of<br />
8 6 50 50 stability (correlation). Then change<br />
9 7 60 60 scores to simulated changes in<br />
10 8 70 70 <strong>the</strong> individual scores to see how<br />
11 9 80 80 much <strong>the</strong>se changes impact <strong>the</strong><br />
12 10 90 90 correlation for reliability as<br />
13 11 99 99 displayed in <strong>the</strong> Table.<br />
14<br />
15 Correlation 1<br />
16 Formula is =CORREL(C3:C13,D3:D13)<br />
17<br />
18 Session 1 Session 2<br />
19 Employee Esteem 1 Esteem 2 This table displays a case where<br />
20 1 1 99 each employee answers exactly <strong>the</strong><br />
21 2 10 90 opposite in session 2 as compared<br />
22 3 20 80 to session 1.<br />
23 4 30 70<br />
24 5 40 60<br />
25 6 50 50<br />
26 7 60 40<br />
27 8 70 30<br />
28 9 80 20<br />
29 10 90 10<br />
30 11 99 1<br />
31<br />
32 Correlation -1<br />
33 Formula is =CORREL(C20:C30,D20:D30)<br />
34<br />
35 Session 1 Session 2<br />
36 Employee Esteem 1 Esteem 2 This table displays a case where<br />
37 1 1 60 each employee answers r<strong>and</strong>omly<br />
38 2 99 50 during both session 1 <strong>and</strong> 2.<br />
39 3 40 80<br />
40 4 50 99<br />
41 5 80 1<br />
42 6 70 40<br />
43 7 90 20<br />
44 8 20 10<br />
45 9 80 90<br />
46 10 10 30<br />
47 11 30 70<br />
48<br />
49 Correlation -0.076942<br />
50 Formula is =CORREL(C37:C47,D37:D47)
Statistical Definitions<br />
<strong>Reliability</strong>: The degree to which a score is stable <strong>and</strong> consistent when measured at different<br />
times (test-retest reliability), in different ways (parallel-forms <strong>and</strong> alternate-forms), or with<br />
different items within <strong>the</strong> same scale (internal consistency).<br />
Correlation: An assessment of <strong>the</strong> degree of linear relationship between two continuous<br />
variables. Correlation coefficients can range from –1.00 (a perfectly negative relationship to<br />
+1.00 (a perfectly positive relationship).<br />
<strong>Test</strong> of Significance: A test used to determine, in this case, if two variables are related to<br />
one ano<strong>the</strong>r (which would be a statistically significant correlation) or if <strong>the</strong>y are unrelated to<br />
one ano<strong>the</strong>r (which would be confirmation of <strong>the</strong> “null hypo<strong>the</strong>sis”). A correlation is said to be<br />
statistically significant if <strong>the</strong> probability of <strong>the</strong> null hypo<strong>the</strong>sis being true (i.e., that <strong>the</strong> two<br />
variables are unrelated) is less than 5 times in 100, or .05.<br />
Cronbach’s Alpha: A statistical measure of internal consistency which measures how well<br />
items on a scale “fit” toge<strong>the</strong>r <strong>and</strong> measure <strong>the</strong> same construct.<br />
Validity: The extent to which a test measures what it purports to measure. This is often not a<br />
simple “yes or no” answer, as <strong>the</strong>re are many types of validity that need to be assessed (i.e.,<br />
construct, content, criterion-related validity) when developing a personality assessment.<br />
Recommended References<br />
For more information about test-retest reliability, please consult <strong>the</strong> following sources:<br />
Aamodt, M. G. (1991). Applied industrial/organizational psychology. Belmont, CA:<br />
Wadsworth Publishing Company.<br />
Anastasi, A. (1982). Psychological testing. New York: Macmillan.<br />
<strong>Birkman</strong>, R. W. (2001). The <strong>Birkman</strong> <strong>Method</strong> ® <strong>Reliability</strong> <strong>and</strong> Validity Study. Houston,<br />
TX: <strong>Birkman</strong> International, Inc.<br />
Cohen, R. J., Swerdlik, M. E., & Phillips, S. M. (1996). Psychological testing <strong>and</strong><br />
measurement: An introduction to tests <strong>and</strong> measurement. Mountain View, CA: Mayfield<br />
Publishing Company.<br />
Pinneau, S. R. (1961). Changes in intelligence quotients from infancy to maturity.<br />
Boston: Houghton Mifflin.