annual report - AV Concept Holdings Limited
annual report - AV Concept Holdings Limited
annual report - AV Concept Holdings Limited
Create successful ePaper yourself
Turn your PDF publications into a flip-book with our unique Google optimized e-Paper software.
Av ConCept <strong>Holdings</strong> limited<br />
AnnuAl RepoRt 2012<br />
MANAGEMENT DISCUSSION AND ANALYSIS<br />
LIQUIDITY AND FINANCIAL RESOURCES<br />
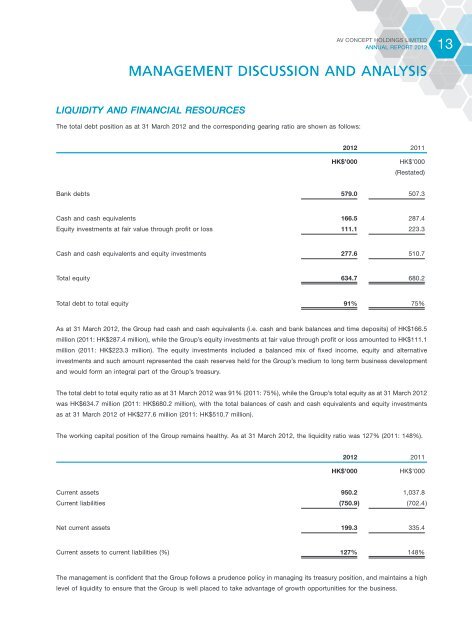
the total debt position as at 31 march 2012 and the corresponding gearing ratio are shown as follows:<br />
2012 2011<br />
HK$’000 HK$’000<br />
(Restated)<br />
Bank debts 579.0 507.3<br />
Cash and cash equivalents 166.5 287.4<br />
equity investments at fair value through profit or loss 111.1 223.3<br />
Cash and cash equivalents and equity investments 277.6 510.7<br />
total equity 634.7 680.2<br />
total debt to total equity 91% 75%<br />
As at 31 march 2012, the group had cash and cash equivalents (i.e. cash and bank balances and time deposits) of HK$166.5<br />
million (2011: HK$287.4 million), while the group’s equity investments at fair value through profit or loss amounted to HK$111.1<br />
million (2011: HK$223.3 million). the equity investments included a balanced mix of fixed income, equity and alternative<br />
investments and such amount represented the cash reserves held for the group’s medium to long term business development<br />
and would form an integral part of the group’s treasury.<br />
the total debt to total equity ratio as at 31 march 2012 was 1% (2011: 75%), while the group’s total equity as at 31 march 2012<br />
was HK$634.7 million (2011: HK$680.2 million), with the total balances of cash and cash equivalents and equity investments<br />
as at 31 march 2012 of HK$277.6 million (2011: HK$510.7 million).<br />
the working capital position of the group remains healthy. As at 31 march 2012, the liquidity ratio was 127% (2011: 148%).<br />
2012 2011<br />
HK$’000 HK$’000<br />
Current assets 950.2 1,037.8<br />
Current liabilities (750.9) (702.4 )<br />
net current assets 199.3 335.4<br />
Current assets to current liabilities (%) 127% 148%<br />
the management is confident that the group follows a prudence policy in managing its treasury position, and maintains a high<br />
level of liquidity to ensure that the group is well placed to take advantage of growth opportunities for the business.<br />
13


