vegetables
VA-MarApr2016
VA-MarApr2016

Create successful ePaper yourself
Turn your PDF publications into a flip-book with our unique Google optimized e-Paper software.
40<br />
Economic Update<br />
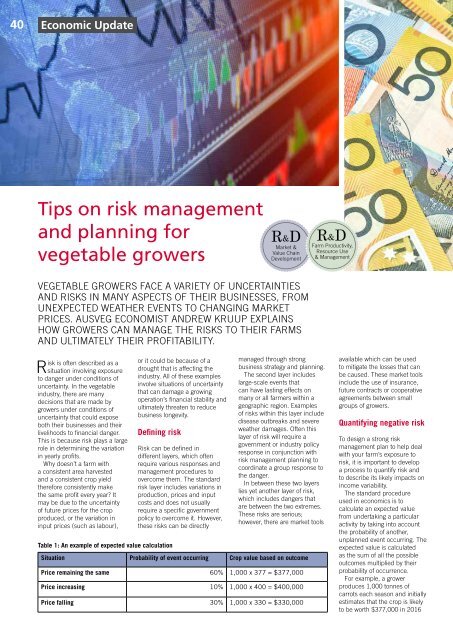
Tips on risk management<br />
and planning for<br />
vegetable growers<br />
R&D<br />
R&D<br />
Market & Farm Productivity,<br />
Value Chain Resource Use<br />
Development & Management<br />
VEGETABLE GROWERS FACE A VARIETY OF UNCERTAINTIES<br />
AND RISKS IN MANY ASPECTS OF THEIR BUSINESSES, FROM<br />
UNEXPECTED WEATHER EVENTS TO CHANGING MARKET<br />
PRICES. AUSVEG ECONOMIST ANDREW KRUUP EXPLAINS<br />
HOW GROWERS CAN MANAGE THE RISKS TO THEIR FARMS<br />
AND ULTIMATELY THEIR PROFITABILITY.<br />
Risk is often described as a<br />
situation involving exposure<br />
to danger under conditions of<br />
uncertainty. In the vegetable<br />
industry, there are many<br />
decisions that are made by<br />
growers under conditions of<br />
uncertainty that could expose<br />
both their businesses and their<br />
livelihoods to financial danger.<br />
This is because risk plays a large<br />
role in determining the variation<br />
in yearly profits.<br />
Why doesn’t a farm with<br />
a consistent area harvested<br />
and a consistent crop yield<br />
therefore consistently make<br />
the same profit every year? It<br />
may be due to the uncertainty<br />
of future prices for the crop<br />
produced, or the variation in<br />
input prices (such as labour),<br />
or it could be because of a<br />
drought that is affecting the<br />
industry. All of these examples<br />
involve situations of uncertainty<br />
that can damage a growing<br />
operation’s financial stability and<br />
ultimately threaten to reduce<br />
business longevity.<br />
Defining risk<br />
Table 1: An example of expected value calculation<br />
Risk can be defined in<br />
different layers, which often<br />
require various responses and<br />
management procedures to<br />
overcome them. The standard<br />
risk layer includes variations in<br />
production, prices and input<br />
costs and does not usually<br />
require a specific government<br />
policy to overcome it. However,<br />
these risks can be directly<br />
managed through strong<br />
business strategy and planning.<br />
The second layer includes<br />
large-scale events that<br />
can have lasting effects on<br />
many or all farmers within a<br />
geographic region. Examples<br />
of risks within this layer include<br />
disease outbreaks and severe<br />
weather damages. Often this<br />
layer of risk will require a<br />
government or industry policy<br />
response in conjunction with<br />
risk management planning to<br />
coordinate a group response to<br />
the danger.<br />
In between these two layers<br />
lies yet another layer of risk,<br />
which includes dangers that<br />
are between the two extremes.<br />
These risks are serious;<br />
however, there are market tools<br />
Situation Probability of event occurring Crop value based on outcome<br />
Price remaining the same 60% 1,000 x 377 = $377,000<br />
Price increasing 10% 1,000 x 400 = $400,000<br />
Price falling 30% 1,000 x 330 = $330,000<br />
available which can be used<br />
to mitigate the losses that can<br />
be caused. These market tools<br />
include the use of insurance,<br />
future contracts or cooperative<br />
agreements between small<br />
groups of growers.<br />
Quantifying negative risk<br />
To design a strong risk<br />
management plan to help deal<br />
with your farm’s exposure to<br />
risk, it is important to develop<br />
a process to quantify risk and<br />
to describe its likely impacts on<br />
income variability.<br />
The standard procedure<br />
used in economics is to<br />
calculate an expected value<br />
from undertaking a particular<br />
activity by taking into account<br />
the probability of another,<br />
unplanned event occurring. The<br />
expected value is calculated<br />
as the sum of all the possible<br />
outcomes multiplied by their<br />
probability of occurrence.<br />
For example, a grower<br />
produces 1,000 tonnes of<br />
carrots each season and initially<br />
estimates that the crop is likely<br />
to be worth $377,000 in 2016