portfolio

Create successful ePaper yourself
Turn your PDF publications into a flip-book with our unique Google optimized e-Paper software.
Here you can see one of my<br />
individual exercise for ArcGIS<br />
course that I persued during my<br />
bachelor in Politecnico di Milano.<br />
I explained in details with 8 steps<br />
from the beginning and<br />
mentioning the main extension<br />
for each step since the course and<br />
exercise was in Italian, here I tried<br />
to summerise it and change the<br />
text to english.<br />
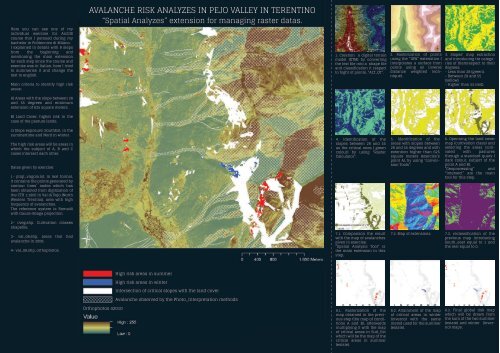
Main criteria to identify high risk<br />
areas:<br />
A) Areas with the slope between 28<br />
and 55 degrees and minimum<br />
extension of 625 square meters.<br />
B) Land Cover: higher risk in the<br />
case of the pasture lands.<br />
AVALANCHE RISK ANALYZES IN PEJO VALLEY IN TERENTINO<br />
“Spatial Analyzes” extension for managing raster datas.<br />
1. Creation a digital terrain<br />
model (DTM) by converting<br />
the text file into a shape file<br />
and classification it respect<br />
to hight of points, “ALT_QT”.<br />
2. Rasterization of points<br />
using the “IDW” extenstion (<br />
Interpolates a surface from<br />
points using an inverse<br />
distance weighted technique).<br />
3. Slopes’ map extraction<br />
and introducing tre categories<br />
of themrespect to their<br />
degrees;<br />
- Less than 28 (green).<br />
- Between 28 and 55<br />
(yellow).<br />
- Higher than 55 (red).<br />
This exercise is an attempt to<br />
design a Territorial Information<br />
System in order to show different<br />
services with available public<br />
transports to reach each of them,<br />
identifying the number of<br />
bus/tram with its time schedule, in<br />
addition available car parks in an<br />
area around Politecnico di Milano.<br />
The primary aim was to get<br />
familiar with how to structure<br />
Topographic DataBase (DBT) and<br />
consequently manage them in a<br />
effective and practical way.<br />
the goal is to show the<br />
accessibility of services around<br />
the Polytechnic, in such a way that<br />
choosing a specific service,<br />
Territorial Information System will<br />
show the path associated with that<br />
service, any eventual public<br />
transports and existing car parks.<br />
ACCESSIBILITY OF SERVICES AROUND POLITECNICO<br />
Unification of two tables of<br />
"services" with “paths” in order to<br />
create the relation 1:1 between<br />
them, by using “Join” extension, in<br />
such a way that choosing one path,<br />
TIS will show the services that exist<br />
around it and viceversa,<br />
later, a query is performed on Paths’<br />
shapefile, choosing Supermarkets<br />
(in this project: Carefour) as the<br />
Typology to be selected. TIS will show<br />
which paths can be taken to reach it.<br />
c) Slope exposure: SouthEst, in the<br />
summertime and Nord in winter.<br />
The high risk areas will be areas in<br />
which the subject of A, B and C<br />
cases intersect each other.<br />
Datas given by exercise:<br />
1- ptiqt_virgola.txt, in text format,<br />
it contains the points generated by<br />
contour lines’ nodes which has<br />
been obtained from digitization of<br />
the CTR 1:1000 in Val di Pejo (North<br />
Western Trentino), area with high<br />
frequency of avalanches.<br />
The reference system is Roma40<br />
with Gauss-Boaga projection.<br />
2- cveg.shp, Cultivation classes<br />
shapefile.<br />
3- val_08.shp, areas that had<br />
avalanche in 2008.<br />
4- val_08.shp, orthophotos.<br />
Orthophotos 42010<br />
High risk areas in summer<br />
High risk areas in winter<br />
Intersection of critical slopes with the land cover<br />
Avalanche observed by the Photo_Interpretation methods<br />
4. Identification of the<br />
slopes between 28 and 55<br />
as the critical ones ( green<br />
colour) by using “Raster<br />
Calculator”.<br />
7.1. Comparison the result<br />
with the map of avalanches<br />
given in exercise.<br />
“Spatial Analysis Tool” is<br />
the main extension in this<br />
step.<br />
8.1. Rasterization of the<br />
map obtained in the previous<br />
step (the map of conditions<br />
A and B), afterwards<br />
multiplying it with the map<br />
of critical areas in Sud_Est<br />
which will be the map of the<br />
critical areas in summer<br />
(estate).<br />
5. Identification of the<br />
areas with slopes between<br />
28 and 55 degrees and with<br />
extention higher than 625<br />
square meters (exercize’s<br />
point A), by using “conversion<br />
Tools”.<br />
7.2. Map of extensions.<br />
8.2. Attainment of the map<br />
of critical areas in winter<br />
(inverno) with the same<br />
metod used for the summer<br />
(estate).<br />
6. Openning the land cover<br />
map (cultivation class) and<br />
selecting the areas cultivated<br />
with pastures<br />
through a standard quary (<br />
dark colour, subject of the<br />
point A and B).<br />
“Geoprocessing” and<br />
“Intersect” are the main<br />
tool for this step.<br />
7.3. reclassification of the<br />
previous map introducing<br />
South_east equal to 1 and<br />
the rest equal to 0.<br />
8.3. Final global risk map<br />
which will be drawn from<br />
the sum of the two summer<br />
(estate) and winter (inverno)<br />
maps.<br />
The database allows the<br />
topographical structure of spatial<br />
information layers and classes<br />
topologically linked to one<br />
another, such interaction should<br />
guarantee the complete digital<br />
view of<br />
the ground.<br />
Entity Attribution Primary Key<br />
Services<br />
Paths<br />
Public<br />
Transport<br />
Stops<br />
Car Parks<br />
-Shape<br />
- Nome<br />
- Address<br />
- Typology<br />
- Opening Hours<br />
- Closing Hours<br />
- Politecnico’s Entry<br />
- Entrance Code<br />
- Type of Sport<br />
- Shape<br />
- Politecnico’s<br />
Entrance Code<br />
- Typology<br />
- Lenght<br />
- Shape<br />
- Typology<br />
- ID Public Transport<br />
- Timetable<br />
- Shape<br />
- Address<br />
- Area<br />
- Typology<br />
ID services<br />
ID paths<br />
ID stops<br />
ID car parks<br />
Differential correction and export<br />
to shape file by Mobile Mapper<br />
Office which permits to increase<br />
the precision performing a relative<br />
positioning with respect to a<br />
permanent station connected to<br />
the Internet. Lombardy Region<br />
disposes a network of stations<br />
accessible to public, the station on<br />
Nave building (Bonardi Street,<br />
Politacnico) was chosen because<br />
of its nearness to the area of relief.<br />
Later, transforming the shapefile<br />
into another reference system<br />
(from WGS84 into<br />
Gauss_Boaga/Roma40) by using<br />
VertoGis software make the<br />
outcome now utilizable in ArcGIS.<br />
Relation 1:N<br />
Relation 1:1<br />
Relation N:M<br />
Relation 1:N<br />
Entity-Relationship Diagram (ERD) designed by "RISE Editor" program<br />
There is at least one path that is<br />
connected to one or more stops<br />
It is possible that there is a path with<br />
no corresponding stop<br />
Relationt 1: N between two tables is<br />
determined by the extension<br />
"relate".<br />
Relate’s operation is not visible by<br />
checking fields in a table as Join’s<br />
operation.<br />
however, once you make a 1:N<br />
relation between two tables and<br />
query datas, you can see also the<br />
fields of the table put in relation<br />
with.<br />
Here the “Relate” applied between<br />
"paths" and "stops" tables is to<br />
make this relation in suche a way<br />
that choosing a path, through the<br />
extension "relate", we would be able<br />
to see the stops that are connected<br />
to that specific path.<br />
Finally, it is possible to visualize the departure and arrival time of each associated public transport. To do this,<br />
an additional field has been added to the table of "fermate" (stops) containing links saved on the same folder in<br />
which the GIS file of work is saved. So clicking on one stop the time table associated to it will be rendered and<br />
appeared.