J - Oregon Department of Geology and Mineral Industries
J - Oregon Department of Geology and Mineral Industries
J - Oregon Department of Geology and Mineral Industries

You also want an ePaper? Increase the reach of your titles
YUMPU automatically turns print PDFs into web optimized ePapers that Google loves.
OREGON GEOLOGY<br />
<strong>Oregon</strong> Deportment <strong>of</strong> <strong>Geology</strong> <strong>and</strong> <strong>Mineral</strong> <strong>Industries</strong> Volume 61, Number 3, May/June 1999
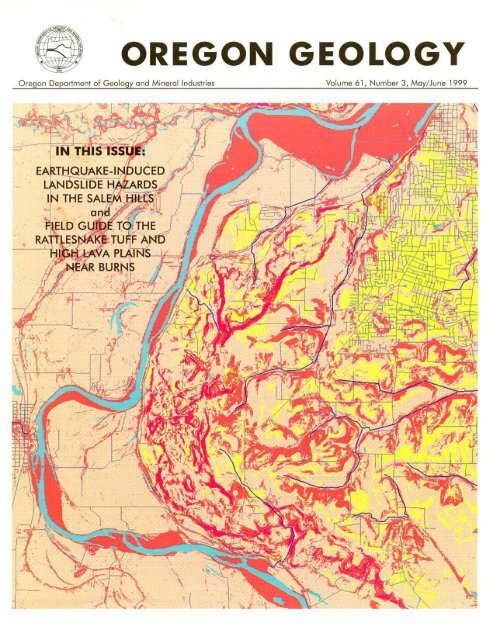
Earthquake-induced slope instability: A relative hazard<br />
map for the vicinity <strong>of</strong> the Salem Hills, <strong>Oregon</strong><br />
by R. Jon H<strong>of</strong>meister, <strong>Oregon</strong> <strong>Department</strong> <strong>of</strong> <strong>Geology</strong> <strong>and</strong> <strong>Mineral</strong> <strong>Industries</strong>, Port/<strong>and</strong> <strong>Oregon</strong> 97232<br />
INTROD UCTION<br />
Public <strong>and</strong> private agencies that<br />
create regional hazard maps can benefit<br />
from the use <strong>of</strong> a st<strong>and</strong>ardized<br />
regional hazard mapping methodol·<br />
ogy. The methodology should be uniform<br />
yet flexible enough to remain<br />
appropriate for, <strong>and</strong> verifiable across,<br />
vast <strong>and</strong> geographically diverse regions.<br />
The ideal is to produce the<br />
most accurate maps possible (that is.<br />
the best predictors <strong>of</strong> high-risk versus<br />
low-risk areas) in the least amount <strong>of</strong><br />
time <strong>and</strong> at the lowest cost.<br />
A recently-developed methodology<br />
by David Keefer <strong>of</strong> the United<br />
States Geological Survey (USGS) <strong>and</strong><br />
Yumei Wang <strong>of</strong> the <strong>Oregon</strong> <strong>Department</strong><br />
<strong>of</strong> <strong>Geology</strong> <strong>and</strong> <strong>Mineral</strong> <strong>Industries</strong><br />
(DOGAMI) is aimed at this ideal<br />
in evaluating slope stability hazards<br />
on a regional scale (Keefer <strong>and</strong><br />
Wang, 1997). Their methodology is<br />
specifically intended for implementation<br />
using Geographic Information<br />
Systems (GIS) <strong>and</strong> utilizes common<br />
methods for scientific <strong>and</strong> engineering<br />
analysis <strong>of</strong> slope stability.<br />
The Salem study presented here is<br />
the second project employing that<br />
methodology. The first was a study<br />
for the Eugene-Springfield metropolitan<br />
area in Lane County, <strong>Oregon</strong><br />
(Wang <strong>and</strong> others, 1998; Black <strong>and</strong><br />
others, 1999).<br />
This project had two primary objectives:<br />
1. To implement <strong>and</strong> evaluate the<br />
methodology for assessing regional<br />
earthquake-induced slope instability<br />
by Keefer <strong>and</strong> Wang (1997) <strong>and</strong> to<br />
refine the method, where applicable,<br />
for subsequent regional mapping efforts<br />
in <strong>Oregon</strong> <strong>and</strong> elsewhere.<br />
2. To create the most accurate <strong>and</strong><br />
representative hazard map feasible<br />
for earthquake-induced slope instability<br />
in the Salem Hills vicinity, given the existing<br />
time <strong>and</strong> economic constraints.<br />
OREGON GEO LOGY, VO LUME 61, NU MBER 3, MAY/JUNE 1999<br />
The resulting hazard map provides<br />
a rational basis for evaluating<br />
the spatial variability <strong>of</strong> l<strong>and</strong>slide<br />
hazards within the Salem area. The<br />
calculations were performed with<br />
GIS tools <strong>and</strong> a 1 Ox1 0 m grid spacing,<br />
<strong>and</strong> the final hazard map depicts<br />
zones <strong>of</strong> Vel)! Low, Low, Moderate,<br />
<strong>and</strong> High potential for earthquakeinduced<br />
slope instability.<br />
The map is intended to help<br />
guide regional decisions by planners,<br />
emergency management <strong>of</strong>ficials,<br />
<strong>and</strong> others responsible for<br />
planning <strong>and</strong> implementing measures<br />
aimed at minimizing potential<br />
loss <strong>of</strong> life <strong>and</strong> property damage<br />
from future earthquake events.<br />
BACKGROUND<br />
Salem is the third largest city in<br />
<strong>Oregon</strong>. As population growth has<br />
exp<strong>and</strong>ed city boundaries, new development<br />
has spread into the<br />
marginal, steeper areas south <strong>of</strong><br />
downtown Salem, including the<br />
Salem Hills area, <strong>and</strong> is expected to<br />
accelerate. Slope instability hazards<br />
are <strong>of</strong> particular concern in the area.<br />
Several rainfall-induced slides have<br />
recently caused damage to development<br />
in the study region. Extensive<br />
portions <strong>of</strong> the Salem Hills vicinity,<br />
particularly along the north <strong>and</strong><br />
west flanks, are characterized by<br />
jumbled, "hummocky" terrain that<br />
resulted from major historical l<strong>and</strong>slide<br />
events. These features are a<br />
noteworthy reminder that the area<br />
has been unstable in the past <strong>and</strong><br />
that portions will inevitably move<br />
again in the future.<br />
This project focuses on seismic<br />
slope stability hazards in the Salem<br />
study area. The <strong>Oregon</strong> Emergency<br />
Management Office has received<br />
funding from the Federal Emergency<br />
Management Agency (FEMA) for a<br />
complementary project to evaluate<br />
rainfall-induced l<strong>and</strong>slide hazards in<br />
the Salem Hills. That funding is being<br />
used by DOGAMI, the City <strong>of</strong> Salem,<br />
<strong>and</strong> Marion County to study the hazards<br />
in the Salem area <strong>and</strong> develop<br />
mitigation measures to reduce future<br />
losses. The characterization <strong>of</strong> precipitation-induced<br />
l<strong>and</strong>slide hazards was<br />
contracted to Squier Associates, a<br />
geotechnical engineering firm based<br />
in Lake Oswego, <strong>Oregon</strong>. Results<br />
have been released as DOGAMI Interpretive<br />
Map Series map IMS-6<br />
(Harvey <strong>and</strong> Peterson , 1998), a generalized<br />
hazard map depicting relative<br />
hazard zones from 1 to 6 (low to<br />
high susceptibility) <strong>and</strong> associated<br />
text outlining development recommendations<br />
for each zone (Harvey<br />
<strong>and</strong> Peterson, 1998).<br />
The study region used for this<br />
study <strong>of</strong> earthquake-induced slope<br />
instability includes the area analyzed<br />
for rainfall-induced l<strong>and</strong>slide hazards,<br />
<strong>and</strong> the two maps should serve as<br />
useful complements for evaluating<br />
critical hazard areas in the Salem<br />
vicinity.<br />
This project builds upon previous<br />
earthquake hazard mapping in the<br />
Salem area published by DOGAMI in<br />
1996 (Wang <strong>and</strong> Leonard, 1996).<br />
The Wang <strong>and</strong> Leonard analysis included<br />
an evaluation <strong>of</strong> ground shaking<br />
amplification, l<strong>and</strong>slide, <strong>and</strong> liquefaction<br />
hazards in the Salem East<br />
<strong>and</strong> Salem West 7 VI- minute quadrangles.<br />
Those quadrangles overlap<br />
the northern portion <strong>of</strong> the region<br />
evaluated in this new study. The<br />
l<strong>and</strong>slide hazard categories in the<br />
Wang <strong>and</strong> Leonard project were<br />
purely a function <strong>of</strong> calculated slope<br />
angles. In addition to e)(p<strong>and</strong>ing the<br />
geographic area mapped, the current<br />
study bolsters the slope stability portion<br />
<strong>of</strong> the earlier analysis by augmenting<br />
topographic data with soil<br />
property <strong>and</strong> other physical data to<br />
55
1 O-mt'lcr SIOI"-· Grill<br />
OREGON GEOLOGY, VOLUME 61, NUMBER 3, MAY/JUNE 1999<br />
Soils Layer<br />
Salem Hills Slope Map<br />
. .. ,<br />
43.8463<br />
);)038<br />
7.0763<br />
,"'"<br />
(Units: Degrees)<br />
u l ",<br />
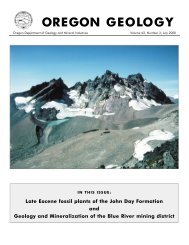
11 Above:<br />
Figure 7: Slope map for the Salem<br />
Hills study area.<br />
¢:: left:<br />
Figure 8: Schematic <strong>of</strong> the GIS<br />
overlay operation to create a single<br />
database with slope geology <strong>and</strong><br />
soils data stored at grid pOints with<br />
10-meter spacing.<br />
Database with Slope <strong>and</strong> Material Properties<br />
61
(Continued from page 59)<br />
A more detailed discussion <strong>of</strong> analyses<br />
performed <strong>and</strong> equations used for<br />
the analyses <strong>of</strong> lateral spread, soil<br />
slide, <strong>and</strong> rock slope is found in the<br />
respective sections <strong>of</strong> DOGAMI Special<br />
Paper 30 (H<strong>of</strong>meister, 1999).<br />
SUMMARY OF RESULTS<br />
The relative hazard map <strong>of</strong> earthquake-induced<br />
slope instability <strong>of</strong> the<br />
Salem Hills vicinity (shown in Figure<br />
9) is the combination <strong>of</strong> the lateral<br />
spread, soil slide, <strong>and</strong> steep slope<br />
analysis maps, The overall map delineates<br />
hazard zones, using a simple,<br />
relative scale from "Very Low" to<br />
" High. " The hazard ratings in the<br />
Salem Hills portion <strong>of</strong> the study area<br />
are governed primarily by the soil<br />
slide <strong>and</strong> the rock slope susceptibility<br />
ratings. For the more gently sloping<br />
alluvial deposits in the low-lying areas,<br />
the hazard ratings primarily re <br />
flect the lateral spread hazard ratings.<br />
The relative nature <strong>of</strong> the hazard<br />
ratings needs to be emphasized. Developing<br />
the scale <strong>of</strong> hazard zones<br />
includes using potential earthquake<br />
scenarios <strong>and</strong> includes a number <strong>of</strong><br />
regional assumptions. The extent <strong>and</strong><br />
severity <strong>of</strong> slope instability that occurs<br />
during an actual earthquake depends<br />
. on the size <strong>and</strong> location <strong>of</strong> the event.<br />
A hazard rating <strong>of</strong> "high" does not<br />
necessarily mean that a slope will fail<br />
in any earthquake, <strong>and</strong> a rating <strong>of</strong><br />
"very low" does not mean that there<br />
is no potential for movement. In a<br />
large earthquake event, there may, in<br />
fact, be instability in zones <strong>of</strong> moderate,<br />
low, <strong>and</strong> very low hazard as well<br />
as in a high hazard zone. In small<br />
earthquakes, only slight damage may<br />
occur even in zones <strong>of</strong> high hazard.<br />
In general, however, one would expect<br />
a higher percentage <strong>of</strong><br />
earthquake-induced ground failures<br />
in "high" zones than in the "moderate,"<br />
"low" <strong>and</strong> "very low" zones<br />
in any given earthquake event.<br />
While a relative hazard map cannot<br />
serve as a replacement for sitespecific<br />
studies in critical areas, it can,<br />
<strong>and</strong> should, serve as a useful tool for<br />
estimating the regional impact <strong>of</strong> tu-<br />
62<br />
ture earthquake events. Creation <strong>of</strong><br />
a regional hazard map is an initial<br />
step, which ideally is followed by<br />
hazard mitigation programs that focus<br />
eHorts on the higher risk areas.<br />
Realistic evaluations <strong>of</strong> relative hazards<br />
are vital for planning <strong>and</strong> development,<br />
for emergency response<br />
management. as inputs for damage<br />
<strong>and</strong> loss estimations, <strong>and</strong> in making<br />
informed l<strong>and</strong> use decisions. Potential<br />
users may include public policy<br />
makers, l<strong>and</strong> use planners, civil engineers,<br />
developers, insurance adjusters,<br />
public safety oHicials, home<br />
owners, <strong>and</strong> home buyers, to name<br />
a few.<br />
The Salem area is growing at a<br />
rapid rate; some predict it may soon<br />
surpass Eugene to become <strong>Oregon</strong>'s<br />
second-mast-populated urban area.<br />
In recent years, residential <strong>and</strong> commercial<br />
development has steadily<br />
exp<strong>and</strong>ed southward, <strong>and</strong> this<br />
study covers an area that is likely to<br />
experience increased development<br />
in the near future. This map is intended<br />
to be used in conjunction<br />
with other available resources to<br />
make informed decisions regarding<br />
regional development as well as<br />
retr<strong>of</strong>it or other mitigation measures<br />
to limit loss <strong>of</strong> life <strong>and</strong> property damage<br />
in future earthquake events .<br />
The Keefer <strong>and</strong> Wang (1997)<br />
methodology, slightly modified for<br />
this study, proves to be one <strong>of</strong> the<br />
most promising approaches available<br />
for the accurate mapping <strong>of</strong><br />
earthquake-induced slope instability<br />
hazards within reasonable time <strong>and</strong><br />
cost limits. The successful completion<br />
<strong>of</strong> this study advances the ongoing<br />
efforts by DOGAMI to map<br />
hazards in major population areas<br />
statewide. A mapping project is<br />
now underway in Klamath Falls,<br />
<strong>and</strong> future studies are expected in<br />
Klamath <strong>and</strong> Tillamook Counties.<br />
ACKNOW LEDGM ENTS<br />
, have benefited from the expertise,<br />
advice <strong>and</strong> encouragement <strong>of</strong><br />
many people. I <strong>of</strong>fer special thanks<br />
to the entire staff at DOGAMI for<br />
generously providing expertise <strong>and</strong><br />
resources, particularly to Yumei Wang<br />
<strong>and</strong> Gerald Black, who made this<br />
project happen , I am grateful to Dale<br />
Carlson <strong>and</strong> the rest <strong>of</strong> the Vane<br />
Scholarship personnel for their generous<br />
financial support <strong>of</strong> the original<br />
study. I am also very grateful to University<br />
<strong>of</strong> Washington Pr<strong>of</strong>essors Pedro<br />
Arduino, Robert Holtz, Steven<br />
Kramer, <strong>and</strong> Teresa Taylor for their<br />
valuable insight <strong>and</strong> mentorship<br />
throughout my graduate studies, <strong>and</strong><br />
to Stanford Pr<strong>of</strong>essors Ronalda Borja,<br />
Anne Kiremidjian, Gordon Brown,<br />
<strong>and</strong> David Pollard for laying the<br />
groundwork in my undergraduate<br />
studies. I would also like to thank<br />
David Keefer <strong>of</strong> the USGS. Andrew<br />
Harvey <strong>of</strong> Squier Associates. George<br />
Freitag <strong>of</strong> Geotechnical Resources.<br />
Inc., <strong>and</strong> WilJiam Leonard <strong>of</strong> AGRA<br />
Earth & Environmental, each <strong>of</strong> whom<br />
provided valuable technical insight. I<br />
appreciate the critical data assistance<br />
I received from Br<strong>and</strong>i Baird <strong>of</strong> the<br />
USDA Natural Resource Conservation<br />
Service, Loren MelJ <strong>of</strong> Group Health<br />
Cooperative, Tim Spear <strong>of</strong> the <strong>Oregon</strong><br />
<strong>Department</strong> <strong>of</strong> Corrections, <strong>and</strong><br />
Stephanie King <strong>of</strong> the Blume Earthquake<br />
Engineering Center. FinalJy, I<br />
wish to thank Robert Murray for his<br />
help with field outcrop mapping <strong>and</strong><br />
David Keefer for reviewing this paper.<br />
REFERENCES CITED<br />
Bartlett, S.F., <strong>and</strong> Youd, T.L., 1995, Empirical<br />
prediction <strong>of</strong> liquefaction-induced<br />
I",teral spread : Journal <strong>of</strong> Geotechnical<br />
Engineering, v. 121, no. 4, p. 316-329.<br />
Bela. H .. 1981. <strong>Geology</strong> <strong>of</strong> the Rickreall,<br />
Salem West, Monmouth, <strong>and</strong> Sidney<br />
7'11' quadrangles, Marion, Polk, <strong>and</strong><br />
Linn Counties, <strong>Oregon</strong> : <strong>Oregon</strong> <strong>Department</strong><br />
<strong>of</strong> <strong>Geology</strong> <strong>and</strong> <strong>Mineral</strong> <strong>Industries</strong><br />
Geological Map Series GM$-<br />
18, 1 :24,000.<br />
Black, G.l., Wang, Z .. Wiley, T.J.. Wang,<br />
Y., <strong>and</strong> Keefer, D.K., 1999, Relative<br />
earthquake hazard map <strong>of</strong> the<br />
Eugene-Springfield metropolitan area,<br />
Lane County, <strong>Oregon</strong>: <strong>Oregon</strong> <strong>Department</strong><br />
<strong>of</strong> <strong>Geology</strong> <strong>and</strong> <strong>Mineral</strong> <strong>Industries</strong><br />
Interpretive Map Series 1M$-<br />
11, 1 :24,000.<br />
Burns, S.F., Caldwell, R.R., Mulder, R.A. ,<br />
Madin, I.P., <strong>and</strong> Mabey. M.A., 1992,<br />
Mapping geological earthquake hazards,<br />
Salem, <strong>Oregon</strong>: Association <strong>of</strong><br />
Engineering Geologists annual meet-<br />
OREGON GEOLOGY, VOLUME 61, NUMBER 1, MAY/J UNE 1999
Field guide to the Rattlesnake Tuff <strong>and</strong> High lava Plains<br />
near Burns, <strong>Oregon</strong><br />
by M
canism <strong>of</strong> the High lava Plains is<br />
about one tenth the volume <strong>of</strong> that <strong>of</strong><br />
the Snake River-Yellowstone trend<br />
according to the relative volume <strong>of</strong><br />
ash-flow sheets.<br />
The High lava Plains are also an<br />
important structural boundary. Northnortheast-strikingBasin-<strong>and</strong>-Rangestyle<br />
block faults die out northward in<br />
southeastern <strong>Oregon</strong> <strong>and</strong> intersect<br />
steep, northwest-striking faults. The<br />
Brothers fault zone is a concentration<br />
<strong>of</strong> such northwest-striking faults. It<br />
transects the High lava Plains<br />
obliquely to the trend <strong>of</strong> the silicic<br />
vents . Several parallel fault zones<br />
have been identified (Figure 1), but<br />
the Brothers fault zone is the only one<br />
to have Quaternary volcanic expression<br />
. The age <strong>of</strong> the Brothers fault<br />
zone is not known . Faults <strong>of</strong>fset Pleistocene<br />
<strong>and</strong> some Quaternary basalt<br />
flows, but alignment <strong>of</strong> silcic vents<br />
suggests an older, subparallel, structural<br />
grain. Along the Snake River<br />
Yellowstone trend, episodes <strong>of</strong> faulting<br />
migrate with the advance <strong>of</strong> volcanism<br />
. The regional work to demonstrate<br />
such a relationship for the High<br />
lava Plains has not been done, but<br />
movement <strong>of</strong> the Steens Mountain<br />
range-front fault is in part synchronous<br />
with 11-Ma-old silicic volcanism<br />
in the eastern High l ava Plains<br />
(Johnson <strong>and</strong> Deino, 1994).<br />
The Rattlesnake Tuff, defined as<br />
the Rattlesnake Ash-Flow Tuff by<br />
Walker (1979), is one <strong>of</strong> the several<br />
ash-flow sheets that crop out widely<br />
in southeastern <strong>Oregon</strong> <strong>and</strong> are part<br />
<strong>of</strong> the High lava Plains silicic trend.<br />
The largest <strong>of</strong> these tuffs are the<br />
Devine Canyon, Prater Creek, <strong>and</strong><br />
Rattlesnake Tuffs, 9.68±0.03,<br />
8.48::!:0.05, <strong>and</strong> 7.05±0.01 Ma, respectively,<br />
which have inferred<br />
sources in the Harney Basin (eastern<br />
High lava Plains) (Walker, 1970;<br />
Macleod <strong>and</strong> others, 1976; Streck<br />
<strong>and</strong> Grunder, 1995; Grunder <strong>and</strong><br />
Deino, unpublished data). Other tuffs<br />
have been identified to the west .<br />
They appear to be fewer <strong>and</strong> smaller.<br />
No caldera structures have been identified.<br />
OREGON GEOLOGY, VOLUME 61, NUMBER 1, MAY/JUNE 1999<br />
REGIONAL TREN DS OF THE HIGH<br />
l AVA PLAINS<br />
Age progression<br />
Additional dating <strong>of</strong> silicic centers<br />
<strong>of</strong> the High lava Plains bears out the<br />
age progression <strong>of</strong> Macleod <strong>and</strong> others<br />
(1976) (Figure 2). New .oAr/'Ar<br />
ages are typically at the old end <strong>of</strong><br />
published ranges <strong>of</strong> ages . We have<br />
identified more dacite centers older<br />
than the age progression, <strong>and</strong> Iron<br />
Mountain is anomalously young.<br />
There is no compelling argument for<br />
a change in rate, mainly because the<br />
endpoint <strong>of</strong> the silicic volcanism can<br />
be identified at Newberry volcano or<br />
at the South Sister volcano in the<br />
Cascades. Trends in the age distribution<br />
<strong>of</strong> basalts is less clear. There are<br />
basalts both older <strong>and</strong> younger than<br />
the rhyolites all along the High Lava<br />
Plains.<br />
Compilation <strong>of</strong> existing data suggests<br />
that mafic volcanism preceeded<br />
northwestward-younging silicic volcanism<br />
by as much as a million years<br />
<strong>and</strong> that it persisted afterwards. The<br />
youngest mafic volcanism may be a<br />
continuation or a rejuvenation <strong>of</strong><br />
magmatism.<br />
Compositional trends<br />
Although most <strong>of</strong> the rhyolites<br />
have over 74 weight percent Si0 2 ,<br />
there is remarkable diversity in composition.<br />
Each center has its own<br />
characteristics <strong>and</strong> petrologic history.<br />
Strongly peralkaline rhyolites appear<br />
to be restricted to the area close to<br />
long 120" W. Interestingly, strongly<br />
peralkaline rhyolites (pantelierites)<br />
occur to the south at Hart Mountain;<br />
they are about 26 myoid (Mathis,<br />
1993). Within individual centers,<br />
compositional variation <strong>of</strong> the rhyolites<br />
is best accounted for by crystal<br />
fractionation (Maclean, 1994; Johnson,<br />
1995; Streck <strong>and</strong> Grunder,<br />
1997). Rhyolites from eastern Harney<br />
Basin to Duck Creek Butte (about 11-<br />
8 Ma) typically have lower Zr/ Nb <strong>and</strong><br />
Y / Nb <strong>and</strong> higher Ce/ Yb than do rhyolites<br />
<strong>of</strong> western Harney Basin (about<br />
8-5 Ma), except for the highest silica<br />
rhyolites in which zircon fractionation<br />
has lowered Zr/ Nb. Basalts have the<br />
same trend, but for the cases studied,<br />
rhyolites do not appear to be derived<br />
by crystal fractionation from basalt.<br />
Instead, it is possible that rhyolites are<br />
derived by partial melting <strong>of</strong> crust that<br />
has Zr/ Nb imparted by basalt, which<br />
in tum varies regionally.<br />
Sparse isotopic data for basalts indicate<br />
a westward decrease in 87Sr/<br />
u Sr across the Harney Basin from values<br />
around 0.704 to 0.703 (Carlson<br />
<strong>and</strong> Hart, 1987). Rhyolites have values<br />
close to basalts with the exception<br />
<strong>of</strong> the highest silica rhyolite at Duck<br />
Creek Butte <strong>and</strong> the Rattlesnake Tuff,<br />
which have slightly elevated values<br />
around 0.705, indicating some other<br />
crustal influence. Such rhyolites are<br />
low in Sr (a few to a few tens <strong>of</strong><br />
ppm), <strong>and</strong> so they are sensitive to<br />
shifts in 81Sr/86Sr.<br />
Intermediate-composition rocks are<br />
few but ubiquitous. They are derived<br />
chiefly by mixing between silicic <strong>and</strong><br />
mafic melts as in the case <strong>of</strong> Duck<br />
Creek Butte (Johnson, 1995), western<br />
Juniper Ridge (Maclean, 1994), the<br />
Rattlesnake Tuff (Streck, 1994; Streck<br />
<strong>and</strong> Grunder, 1999) <strong>and</strong> Newberry<br />
volcano (Linneman <strong>and</strong> Myers, 1990).<br />
At Duck Creek Butte, the rate <strong>of</strong> mixing<br />
<strong>and</strong> eruption exceeded the rate <strong>of</strong><br />
production <strong>of</strong> silicic melt <strong>and</strong> was<br />
likely linked to concurrent fault activity<br />
along the north end <strong>of</strong> the Steens<br />
escarpment. At eastern Juniper Ridge,<br />
intermediates are derived by combined<br />
crystal fractionation <strong>of</strong> basalt<br />
<strong>and</strong> assimilation <strong>of</strong> silicic melts<br />
(Maclean, 1994). Several mafic an <br />
desites have, or trend toward, high Fe<br />
<strong>and</strong> P <strong>and</strong> have extreme trace element<br />
enrichments (best exemplified<br />
by Paiute Butte). These are most succesfully<br />
modeled as derived from<br />
mafic magma chambers that were repeatedly<br />
recharged <strong>and</strong> fractionated<br />
(Grunder <strong>and</strong> others, 1995; Streck<br />
<strong>and</strong> Grunder, 1999).<br />
Working model<br />
Our working model proposes that<br />
age -progressive silicic volcanism <strong>and</strong><br />
related basaltic activity <strong>of</strong> the High<br />
lava Plains represent the westward<br />
propagation <strong>of</strong> Basin <strong>and</strong> Range ex-<br />
"
w<br />
z<br />
o<br />
N<br />
-l<br />
<br />
I<br />
0...<br />
o<br />
I<br />
I<br />
-l<br />
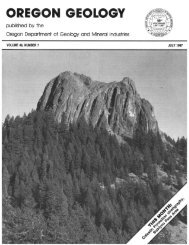
Lilhosp hysae in<br />
devilrified mal fix<br />
Spheruli ti c mal rix<br />
Perl il Ie black mal rix<br />
Surge deposit; clear glass shards<br />
Tuffaceous sed imentary rocks<br />
Figure 5. Outcrop photograph <strong>and</strong> line drawing <strong>of</strong> zonal variations in tuff at Stop1 on Hwy 395.<br />
195 kml (Greene, 1973). It is characterized<br />
by 10-30 percent phenocrysts<br />
<strong>of</strong> alkali feldspa r <strong>and</strong> quartz. with<br />
sparse clinopyroxene. It varies from<br />
non welded to densely welded ; most<br />
commonly it occurs as greenish -gray<br />
glassy or stony devitrified tuff. Thickness<br />
is - 30 m near the type section<br />
about 0.5 km northeast <strong>of</strong> the can ·<br />
fluence <strong>of</strong> the canyon with Poison<br />
Creek <strong>and</strong> corresponds to observed<br />
maximal thicknesses (Greene, 1973).<br />
4OAr/9 Ar age <strong>of</strong> 9.68±O.03 Ma was<br />
obtained from sanidine separates<br />
(Deino <strong>and</strong> Grunder, unpublished<br />
data). At this location, the tuff is partially<br />
welded <strong>and</strong> pumice rich, with<br />
pumices up to 30 cm in diameter.<br />
Prater Creek Tuff<br />
The Prater Creek Tuff is mainly a<br />
devitrified, crystal-poor ash-flow tuff.<br />
Exposures <strong>of</strong> the type section (des-<br />
70<br />
ignated by Walker, 1979) can be<br />
seen from Hwy 395 on the walls <strong>of</strong><br />
Poison Creek, where the maximum<br />
thickness is 12 m. Lithologic variations<br />
can be seen in reference sections<br />
in Prater Creek. about 5 km<br />
east <strong>of</strong> Poison Creek. The type section<br />
consists chiefly <strong>of</strong> pale grayishred,<br />
devitrified tuff with grayish <br />
pink gas cavities to - 2 cm in diam <br />
eter. Flattened, devitrified pumice<br />
fragments are present throughout<br />
but are not abundant. Alkali<br />
feldspar <strong>and</strong> quartz are sparse, <strong>and</strong><br />
the tuff contains rare lithic fragments<br />
(Walker, 1979). Devitrified<br />
whole-rock tuff gave an age <strong>of</strong><br />
8.48 ± O.05 Ma (Dei no <strong>and</strong> Grunder,<br />
unpublished data).<br />
Rattlesnake Tuff<br />
This is nonwelded to densely<br />
welded pumice-rich to ash -rich tuff<br />
with spherulitic, lithophysal, devitrified<br />
<strong>and</strong> vapor-phase crystallization<br />
zones . The phenocryst content is
ter <strong>of</strong> 20 km (d. Smith, 1979). Several<br />
source areas have been proposed,<br />
aU lying within the Harney<br />
Basin. Walker (1969) <strong>and</strong> Parker<br />
(1974) proposed the Buzzard Creek<br />
area, based on rheomorphic featu res<br />
interpreted as venting features.<br />
Walker (1970, 1979) proposed a<br />
caldera under Harney Lake. MacLeod<br />
<strong>and</strong> ot hers (1976) favored a site in<br />
the western Harney Basin based on<br />
the clustering <strong>of</strong> silicic domes <strong>of</strong> simi <br />
lar age.<br />
The source area <strong>of</strong> the Rattlesnake<br />
Tuff (Figure 3) was chosen to be consistent<br />
with the areal distribution, distribution<br />
<strong>of</strong> facies within the tuff, increasing<br />
pumice size toward the vent,<br />
<strong>and</strong> flow direction indicators in the<br />
tuff (Streck <strong>and</strong> Grunder, 1995). The<br />
pumice-size data locations were<br />
compared for all proposed source areas,<br />
<strong>and</strong> the best mathematical fit for<br />
the sou rce area is "Capehart Lake"<br />
located in the western Harney Basin<br />
(18 km south-southwest <strong>of</strong> the town<br />
<strong>of</strong> Riley, i.e., in the flat between the<br />
panoramic view point (Stop 3] <strong>and</strong><br />
the town <strong>of</strong> Wagontire along Hwy<br />
395). This area is almost identical<br />
with the source area proposed by<br />
MacLeod <strong>and</strong> others (1976), based<br />
on the regional age distribution pattern<br />
<strong>of</strong> silicic volcanism <strong>and</strong> suggested<br />
by magnetic anisotropy patterns<br />
within the tuff that are thought<br />
to be related to flow during deposition<br />
(Stimac, 1996).<br />
DIRECTIONS TO STOP 4<br />
Continue west on Hwy 20 to Silver<br />
Creek Road - 1.7 mi west <strong>of</strong> the<br />
Riley Post Office <strong>and</strong> turn right<br />
(north) . At intersection with Oakerman<br />
lane (- 1.5 mil turn left. Road<br />
wraps around - 15 Ma <strong>and</strong>esite volcano<br />
Dry Mountain. Drive - 15.5 mi<br />
to junction <strong>of</strong> Forest Service Roads<br />
45 <strong>and</strong> 4130 at confluence <strong>of</strong> Silver<br />
<strong>and</strong> Wickiup Creeks. Turn left onto<br />
Road 45. Make stops along the route<br />
cautiously.<br />
Prominent outcrop in the conflu <br />
ence is Stop 4a. Outcrop on west<br />
side <strong>of</strong> road, 0 .6 mi from intersection<br />
is Stop 4b; - 1 mi further at junction<br />
72<br />
b<br />
I<br />
- 1<br />
. c<br />
(<br />
Figure 8. Overview <strong>of</strong> area around Stop 4 (4d not visible behind 4c). View is<br />
to the northwest from Forest Service Road 45, about 1 mi south <strong>of</strong> the<br />
intersection <strong>of</strong> Forest Service Roads 45 <strong>and</strong> 4130. All rim rocks in the picture are<br />
Rattlesnake Tuff.<br />
<strong>of</strong> Roads 45 <strong>and</strong> 4535, rim rock at<br />
south waJl is Stop 4c, north wall is<br />
Stop 4d (Figure 8).<br />
Important: Part <strong>of</strong> this area is<br />
private l<strong>and</strong>, with right <strong>of</strong> entry<br />
by permission <strong>of</strong> l<strong>and</strong>owner only<br />
(Ranch to the north <strong>of</strong> Stop 4a)]<br />
STOP 4. EXTREME LOCAL FACIES<br />
VARIATIONS<br />
Strong local facies variations observable<br />
at Stop 4 are found at various<br />
places throughout the vast ignimbrite<br />
sheet but are strongest<br />
near the vent area . Stop 4 is an example<br />
for this (Figure 8).<br />
Stop 4a consists <strong>of</strong> 16-m·thick,<br />
mainly incipiently welded RST with<br />
large pumices (average maximum<br />
pumice - 35 cm).<br />
Outcrop at Stop 4b shows exposure<br />
<strong>of</strong> basal contact with underlying<br />
tuffaceous sedimentary rocks ;<br />
there, RST grades from non welded<br />
to densely welded lower vitric zone<br />
overlain by pervasively devitrified<br />
zone . RST outcrop at Stop 4c includes<br />
lower partially welded zone<br />
with pumice (- 1 m) overlain by<br />
zone that is partially welded with fi <br />
amme, in turn overlain by 7 m <strong>of</strong><br />
black vitrophyre. The base is not exposed.<br />
Upper hackly jointed devitrified<br />
tuff is marked by sharp, commonly<br />
planar, transition . On north<br />
wall <strong>of</strong> road junction (Stop 4d), devitrified<br />
part <strong>of</strong> RST outcrop includes<br />
dominantly hackly jointed<br />
tuff intermixed with portions <strong>of</strong> lithophysal<br />
tuff (lithophysae in devitrified<br />
matrix).<br />
DIRECTIONS TO STOP 5<br />
Drive west on Forest Service Road<br />
4535 for - 2.5 mi to first dirt road on<br />
left. Park <strong>and</strong> walk to outcrop north<br />
<strong>of</strong> intersection.<br />
STOP 5. RHEOMORPHIC SAND<br />
WICH SECTION<br />
The more than 30 m <strong>of</strong> RST visible<br />
here consist <strong>of</strong> - 20 m <strong>of</strong> rheomorphic<br />
tuff that is s<strong>and</strong>wiched between<br />
lower <strong>and</strong> upper normal (non folded)<br />
tuff (Figure 9). lower half <strong>of</strong> outcrop<br />
is devitrified rheomorphic tuff. Folding<br />
in the middle part <strong>of</strong> this zone is<br />
steeP.ly inclined with isoclinal fold<br />
hinges. The upper <strong>and</strong> lower parts <strong>of</strong><br />
this zone exhibit more open fold hinges<br />
w ith less steep inclination . Pumice,<br />
best observed along base <strong>of</strong> outcrop,<br />
is flattened but not strongly stretched<br />
despite pronounced foliation.<br />
Basal contact can be inferred from<br />
rare float <strong>of</strong> undeformed lower vitric<br />
tuff found along base <strong>of</strong> exposure<br />
<strong>and</strong> from lower open fold hinges .<br />
Upper half <strong>of</strong> outcrop is undeformed<br />
RST, with crystallization facies grading<br />
from a lithophysal zone with devitrified<br />
matrix to a pervasively devitrified<br />
zone <strong>and</strong> to a capping microcrystalline<br />
vapor-phase zone.<br />
Note that macroscopic axio/itk<br />
structures are well-developed in<br />
OREGON GEOLOGY, VOLUME 61, NUMBER 3, MAY/JUNE 1999
l , . mxln vapor phase<br />
de vi trified zone<br />
figure 9 . Outcrop photo <strong>of</strong> Stop 5 showing facies boundaries (dashes) <strong>and</strong> orientations <strong>of</strong> flow foliations (arrows). One<br />
isoclinal fold hinge is indicated (U-shape). Abbreviations <strong>of</strong> crystallization facies as in Figure 4.<br />
some fiamme. particularly near the<br />
top <strong>of</strong> the section.<br />
DIRECTIONS TO STOP 6<br />
Return to intersection <strong>of</strong> Roads 45<br />
<strong>and</strong> 4130. Go east on Road 4130<br />
-9.2 mi to Egypt Well. Turn right<br />
(south) on Road 4135 <strong>and</strong> drive 1.7<br />
mi to fork in road; take left fork.<br />
Road 4120. for 2.8 mi to outcrop<br />
that is - 0.7 mi up Curly Canyon<br />
from intersection <strong>of</strong> Roads 4120 <strong>and</strong><br />
4126.<br />
Edi tor's note: The name "Curly<br />
Canyon" appears only on the 1995<br />
map <strong>of</strong> the Snow Mountain Ranger<br />
District, OchoeD National Forest. On<br />
the Forest Service 1993 "visitors'<br />
map" <strong>of</strong> the Ochoco National Forest<br />
<strong>and</strong> on the U.S. Geological Survey·s<br />
7'11-minute map <strong>of</strong> the Egypt Canyon<br />
quadrangle (1992). the canyon is<br />
identified as the continuation <strong>of</strong> Dick<br />
Miller Canyon.<br />
OREGON GEOLOGY, VOLUME 61 , NUMBER 1, MAY/JUNE 1999<br />
STOP 6. CURLY CANYON SEC·<br />
nON<br />
Almost exclusively rheomorphic<br />
RST; locally overlain by undeformed<br />
lithophysal tuff. pervasively devitrified.<br />
<strong>and</strong> vapor phase zones. Rheomorphic<br />
tuft is either devitrified.<br />
with vapor phase minerals lining the<br />
elongate openings. or is vitric with<br />
flame-shaped lozenges <strong>of</strong> deformed<br />
pumice. locally, lithophysal tuff is<br />
intercalated with devitrified rheomorphic<br />
tuff. The vitric part, which<br />
is partially to densely welded. occurs<br />
at the top <strong>of</strong> the section, indicating<br />
that it is near the original<br />
top. Although it has eutaxitic structure.<br />
it is not strictly vitroclastic, <strong>and</strong><br />
we interpret the less welded, vitric<br />
tuff as the pumiceous carapace . In<br />
one location, float <strong>of</strong> the vitric tuff is<br />
weathering out <strong>of</strong> the central part <strong>of</strong><br />
the devitrified tuff, which suggests<br />
that the vitric tuff was folded into the<br />
devitrified. Foliation <strong>and</strong> folds are<br />
gen tly inclined at base <strong>and</strong> top <strong>of</strong><br />
tuff. In the central part, foliation is almost<br />
always nearly vertical. Al though<br />
the ba·se is not exposed. fold hinges<br />
at the base <strong>of</strong> the exposure indicate<br />
proximity to basal contact.<br />
Optional addition: Return to<br />
Egypt Well (intersection <strong>of</strong> Roads<br />
4130 <strong>and</strong> 4135). turn right (east).<br />
<strong>and</strong> continue for 1.1 mi to -10-mhigh<br />
outcrop <strong>of</strong> freshly exposed<br />
lithophsal tuff (Iithophysae in devitrified<br />
matrix facies). Note range <strong>of</strong><br />
lithophysae from completely filled to<br />
hollow varieties (d. Figure 11 in<br />
Streck <strong>and</strong> Grunder. 1995). Return to<br />
Egypt Well.<br />
DIRECTIONS TO STOP 7<br />
From Egypt Well. drive back west<br />
for 9.2 mi on Road 4130 to junction<br />
13
with Road 45 <strong>and</strong> Silver Creek Road .<br />
Turn south (left) on Silver Creek Road<br />
toward Highway 20. Stop 7 is 0.6 mi<br />
down Silver Creek Road from the in <br />
tersection. Park in turn-out on the<br />
east side <strong>of</strong> the road.<br />
Important: Please leave lithicenriched<br />
zone undisturbed for future<br />
visitors.<br />
STOP 7. ASH-RICH SECTION<br />
Nonwelded to partially welded<br />
ash-rich section. Basal contact <strong>of</strong> RST<br />
with lithic-enriched zone at contact<br />
This is an unusual section in that it<br />
is pumice poor at this proximal locality.<br />
The color grades upsection from<br />
white to gray. Although part <strong>of</strong> the<br />
color cha nge can be attributed to increased<br />
welding upsection, mostly it<br />
reflects upward increase in the proportion<br />
<strong>of</strong> brown to white shards.<br />
Continue south to Hwy 20 <strong>and</strong><br />
follow it for - 30 mi east back to<br />
Burns.<br />
Oay2<br />
ROUTE AND SCENERY TO STOP 8<br />
From Burns, drive 27 mi west on<br />
Highway 20 to the junction with<br />
Highway 395 at Riley. Drive south on<br />
395.<br />
The small butte just southwest <strong>of</strong><br />
Riley is Shields Butte, a strombolian<br />
basalt cone. Several such cones crop<br />
out near the highway on the way to<br />
Stop 8. The low ridge about a mile<br />
south <strong>of</strong> the junction is the eastern<br />
end <strong>of</strong> 6.87-Ma Juniper Ridge, a silicic<br />
flow <strong>and</strong> dome complex (Mac<br />
Lean, 1994). Note the turn<strong>of</strong>f to the<br />
Northern Great Basin Experimental<br />
Range (a few miles further). We will<br />
return via this road .<br />
The prominent butte on your right<br />
side is Paiute Butte (formerly Squaw<br />
Butte). a basaltic trachy<strong>and</strong>esite with<br />
unusual trace-element enrichments.<br />
The next northwest-trending ridge to<br />
the south is Egli Ridge, composed <strong>of</strong><br />
nearly aphyric rhyolite. The more<br />
massive buttes to the southwest are<br />
Sheep Mountain <strong>and</strong> Wagontire<br />
Mountain, mainly rhyolites. around 7<br />
74<br />
Ma. A rhyolite tuff (ash-trow tuff <strong>of</strong><br />
Wagon tire Mountain) with spectacular<br />
rheomorphic features is exposed<br />
at Wagon tire Mountain<br />
(Walker <strong>and</strong> Swanson, 196B). Part<br />
<strong>of</strong> Wagontire Mountain has a reported<br />
age <strong>of</strong> 14.7 Ma (MacLeod<br />
<strong>and</strong> others, 1976). The all uvial<br />
cover is thin <strong>and</strong> underlain mainly<br />
by Rattlesnake Tuff or basalts,<br />
which make up the rimrocks.<br />
The town <strong>of</strong> Wagon tire-commanly<br />
for sale, population 2, c<strong>of</strong>fee<br />
sold by the hour---is 28 mi south <strong>of</strong><br />
Riley. The plain here is mainly<br />
Rattlesnake Tuff overlain by the<br />
6.87-Ma tuff <strong>of</strong> Buckaroo l ake (first<br />
rimrock above the plain). The buttes<br />
to the south <strong>and</strong> southeast are 15-<br />
Ma dacites called Horsehead Mountain<br />
<strong>and</strong> Uttle Juniper Mountain.<br />
Drive another 15 mi south to ·<br />
ward the town <strong>of</strong> Alkali Lake. The<br />
hills seen to the west as you pass<br />
the junction to Christmas Valley are<br />
Horse Mountain, the most peralkaline<br />
<strong>of</strong> the rhyolite domes. The rim <br />
rock to the east is Rattlesnake Tuff,<br />
locally overlain by tuff <strong>of</strong> Buckaroo<br />
Lake. From the intersection <strong>of</strong> Hwy<br />
395 with Christmas Valley Road. go<br />
- 4.8 mi south <strong>and</strong> take a gravel<br />
road east to the base <strong>of</strong> the cliff<br />
(toward Hotchkiss Cow Camp) .<br />
This is the northern end <strong>of</strong> the<br />
Abert Rim range-front fault escarpment.<br />
At the cow camp, turn south<br />
<strong>and</strong> go about 1 mi. This is Stop 8.<br />
STOP 8. ALKALI RIM SECTION<br />
The prominent rim is the Alkali<br />
Rim fault scarp . The fault scarp is<br />
mainly (-90 percent) rheomorphic<br />
<strong>and</strong> lithophysaJ Rattlesnake Tuff,<br />
reaching the maximum thicknesses<br />
observed throughout the tuff sheet<br />
(-70 m). Primitive tholeiitic basalts<br />
are exposed here underneath, in<br />
(dark layers in upper half <strong>of</strong> escarpment),<br />
<strong>and</strong> above (at northern termination<br />
<strong>of</strong> fault scarp) the Rattlesnake<br />
Tuff. The base <strong>of</strong> the thick,<br />
mainly rheomorphic <strong>and</strong> lithophysal<br />
RST section is exposed <strong>and</strong> can be<br />
observed as very thin white horizontal<br />
b<strong>and</strong>. At the nearby cow<br />
camp. the base <strong>of</strong> Rattlesnake Tuff<br />
overties basalt with a ropy surface<br />
that overlies another ash -flow tuff.<br />
Partially to densely welded vitric zone<br />
<strong>of</strong> Rattlesnake Tuff is extremely thin<br />
(-30 em) <strong>and</strong> s<strong>and</strong>wiched between<br />
nonwelded <strong>and</strong> rheomorphic facies.<br />
Three basalt sills (thin lower, thick<br />
middle. thin upper) intrude (or invade?)<br />
the Rattlesnake Tuff. Near the<br />
northern termination <strong>of</strong> the - 1-mthick<br />
upper sill, pipe vesicles developed<br />
at the top <strong>and</strong> basal contact to<br />
the Rattlesnake Tuff. Intruding features,<br />
ripped <strong>of</strong>f pieces <strong>of</strong> Rattlesnake<br />
Tuff, <strong>and</strong> well-developed vesicle<br />
sheets can be observed along upper<br />
contact <strong>of</strong> the thick middle <strong>and</strong> the<br />
upper sill.<br />
DIRECTIONS TO STOP 9<br />
Drive back north. past Wagontire<br />
to the sign pointing to the U.S. Agricu!tural<br />
Research Service 's Northern<br />
Great Basin Experimental Range . Turn<br />
onto that road that leads northwest.<br />
Continue - 5 mi to Stop 9 to see<br />
some lavas <strong>of</strong> the Juniper Ridge center<br />
<strong>and</strong> Paiute Butte.<br />
After this stop, continue north to<br />
Highway 20, crossing the entire silicic<br />
dome complex <strong>of</strong> Juniper Ridge.<br />
Note: Before you reach Stop 9,<br />
be sure to TURN RIGHT when you<br />
get to the " dead-end " CT-) intersection<br />
in the road. It will lead you<br />
past the Experimental Station.<br />
STOP 9. JUNIPER RIDGE-PAIUTE<br />
SUITE<br />
The small cliff is composed <strong>of</strong> a<br />
dacite lava with several percent phenocrysts.<br />
overlain by an aphyric rhyolite,<br />
both part <strong>of</strong> the Juniper Ridge voleanic<br />
center (Maclean, 1994).<br />
Juniper Ridge (JR) is divided into<br />
two suites <strong>of</strong> rocks designated western<br />
<strong>and</strong> eastern JR based on their position<br />
relative to the northweststriking<br />
Tin Mine fault (TMF in Figu re<br />
10). A diktytaxitic high-alumina<br />
olivine basalt laps onto the north side<br />
<strong>of</strong> the enti re complex. Eastern JR is<br />
elongate. bounded to the northeast<br />
by a fault. Basal aphJ;ric rhyolite (75<br />
percent Si0 1 ) has a Ar/'JAr age <strong>of</strong><br />
OREGON GEOLOGY, VOLUME 61. NUMBER l , MAY/lUHE 1999
Study tip: Earthquake cycles<br />
Bac kground information<br />
Earthquakes occur along faults.<br />
Faults are fractures in the rock below<br />
the Earth's surface, places where two<br />
masses <strong>of</strong> rock separate from each<br />
other, usually by sliding past each<br />
other. The Earth's crust is in motion<br />
(as explained by the theory <strong>of</strong> plate<br />
tectonics). This motion results in<br />
stresses within the Earth. Normally. a<br />
fault is locked or stuck <strong>and</strong> will not<br />
move. However, jf the stresses build<br />
up high enough, the rocks along the<br />
fault will move suddenly. This makes<br />
the rocks "shiver," -<strong>and</strong> that is an<br />
earthquake. Seismologists <strong>and</strong> geologists<br />
have a model for this. For some<br />
faults they believe that the stress<br />
must reach a certain level before it is<br />
high enough to overcome the frictional<br />
resistance to sliding in the fault rocks .<br />
If the stress buildup is continuous, the<br />
earthquakes occur at regular intervals<br />
<strong>and</strong> are part <strong>of</strong> an earthquake cycle.<br />
Seismologists have learned that<br />
some faults are more likely to move<br />
at short intervals, <strong>and</strong> others are<br />
more likely to move at long intervals.<br />
Not all faults fit a cyclic or predictable<br />
pattern, <strong>and</strong> even very cyclical faults<br />
do not always fit a pattern. In general,<br />
however, studies <strong>of</strong> a fault's<br />
earthquake history help geologists<br />
determine how likely it is that an<br />
earthquake may occur in the future.<br />
Parkfield background<br />
This town in central California is located<br />
right on the San Andreas fault.<br />
To attempt to answer the questions<br />
about when, where, how big,<br />
<strong>and</strong> how <strong>of</strong>ten an earthquake will<br />
happen along a fault, scientists look<br />
at the historical record <strong>of</strong> the fault. A<br />
good example <strong>of</strong> this is a segment <strong>of</strong><br />
the San Andreas fault near Parkfield,<br />
the site <strong>of</strong> a moderate earthquake<br />
(about magnitude M6) about every<br />
20 years. Based on the historical<br />
record <strong>and</strong> other evidence, the u.s.<br />
Geological Survey predicted in the<br />
19805 that an earthquake near Parkfield<br />
would occur before the end <strong>of</strong><br />
1993. Although the expected earth-<br />
OREGON GEOLOGY, VOLUME 61, NUMBER 3, MAY/J UNE 1999<br />
quake has yet to occur, Parkfield remains<br />
the most likely site in California<br />
tor a moderate earthquake. A list <strong>of</strong><br />
the dates <strong>of</strong> recent earthquakes<br />
there is shown below. For more information,<br />
look on the web at<br />
http://quake .wr.usgs.gov/QUAKES/<br />
Parkfield/.<br />
Earthquakes near Parkfield, California<br />
1. 1857<br />
2. 1881<br />
3. 1901<br />
4. 1922<br />
5. 1934<br />
6. 1966<br />
To underst<strong>and</strong> the cycle <strong>of</strong> earthquakes<br />
at Parkfield, answer these<br />
questions:<br />
1. What was the shortest time<br />
period between the earthquakes?<br />
2. What was the longest time period<br />
between the earthquakes?<br />
3. Plot these dates on graph paper<br />
<strong>and</strong> draw a straight line on the<br />
graph that best fits the data points.<br />
4. Continue the line on your graph<br />
<strong>and</strong> use it to predict when the next<br />
big earthquake (no. 7) will hit Parkfield.<br />
What year did you get?<br />
5. Calculate the average time between<br />
earthquakes. This is also known as<br />
the average recurrence interval.<br />
6. (a). What is one <strong>of</strong> the least<br />
predictable earthquakes? (Falls farthest<br />
from the line or had a time interval<br />
farthest from average?)<br />
(b) In what year would you predict<br />
this earthquake should have occurred?<br />
7. Looking at your answers to<br />
the above questions, do you think<br />
that this method <strong>of</strong> predicting<br />
earthquakes works in the Parkfield<br />
area? Why or Why not?<br />
When it comes to determining<br />
the earthquake cycle <strong>of</strong> an area,<br />
Parkfield, is an unusual case. Most<br />
areas subject to earthquakes do not<br />
have them this <strong>of</strong>ten or this regu<br />
Jarly. <strong>Oregon</strong> has not had any great<br />
earthquakes (greater than M 7.5) in<br />
historic time (since about 1800). Be-<br />
cause <strong>of</strong> this, we used to think that<br />
<strong>Oregon</strong> did not have much risk <strong>of</strong><br />
earthquakes.<br />
Geologists are just beginning to<br />
learn about the <strong>Oregon</strong> earthquake<br />
cycle from the sedimentary deposits<br />
formed by great Northwest earthquakes.<br />
With this method, the dates<br />
<strong>of</strong> the earthquakes are difficult to determine,<br />
<strong>and</strong> some quakes may be<br />
missed. The table below shows the<br />
approximate dates <strong>of</strong> the last great<br />
earthquakes in <strong>Oregon</strong>.<br />
Cascadia subduction zone earthquakes<br />
1 . 1400 BCE<br />
2 1050 BCE<br />
3. 600 BCE<br />
4. 400<br />
5 750<br />
6 900<br />
7. 1700<br />
To underst<strong>and</strong> the cycle <strong>of</strong> earthquakes<br />
on the Cascadia subduction<br />
zone, answer these questions:<br />
1. What was the shortest time period<br />
between the earthquakes?<br />
2. What was the longest time period<br />
between the earthquakes?<br />
3. Plot these dates on graph paper<br />
<strong>and</strong> draw a straight line on the graph<br />
that best fits the data poin ts .<br />
4. Continue the line on your graph<br />
<strong>and</strong> use it to predict when the next<br />
big earthquake (no. 8) will hit <strong>Oregon</strong>.<br />
What year did you get?<br />
5. Calculate the average time between<br />
earthquakes. This is also known<br />
as the average recurrence interval.<br />
6. Looking at your answers to the<br />
above questions, do you think that<br />
this method <strong>of</strong> predicting earthquakes<br />
works for Cascadia subduction<br />
zone earthquakes? Is it more or<br />
less accurate than in Parkfield?<br />
7. Based on this information,<br />
when do you think the next great<br />
earthquake will occur in <strong>Oregon</strong>? Do<br />
you think an accurate prediction can<br />
be made?<br />
-From 7: A/will, <strong>Oregon</strong> earthquake<br />
<strong>and</strong> tsunami curriculum,<br />
grades 4--6, 1998.<br />
17