


You also want an ePaper? Increase the reach of your titles
YUMPU automatically turns print PDFs into web optimized ePapers that Google loves.
MARKET OVERVIEW CURRENTLY SELLING SOLD OUT ABOUT POLARIS PACIFIC<br />
PAGE 4<br />
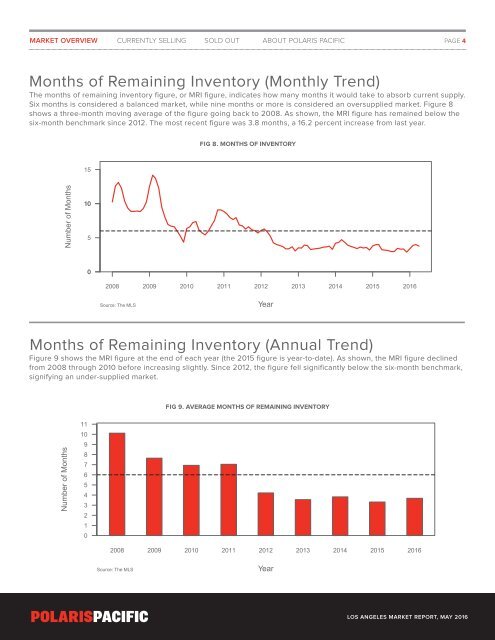
Months of Remaining Inventory (Monthly Trend)<br />
The months of remaining inventory figure, or MRI figure, indicates how many months it would take to absorb current supply.<br />
Six months is considered a balanced market, while nine months or more is considered an oversupplied market. Figure 8<br />
shows a three-month moving average of the figure going back to 2008. As shown, the MRI figure has remained below the<br />
six-month benchmark since 2012. The most recent figure was 3.8 months, a 16.2 percent increase from last year.<br />
FIG 8. MONTHS OF INVENTORY<br />
15<br />
Number of Months<br />
10<br />
5<br />
0<br />
2008 2009 2010 2011 2012 2013 2014 2015 2016<br />
Source: The MLS<br />
Year<br />
Months of Remaining Inventory (Annual Trend)<br />
Figure 9 shows the MRI figure at the end of each year (the 2015 figure is year-to-date). As shown, the MRI figure declined<br />
from 2008 through 2010 before increasing slightly. Since 2012, the figure fell significantly below the six-month benchmark,<br />
signifying an under-supplied market.<br />
FIG 9. AVERAGE MONTHS OF REMAINING INVENTORY<br />
Number of Months<br />
11<br />
10<br />
9<br />
8<br />
7<br />
6<br />
5<br />
4<br />
3<br />
2<br />
1<br />
0<br />
2008 2009 2010 2011 2012 2013 2014 2015 2016<br />
Source: The MLS<br />
Year<br />
LOS ANGELES MARKET REPORT, MAY 2016