LARGE SCALE LAND ACQUISITIONS PROFILE ZAMBIA
1NXFJaR
1NXFJaR

Create successful ePaper yourself
Turn your PDF publications into a flip-book with our unique Google optimized e-Paper software.
<strong>LARGE</strong> <strong>SCALE</strong> <strong>LAND</strong><br />
<strong>ACQUISITIONS</strong> <strong>PROFILE</strong><br />
<strong>ZAMBIA</strong><br />
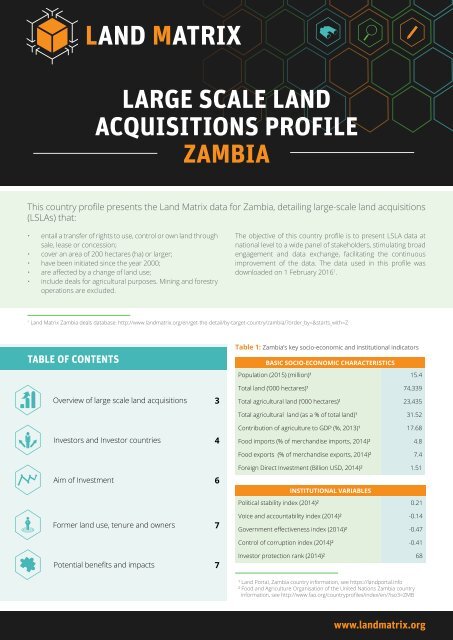
This country profile presents the Land Matrix data for Zambia, detailing large-scale land acquisitions<br />
(LSLAs) that:<br />
• entail a transfer of rights to use, control or own land through<br />
sale, lease or concession;<br />
• cover an area of 200 hectares (ha) or larger;<br />
• have been initiated since the year 2000;<br />
• are affected by a change of land use;<br />
• include deals for agricultural purposes. Mining and forestry<br />
operations are excluded.<br />
The objective of this country profile is to present LSLA data at<br />
national level to a wide panel of stakeholders, stimulating broad<br />
engagement and data exchange, facilitating the continuous<br />
improvement of the data. The data used in this profile was<br />
downloaded on 1 February 2016 1 .<br />
1<br />
Land Matrix Zambia deals database: http://www.landmatrix.org/en/get-the-detail/by-target-country/zambia/?order_by=&starts_with=Z<br />
Table of contents<br />
Overview of large scale land acquisitions<br />
Investors and Investor countries<br />
Aim of Investment<br />
Former land use, tenure and owners<br />
Potential benefits and impacts<br />
3<br />
4<br />
6<br />
7<br />
7<br />
Table 1: Zambia’s key socio-economic and institutional indicators<br />
Basic socio-economic characteristics<br />
Population (2015) (million)¹ 15.4<br />
Total land (‘000 hectares)¹ 74,339<br />
Total agricultural land (‘000 hectares)¹ 23,435<br />
Total agricultural land (as a % of total land)¹ 31.52<br />
Contribution of agriculture to GDP (%, 2013)¹ 17.68<br />
Food imports (% of merchandise imports, 2014)² 4.8<br />
Food exports (% of merchandise exports, 2014)² 7.4<br />
Foreign Direct Investment (Billion USD, 2014)² 1.51<br />
Institutional Variables<br />
Political stability index (2014)² 0.21<br />
Voice and accountability index (2014)² -0.14<br />
Government effectiveness index (2014)² -0.47<br />
Control of corruption index (2014)² -0.41<br />
Investor protection rank (2014)² 68<br />
¹ Land Portal, Zambia country information, see https://landportal.info<br />
² Food and Agriculture Organisation of the United Nations Zambia country<br />
information, see http://www.fao.org/countryprofiles/index/en/?iso3=ZMB<br />
www.landmatrix.org
Chibombo:<br />
Herdon Investments (United<br />
Kingdom of Great Britain)<br />
— 650 ha<br />
Vixers Farming (Zimbabwe)<br />
— 1 200 ha<br />
Choma:<br />
Hawkwood Capital LLC (United<br />
Kingdom of Great Britain)<br />
— 27 087 ha<br />
Munyati Farming Ltd (Zimbabwe)<br />
— 3 500 ha<br />
Nkanga Farms Limited<br />
(Zimbabwe) — 11 000 ha<br />
Kabwe:<br />
Marli Investments (India)<br />
— 12 000 ha<br />
Kafue:<br />
InfraCo Limited (United Kingdom<br />
of Great Britain) — 1 575 ha<br />
Kasama:<br />
Olam International Ltd<br />
(Singapore) — 4 380 ha<br />
NEOS Resources PLC (United<br />
Kingdom of Great Britain)<br />
— 860 ha<br />
Kawambwa:<br />
Agriculture and Rural<br />
Development Authority<br />
(Zimbabwe) — 30 000 ha<br />
Kazungula:<br />
AG-Zam (South Africa)<br />
— 15 000 ha<br />
Lusaka:<br />
Lin Changming (China) — 400 ha<br />
Denbia (Denmark) — 3 000 ha<br />
CONCLUDED AGRICULTURAL <strong>LAND</strong> DEALS IN <strong>ZAMBIA</strong><br />
Mazabuka:<br />
Crookes Brothers Ltd (South<br />
Africa) — 440 ha<br />
Mkushi:<br />
Ambika (Russian Federation)<br />
— 1 700 ha<br />
Agrivision Africa (Pty)<br />
(South Africa) — 4 094 ha<br />
Mpande:<br />
Tiso Blackstar (South Africa)<br />
— 990 ha<br />
Mpika:<br />
Deulco (South Africa)<br />
— 191 103 ha<br />
Mpongwe:<br />
Agrivision Africa (Pty) Ltd<br />
(South Africa) — 12 822 ha<br />
Mumbwa:<br />
Amatheon Agri Holding N.V.<br />
(Germany) — 38 760 ha<br />
Amatheon Agri Holding N.V.<br />
(Germany) — 2 700 ha<br />
Agro Commodities Limited (India)<br />
— 5 000 ha<br />
Nakonde:<br />
Wuhan Kaidi (China) — 4 000 ha<br />
Serenje:<br />
Bonafarm Group (Hungary)<br />
— 10 000 ha<br />
Kalonga Estates:<br />
Emvest (South Africa)<br />
— 2 513 ha<br />
In operation (production) Project not started Startup phase (no production) Project abandoned No information
Overview of large-scale land acquisitions<br />
Table 2: Dynamics of international large-scale land acquisitions according to negotiation status.<br />
Number of<br />
Deals<br />
Intended Size<br />
(ha)<br />
Size under<br />
Contract (ha)<br />
Size under<br />
contract (%<br />
of intended<br />
size)<br />
Concluded (Contract Signed) 24 1 303 916 383 784 29.43<br />
Concluded (Oral Agreement) 2 20 000 5 990 29.95<br />
Concluded 26 1 323 916 389 774 29.44<br />
Intended (Expression of interest) 1 21 000 n.a n.a<br />
Intended (Under Negotiation) 3 108 000 n.a n.a<br />
Intended 4 129 000 n.a n.a<br />
Failed (Negotiations Failed) 3 135 000 0 0.00<br />
Failed (Contract cancelled) 1 1 000 300 30.00<br />
Failed 4 136 000 300 0.22<br />
TOTAL 34 1 588 916 390 074 24.55<br />
• Zambia has a total of 34 LSLA, of which the size under<br />
contract is 390,074ha, representing 1.6% of the total<br />
agricultural land available in Zambia (full intended size was<br />
not acquired)<br />
• The majority of the land deals are concluded; the size under<br />
contract is however significantly smaller than intended size<br />
• Of the intended deals, 2 are likely failed (no further info<br />
since 2011), the remaining two are more recent and can<br />
still be under active negotiation<br />
Table 3: Concluded deals according to implementation status.<br />
Implementation<br />
Status<br />
Number of<br />
concluded deals<br />
Size under<br />
contract (ha)<br />
Average size<br />
under contract<br />
(ha)<br />
Current<br />
size under<br />
production (ha)<br />
Average<br />
size under<br />
production (ha)<br />
Project not started 2 32 700 16 350 n.a n.a<br />
Start-up Phase 2 196 103 98 052 8 o 8<br />
In Operation 15 114 611 7 641 10 006* 1429<br />
Project abandoned 4 26 860 6 715 n.a n.a<br />
No information 3 19 500 6 500 n.a n.a<br />
TOTAL 26 389 774 14 991 10 014 1251<br />
o<br />
N (number of observations) =1 deal,<br />
* N=7 deals<br />
• 65% of the concluded deals are operational (start-up and<br />
in production)<br />
• This being said, the average size under production is less<br />
than 5% of the average size under contract<br />
• 15% of signed projects have been abandoned (the land<br />
ownership might still be with investor)
Figure 2: Concluded deals over time (2000 to 2015)<br />
Size under Contract ‘000 hectares<br />
250<br />
200<br />
150<br />
100<br />
50<br />
0<br />
2000<br />
2001<br />
2002<br />
2003<br />
2004<br />
2005<br />
2006<br />
2007<br />
2008<br />
2009<br />
2010<br />
2011<br />
2012<br />
2013<br />
2014<br />
2015<br />
5<br />
4<br />
3<br />
2<br />
1<br />
0<br />
Number of deals concluded<br />
Year<br />
Size under Contract<br />
Number of deals concluded<br />
• Land deals have been concluded consistently since 2003<br />
• Their pace increased since 2011<br />
• Highest number of deals being concluded was in 2011<br />
and 2014<br />
• Largest size of land was contracted in 2012, totalling 199<br />
577 ha (45% of the total size under contract)- covering only<br />
three deals<br />
Investors and Investor countries<br />
Table 4: Top 10 Investor countries* according to size under contract.<br />
Investor countries<br />
Intended size<br />
(ha)<br />
Size under<br />
contract (ha)<br />
% of land<br />
acquired<br />
Number of<br />
intended deals<br />
Number of<br />
concluded<br />
South Africa 271 878 226 962 83.5 8 7<br />
Zimbabwe 45 700 45 700 100.0 4 4<br />
Germany 62 700 41 460 66.1 2 2<br />
United Kingdom of Great Britain 31 172 30 172 96.8 5 4<br />
India 731 000 17 000 2.3 4 2<br />
Hungary 17 500 10 000 57.1 1 1<br />
United States of America 5 000 5 000 100.0 1 1<br />
China 303 400 4 400 1.5 3 2<br />
Singapore 5 866 4 380 74.7 1 1<br />
Denmark 3 000 3 000 100.0 1 1<br />
* Note: deals with investors from various countries are represented by the investor with the largest share in the deal.<br />
• Overall 32 investors from 14 countries engaged in LSLA in<br />
Zambia<br />
• South African investors have most concluded deals and<br />
largest size under contract<br />
• Indian and Chinese investors have largest share of intended<br />
size but often fail to conclude these plans
Table 5: Dynamics of deals by investor type.<br />
Investor type<br />
Intended size<br />
(ha)<br />
Size under<br />
contract (ha)<br />
% of land<br />
acquired<br />
Number of<br />
intended deals<br />
Number of<br />
concluded<br />
deals<br />
Private Company 384 000 234 594 61.1 10 6<br />
Stock Exchange Listed Company 169 866 47 140 27.8 6 5<br />
Investment Fund 44 600 35 590 79.8 4 4<br />
Individual Entrepreneur 400 400 100.0 1 1<br />
Public Private Partnership 30 000 30 000 100.0 1 1<br />
State-owned 3 000 0 0.0 1 0<br />
Other 5 000 0 0.0 1 0<br />
No Information 952 050 42 050 4.4 10 9<br />
Total 1 588 916 389 774 24.5 34 26<br />
• The investor type of many investors is not clear (lack<br />
of information)<br />
• But, private companies seem to be the major type of<br />
investors, followed by stock-exchange listed companies<br />
Table 6: Involvement of domestic partners.<br />
International<br />
investors<br />
without<br />
domestic<br />
partner<br />
International<br />
investors<br />
with domestic<br />
partner<br />
Total<br />
% with<br />
domestic<br />
partner<br />
Intended size (ha) 653 916 935 000 1 588 916 58.85<br />
Size under contract (ha) 373 774 16 000 389 774 4.1<br />
Intended deals 30 4 34 11.76<br />
Deals under contract 24 2 26 7.69<br />
• Here again, information regarding domestic actors is scarce<br />
• Only a minority of the deals seems to be with domestic<br />
investors<br />
• The size of these projects are smaller (although their<br />
intended size is often high)
Aim of Investment 2<br />
Figure 3: Aim of investment (concluded deals).<br />
Number of Deals<br />
Hectares<br />
4% Agri-unspecified<br />
35% Multiple Uses<br />
Biofuels 15%<br />
39% Multiple Uses<br />
Food Crops 42%<br />
Biofuels 53%<br />
12% Food Crops<br />
0% Agri-unspecified<br />
• The majority of concluded deals aim at food production<br />
and projects with multiple use crops (maize, soybeans, rice,<br />
wheat on irrigated land and cattle on marginal land)<br />
• Despite large number of deals (42%), food crops cover a<br />
small size under contract (12%)<br />
• The largest area under contract is for biofuel crops (53%),<br />
although they concern only small number of projects (15%)<br />
Figure 4: Land acquisitions by category of production, according to implementation status.<br />
250<br />
12<br />
Size under Contract ‘000 hectares<br />
200<br />
150<br />
100<br />
50<br />
10<br />
8<br />
6<br />
2<br />
Number of deals concluded<br />
0<br />
Multi Food Crops Biofuels Agri-unspecified<br />
0<br />
Number of concluded deals<br />
In operation (production)<br />
Project not started<br />
No information<br />
Start-up phase (no production)<br />
Project abandoned<br />
• Most cases producing food crops (64%) or multiple use<br />
crops (70%) are in operation<br />
• Biofuel deals have lowest implementation rate with most<br />
cases being abandoned<br />
2<br />
Intention of investments include: food crops only, biofuel crops only, non-food crops only (e.g. cotton or tobacco) – no reported cases in Zambia, livestock (including fisheries),<br />
forestry – no reported cases in Zambia, agri-unspecified crops which can be used for multiple purposes (mostly palm oil), multiple uses: a combination of the above options.
Former land use, tenure and owners<br />
Table 7: Former land use for concluded deals and deals in implementation.<br />
Former Land Use<br />
Commercial<br />
agriculture<br />
Intended Size (ha)<br />
Size under<br />
contract (ha)<br />
% of land<br />
acquired<br />
Intended deals<br />
Deals under<br />
contract<br />
118 288 89 656 75.8 6 6<br />
Pastoralists 17 500 10 000 57.1 1 1<br />
Smallholder<br />
agriculture<br />
541 103 201 093 37.2 5 4<br />
Conservation 5 000 0 0.0 1 0<br />
No Information 907 025 89 025 9.8 21 15<br />
Total 1 588 916 389 774 24.5 34 26<br />
• Most land concerned by LSLA (intended projects) was<br />
previously used by smallholder communities<br />
• Deals on previously commercial agriculture land have<br />
highest conversion rate<br />
• The former land use is not known for a large number of<br />
cases<br />
Potential benefits and impacts<br />
Table 8: Contract Farming in concluded deals.<br />
Contract Farming Number of deals Number of farmers Contract Size (ha)<br />
Yes 11 26 000 153 600<br />
Not on the lease 9 26 000 # 153 600*<br />
On the lease 0 0 0<br />
No information 2 n.a n.a<br />
No 12 n.a n.a<br />
No Information 3 n.a n.a<br />
#<br />
N=2,* N=4<br />
• Nearly 50% of concluded deals involve contract farmers<br />
and include local farmers, operating their own land, outside<br />
the investor’s lease area<br />
• There is little information on other benefits for local<br />
communities
DATA FIELDS WHICH WERE NOT INCLUDED IN THIS COUNTRY <strong>PROFILE</strong> DUE TO A<br />
LACK OF DATA<br />
Please help us enhance the data, by contributing to the following fields:<br />
• The destination of production from large-scale land deals<br />
• In-country processing activities<br />
• Water usage<br />
• Former Legal Land Owner<br />
• Involvement of the community in pre-contract negotiations<br />
• Number of projects with reported evictions<br />
• Compensation received by communities<br />
• Reported community benefits<br />
• Employment (planned and actual)<br />
View the Zambian database here:<br />
http://www.landmatrix.org/en/get-the-detail/by-target-country/zambia/?order_by=&starts_with=Z<br />
CONTRIBUTE!<br />
The purpose of the Country Profile brief is to enhance<br />
data and data quality. Please help us to achieve this by<br />
directly contributing to www.landmatrix.org<br />
HOW TO CONTRIBUTE<br />
If you would like to comment, contribute to the data or<br />
obtain additional information,<br />
• Contact the Land Matrix directly on<br />
www.landmatrix.org<br />
• Contact the Africa team: africa@landmatrix.org<br />
The LMI partners are:<br />
With the support of:<br />
on behalf of<br />
Contributed to this country profile:<br />
Angela Harding, Wytske Chamberlain, Ikageng Maluleke, Saliou Niassy, Ward Anseeuw, Gaia Manco<br />
FOLLOW THE <strong>LAND</strong> MATRIX:<br />
@Land_Matrix<br />
Land Matrix