Silica Sand Market Market is Growing at a CAGR of Around 4.7% During 2008–2015
According to IMARC group’s latest report “Silica Sand Market – Industry Trends, Manufacturing Process, Plant Setup, Machinery, Raw Materials, Cost and Revenue” the global silica sand production was worth 171 Million Tons with the market growing at a CAGR of around 4.7% during 2008–2015. Read full report here: http://www.imarcgroup.com/silica-sand-manufacturing-plant
According to IMARC group’s latest report “Silica Sand Market – Industry Trends, Manufacturing Process, Plant Setup, Machinery, Raw Materials, Cost and Revenue” the global silica sand production was worth 171 Million Tons with the market growing at a CAGR of around 4.7% during 2008–2015. Read full report here: http://www.imarcgroup.com/silica-sand-manufacturing-plant
Create successful ePaper yourself
Turn your PDF publications into a flip-book with our unique Google optimized e-Paper software.
Imarc<br />
Report Description<br />
www.imarcgroup.com<br />
Report Description and Highlights<br />
7 <strong>Silica</strong> <strong>Sand</strong> Manufacturing Plant: Loans and Financial Ass<strong>is</strong>tance<br />
8 <strong>Silica</strong> <strong>Sand</strong> Manufacturing Plant: Project Economics<br />
8.1 Capital Cost <strong>of</strong> the Project<br />
8.2 Techno-Economic Parameters<br />
8.3 Product Pricing<br />
8.4 Income Projections<br />
8.5 Expenditure Projections<br />
8.6 Financial Analys<strong>is</strong><br />
L<strong>is</strong>t <strong>of</strong> Figures<br />
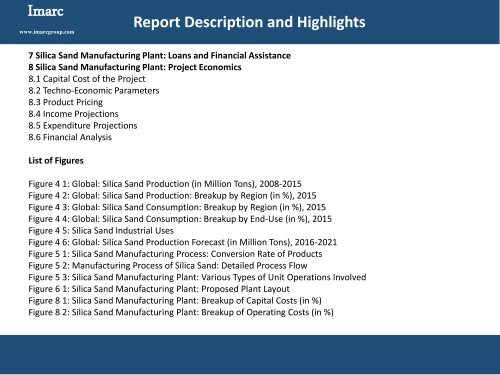
Figure 4 1: Global: <strong>Silica</strong> <strong>Sand</strong> Production (in Million Tons), 2008-2015<br />
Figure 4 2: Global: <strong>Silica</strong> <strong>Sand</strong> Production: Breakup by Region (in %), 2015<br />
Figure 4 3: Global: <strong>Silica</strong> <strong>Sand</strong> Consumption: Breakup by Region (in %), 2015<br />
Figure 4 4: Global: <strong>Silica</strong> <strong>Sand</strong> Consumption: Breakup by End-Use (in %), 2015<br />
Figure 4 5: <strong>Silica</strong> <strong>Sand</strong> Industrial Uses<br />
Figure 4 6: Global: <strong>Silica</strong> <strong>Sand</strong> Production Forecast (in Million Tons), 2016-2021<br />
Figure 5 1: <strong>Silica</strong> <strong>Sand</strong> Manufacturing Process: Conversion R<strong>at</strong>e <strong>of</strong> Products<br />
Figure 5 2: Manufacturing Process <strong>of</strong> <strong>Silica</strong> <strong>Sand</strong>: Detailed Process Flow<br />
Figure 5 3: <strong>Silica</strong> <strong>Sand</strong> Manufacturing Plant: Various Types <strong>of</strong> Unit Oper<strong>at</strong>ions Involved<br />
Figure 6 1: <strong>Silica</strong> <strong>Sand</strong> Manufacturing Plant: Proposed Plant Layout<br />
Figure 8 1: <strong>Silica</strong> <strong>Sand</strong> Manufacturing Plant: Breakup <strong>of</strong> Capital Costs (in %)<br />
Figure 8 2: <strong>Silica</strong> <strong>Sand</strong> Manufacturing Plant: Breakup <strong>of</strong> Oper<strong>at</strong>ing Costs (in %)


