FD
gvti301SEaf
gvti301SEaf

Create successful ePaper yourself
Turn your PDF publications into a flip-book with our unique Google optimized e-Paper software.
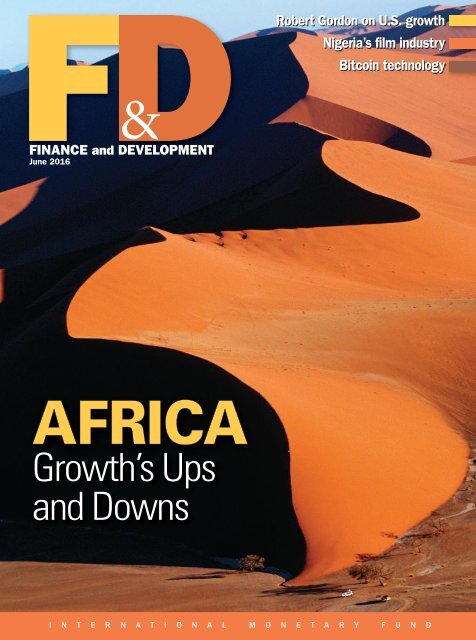
<strong>FD</strong><br />
FINANCE and DEVELOPMENT<br />
June 2016<br />
Robert Gordon on U.S. growth<br />
Nigeria’s film industry<br />
Bitcoin technology<br />
AFRICA<br />
Growth’s Ups<br />
and Downs<br />
I N T E R N A T I O N A L M O N E T A R Y F U N D
EDITOR-IN-CHIEF: Jeffrey Hayden<br />
MANAGING EDITOR: Marina Primorac<br />
SENIOR EDITORS<br />
Gita Bhatt<br />
Jacqueline Deslauriers<br />
Natalie Ramírez-Djumena<br />
James L. Rowe, Jr.<br />
Rani Vedurumudi<br />
ONLINE EDITOR: Ismaila Dieng<br />
ASSISTANT EDITORS<br />
Eszter Balázs Bruce Edwards<br />
Maureen Burke Nadya Saber<br />
PRINT/WEB PRODUCTION SPECIALIST<br />
Lijun Li<br />
SENIOR EDITORIAL ASSISTANT<br />
Niccole Braynen-Kimani<br />
EDITORIAL ASSISTANT: Robert Newman<br />
COPY EDITOR: Lucy Morales<br />
CREATIVE DIRECTOR: Luisa Menjivar<br />
SENIOR GRAPHIC ARTIST: Michelle Martin<br />
ADVISORS TO THE EDITOR<br />
Bernardin Akitoby Thomas Helbling<br />
Bas Bakker Laura Kodres<br />
Helge Berger Gian Maria Milesi-Ferretti<br />
Paul Cashin Inci Otker-Robe<br />
Adrienne Cheasty Laura Papi<br />
Luis Cubeddu Uma Ramakrishnan<br />
Alfredo Cuevas Abdelhak Senhadji<br />
Marcello Estevao Janet Stotsky<br />
Domenico Fanizza Alison Stuart<br />
James Gordon Natalia Tamirisa<br />
© 2016 by the International Monetary<br />
Fund. All rights reserved. For permission<br />
to reproduce any F&D content, submit<br />
a request via online form (www.imf.<br />
org/external/terms.htm) or by e-mail<br />
to copyright@imf.org. Permission for<br />
commercial purposes also available from<br />
the Copyright Clearance Center (www.<br />
copyright.com) for a nominal fee.<br />
Opinions expressed in articles and other<br />
materials are those of the authors; they<br />
do not necessarily reflect IMF policy.<br />
Subscriber services, Changes of address,<br />
and Advertising inquiries<br />
IMF Publication Services<br />
Finance & Development<br />
PO Box 92780<br />
Washington, DC, 20090, USA<br />
Telephone: (202) 623-7430<br />
Fax: (202) 623-7201<br />
E-mail: publications@imf.org<br />
Finance & Development<br />
is published quarterly by the International<br />
Monetary Fund, 700 19th Street NW,<br />
Washington DC 20431, in English, Arabic,<br />
Chinese, French, Russian, and Spanish.<br />
English edition ISSN 0145-1707<br />
<strong>FD</strong><br />
FEATURES<br />
AFRICA: GROWTH’S UPS AND DOWNS<br />
6 Africa’s Rise—Interrupted?<br />
The region’s future depends on much more<br />
than fluctuations in commodity prices<br />
Steven Radelet<br />
12 Straight Talk: Time for a Policy Reset<br />
Sub-Saharan Africa’s economies face severe<br />
strains and must take action<br />
to reignite sustainable growth<br />
Antoinette M. Sayeh<br />
14 Cashing In on the Digital Revolution<br />
Digitization makes finance accessible, lowers costs,<br />
and creates opportunity<br />
Njuguna Ndung’u, Armando Morales, and<br />
Lydia Ndirangu<br />
18 Inching toward Integration<br />
A new index allows African countries to see how their regional integration<br />
FINANCE & DEVELOPMENT A QUARTERLY PUBLICATION<br />
OF THE INTERNATIONAL MONETARY FUND<br />
June 2016 • Volume 53 • Number 2<br />
efforts stack up<br />
Carlos Lopes<br />
22 In the Driver’s Seat<br />
Gender equality can boost growth in sub-Saharan Africa<br />
Christine Dieterich, Dalia Hakura, and Monique Newiak<br />
25 After Ebola<br />
African countries have made some progress in improving<br />
health systems, but holes remain<br />
Amanda Glassman<br />
26 Impediment to Growth<br />
Africa’s inadequate infrastructure limits the continent’s<br />
economic progress, but funding roads, ports, and power<br />
projects is difficult<br />
Amadou Sy<br />
28 A Fork in the Road<br />
China’s new growth strategy could hurt Africa’s commodity-dependent<br />
economies<br />
Wenjie Chen and Roger Nord<br />
30 Runaway Success<br />
Nigeria’s film industry is taking off<br />
Steve Omanufeme<br />
22<br />
6<br />
14<br />
26<br />
Postmaster: send changes of address to<br />
Finance & Development, International<br />
Monetary Fund, PO Box 92780, Washington,<br />
DC, 20090, USA. Periodicals postage<br />
is paid at Washington, DC, and at<br />
additional mailing offices.<br />
The English edition is printed at Dartmouth<br />
Printing Company, Hanover, NH.<br />
ALSO IN THIS ISSUE<br />
33 Off Its Pinnacle<br />
Is the United States entering a period of sustained<br />
low economic growth?<br />
Robert J. Gordon<br />
38 Neoliberalism: Oversold?<br />
Instead of delivering growth, some neoliberal policies have increased<br />
inequality, in turn jeopardizing durable expansion<br />
Jonathan D. Ostry, Prakash Loungani, and Davide Furceri<br />
Subscribe online at www.imfbookstore.org/f&d<br />
33
44 The Internet of Trust<br />
Created to bypass banks, bitcoin’s blockchain<br />
technology may end up helping them<br />
Andreas Adriano and Hunter Monroe<br />
48 Guilt by Association<br />
Prejudices sway the debate on using capital<br />
controls to tame the risks of fickle inflows<br />
Atish Rex Ghosh and Mahvash Saeed Qureshi<br />
52 Stagnation Risk<br />
Ongoing economic problems make the euro area<br />
vulnerable to prolonged slow growth<br />
Huidan Lin<br />
DEPARTMENTS<br />
2 People in Economics<br />
Rebel with a Cause<br />
Prakash Loungani profiles<br />
Dani Rodrik, the Harvard<br />
professor whose warnings<br />
about the downsides of<br />
globalization proved prescient<br />
42 Currency Notes<br />
The Future Is Plastic<br />
For countries concerned about the environmental<br />
impact of their currency, a switch to polymer notes<br />
makes sense<br />
Ping Wang<br />
55 Book Reviews<br />
Money Changes Everything: How Finance Made<br />
Civilization Possible, William N. Goetzmann<br />
Taxing the Rich: A History of Fiscal Fairness in the<br />
United States and Europe, Kenneth Scheve and<br />
David Stasavage<br />
The Sharing Economy: The End of Employment<br />
and the Rise of Crowd-Based Capitalism, Arun<br />
Sundararajan<br />
Illustration: p. 25, Thinkstock; p. 26, Thinkstock; p. 43, ThinkStock; p. 49, Cecile<br />
Samuels/Multimedia Services.<br />
Photography: cover, Hoberman Collection/Getty; p. 2, Michael Spilotro/<br />
IMF; pp. 6–7, Ralf Hirschberger/dpa/Corbis; p. 8, Melanie Stetson Freeman/<br />
The Christian Science Monitor/Getty; p. 10, Dean Hutton/Bloomberg via<br />
Getty Images; p. 12, Stephen Jaffe/IMF photo, p. 14, Karen Kasmausaki/<br />
Corbis; p. 18, Riccardo Gangale/Bloomberg via Getty Images; p. 22, Flurina<br />
Rothenberger; p. 28, Tong Jiang/imaginechina/AP photo; p. 30, Florian<br />
Plaucheur/Getty; p. 32, Pius Utomi Ekpei; p. 33, Bettmann/contributor; pp. 34–<br />
35, Thinkstock; p. 37, Bernard Gotfryd/Getty; p. 37, Brendan Smialowski/AFP/<br />
Getty; p. 38, Bloomberg; p. 42–43, Banknote images used with the permission<br />
of the Bank of Australia, Reserve Bank of Vanuatu, and Bank of Canada;<br />
p. 44, Jin Lee/Bloomberg via Getty Images; p. 47, Chris Ratcliffe/Bloomberg/<br />
Getty; p. 52, Herman Lumanog; pp. 55–57, Ryan Rayburn/IMF photo.<br />
Read online at www.imf.org/fandd<br />
2<br />
FROM FROM THE THE EDITOR<br />
Africa Pausing<br />
STRONG performance by many African economies<br />
over the past two decades led some commentators<br />
to coin the term “Africa Rising” to describe the region’s<br />
surging economic power.<br />
The term graced the cover of TIME magazine in December<br />
2012, in an issue that chronicled the region’s decadeslong<br />
journey from economic anemia to impressive vigor.<br />
Beginning in the mid-1990s, many—but certainly not all—<br />
countries in sub-Saharan Africa energized their economies,<br />
achieving in recent years some of the world’s highest growth.<br />
Living standards improved as a result, as did health care and<br />
other key services, inspiring hope for a bright future.<br />
The past year has been harsh, however, as the region suffered<br />
a sharp slowdown, owing to slumping commodity<br />
prices and softer global economic conditions. Drought has<br />
struck in some countries. And China—now a major trade<br />
and business partner in a number of African countries—is<br />
slowing as it retools its economy, sparking fears of further<br />
weakening. A wave of pessimism is taking hold, prompting<br />
some to wonder if the Africa Rising story has come to an end.<br />
This issue of F&D looks at this critical moment for Africa<br />
and brings together articles suggesting that many countries<br />
are well positioned to ride out this storm despite the toughest<br />
conditions in a decade. Our writers express hope that strong<br />
growth will resume, albeit with a pause or two along the way.<br />
In his overview, Georgetown University’s Steven Radelet<br />
documents changes that leave Africa better positioned to<br />
handle this downturn. Marked improvements in governance,<br />
the emergence of more adroit leaders and economic managers,<br />
and better economic and social policies are a solid foundation<br />
for future growth. Although likely to slow in the next<br />
few years, he says, the long-term outlook for growth is solid for<br />
countries that diversify their economies, increase competitiveness,<br />
and further strengthen their institutions of governance.<br />
Antoinette Sayeh, head of the IMF’s African Department,<br />
sounds a similar note in her Straight Talk column, arguing<br />
that the underlying drivers of growth over the past decade<br />
still persist and that a reset of monetary and fiscal policies<br />
can help reignite sustainable growth in the region.<br />
Other articles in our Africa feature look at sources of future<br />
growth: digital technologies that increase access to financing,<br />
regional economic agreements that foster closer business<br />
ties, increased women’s participation in the workforce,<br />
and a focus on improving infrastructure and health care. We<br />
also take a look at a sector that exemplifies Africa’s growing<br />
influence and economic energy: Nigeria’s film industry,<br />
or “Nollywood,” one of the world’s largest film industries in<br />
terms of number of films produced.<br />
Elsewhere in this issue, we are pleased to offer an article<br />
on U.S. growth by Robert J. Gordon, whose recent book, The<br />
Rise and Fall of American Growth, has stirred much thought<br />
about the prospects for a long period of muted growth in the<br />
United States. Finally, Prakash Loungani profiles iconoclastic<br />
economist Dani Rodrik.<br />
Jeffrey Hayden<br />
Editor-in-Chief<br />
Finance & Development June 2016 1
PEOPLE IN ECONOMICS<br />
Prakash Loungani<br />
profiles Dani Rodrik,<br />
the Harvard professor<br />
whose warnings about the<br />
downsides of globalization<br />
proved prescient<br />
Rebel<br />
with a<br />
Cause<br />
THE triumph of markets over the<br />
state appeared almost complete<br />
in the early 1990s. The collapse<br />
of the Soviet Union and the fall of<br />
the Berlin Wall had discredited the role of<br />
the state in commanding the economic and<br />
political life of citizens. The political scientist<br />
Frank Fukuyama proclaimed in 1992<br />
that the spread of democracy and capitalism<br />
around the globe would henceforth make<br />
history somewhat “boring.” Among economists,<br />
markets—already held in fairly high<br />
regard—gained further esteem. Prominent<br />
left-leaning economists like Larry Summers<br />
admitted to a “grudging admiration” for such<br />
champions of the global spread of free markets<br />
as Milton Friedman.<br />
But Harvard economist Dani Rodrik<br />
refused to join the party. Instead, he warned<br />
that globalization—the process of economic<br />
integration of nations through trade and<br />
finance—may have gone too far. In a 1997<br />
monograph, he said there was a “yawning<br />
gap” between the rosy view of globalization<br />
held by economists and “the gut instincts<br />
of many laypeople” to resist it. In the United<br />
States, he noted, “a prominent Republican,”<br />
Pat Buchanan, had just run “a vigorous campaign<br />
for the presidency on a plank of economic<br />
nationalism, promising to erect trade<br />
barriers and tougher restrictions on immigration”<br />
(themes pushed two decades later by<br />
Republican Donald Trump in his campaign<br />
for the 2016 presidential nomination).<br />
Rodrik’s warnings that the benefits of free<br />
trade were more apparent to economists<br />
than to others were prescient. His skepticism<br />
about the benefits of unfettered flows<br />
of capital across national boundaries is now<br />
conventional wisdom. His successful attack<br />
on the so-called Washington Consensus of<br />
policies to generate economic growth has<br />
made governments and international organizations<br />
like the IMF and the World Bank<br />
admit that there are many policy recipes<br />
that can generate growth. That the phrase<br />
2 Finance & Development June 2016
“one size does not fit all” has become a cliché is due in no<br />
small part to the influence of Rodrik’s work. “We didn’t<br />
understand how right he was,” says David Wessel, a former<br />
Wall Street Journal economics writer now at the Brookings<br />
Institution’s Hutchins Center.<br />
Inside the ivy tower<br />
Rodrik has spent most of his professional life at Ivy League institutions.<br />
He has a bachelor’s degree from Harvard and master’s<br />
and PhD degrees from Princeton, followed by a teaching<br />
career at Harvard and Columbia.<br />
He was able to go from his native Turkey to Harvard<br />
because of his father’s success as a businessman. Like many<br />
countries in the 1970s, Turkey followed a policy of import<br />
substitution—imposing tariffs to keep out imports and substitute<br />
domestic products. Protected by these tariffs, his<br />
father’s ballpoint pen company was successful enough that<br />
Rodrik could contemplate studying in the United States. “I<br />
am the product of import substitution,” Rodrik has said.<br />
On his application to Harvard, he wrote that he wished to<br />
major in electrical engineering, unaware that the school then<br />
did not offer it as a major. Nevertheless, he has since written,<br />
he was admitted because one member of the admissions<br />
committee “somehow saw a flicker of hope” in his application<br />
and pushed his case “over the strenuous objections of others<br />
on the committee.”<br />
Shortly after arriving at Harvard in 1975, he decided to<br />
major in political science—and take a minor in economics<br />
due to his “father’s prodding.” His father, he says, “still had<br />
hopes that I would go to business school and do something<br />
useful in life.” In his senior year at Harvard, still “confused<br />
about his career goals,” he applied to six different graduate<br />
programs—some in economics and business, others in political<br />
science and international relations. He chose a master’s<br />
in public policy at the Woodrow Wilson School at Princeton<br />
and “had a great time,” but realized that he had “simply put<br />
off the decision” of whether to pursue a career in economics<br />
or political science.<br />
He remembers “well what settled it.” One day in the library<br />
he picked up copies of the flagship publications of the two<br />
disciplines, the American Political Science Review and the<br />
American Economic Review. The former was “written in<br />
English, the other in Greek”—that is, liberally sprinkled with<br />
the mathematical equations favored by economists. He says he<br />
realized that “if I did a PhD in economics, I would be able to<br />
read both journals, but that if I did a PhD in political science, it<br />
would be goodbye economics. That was my epiphany.”<br />
He was admitted to the economics department at Princeton<br />
in 1982, a year after his initial application, “more out of compassion<br />
than conviction,” he has written. A member of Princeton’s<br />
faculty, Peter Kenen, “was single-handedly responsible for my<br />
admission.” Some members on the admissions committee had<br />
concerns about Rodrik’s math skills but Kenen, with whom<br />
Rodrik had taken a course as a master’s student, prevailed on<br />
them to give him a chance.<br />
At Princeton, he wrote his dissertation under the noted<br />
economist Avinash Dixit (see “Fun and Games,” in the<br />
December 2010 F&D). “I’ve never seen anybody who’s a<br />
clearer thinker than him,” Rodrik has said. “There’s never<br />
been a paper that I’ve written that I haven’t thought, ‘What<br />
will Dixit think about this?’”<br />
Rodrik’s first job was at Harvard’s Kennedy School of<br />
Government in 1985. Except for stints at Columbia from<br />
1992 to 1996 and, more recently, at the Institute for Advanced<br />
Study in Princeton, New Jersey, he has been at Harvard for<br />
the past three decades. It is from within the confines of this<br />
ivy tower that Rodrik has launched the attacks that have<br />
changed the profession’s views and made his name.<br />
Taking on trade<br />
That there are gains from free trade is a core belief of economists.<br />
Trade theory shows that if countries specialize in making<br />
some products, and then exchange some of those products<br />
through imports and exports, they end up richer than if<br />
each country were to go it alone. But there is a catch. When<br />
the United States decides to specialize in producing Hollywood<br />
movies rather than textiles, its textile workers stand to<br />
lose. Not to worry, trade theorists respond, our analysis shows<br />
that the gains to the Hollywood producers will be sufficient to<br />
make up for the losses of the textile workers.<br />
Rodrik also emphasized that trade<br />
“fundamentally transforms the<br />
employment relationship.”<br />
In practice, though, losers seldom share in the winners’<br />
gains (redistribution in economic parlance). Rodrik says that<br />
“to this day, there is a tendency in the profession to overstate”<br />
the gains from trade while paying lip service to the need for<br />
redistribution. But trade theory shows that “the larger the net<br />
gains, the larger the redistribution [that is needed]. It is nonsensical<br />
to argue that the gains are large while the amount of<br />
redistribution is small.”<br />
In his 1997 monograph, “Has Globalization Gone Too<br />
Far?” Rodrik pointed to the failure to push redistribution<br />
seriously as one reason for the gap between economists and<br />
laypeople in their attitude toward trade.<br />
And he outlined several other tensions created by trade.<br />
Rodrik wrote that trade “is exposing a deep fault line between<br />
groups who have the skills and ability to flourish in global markets”<br />
and those who lack them. Without retraining or education,<br />
the latter would understandably be opposed to free trade.<br />
Rodrik also emphasized that trade “fundamentally transforms<br />
the employment relationship.” If workers can be more easily<br />
substituted for each other across national boundaries, “they<br />
have to incur greater instability in their earnings [and] their<br />
bargaining power erodes.” Trade could also “undermine the<br />
norms implicit” in domestic production, for instance, if child<br />
labor in a foreign producer displaced U.S. workers.<br />
Rodrik concluded that the cumulative consequences of<br />
these tensions could end up “solidifying a new set of class<br />
Finance & Development June 2016 3
divisions” between those who stood to gain from trade and<br />
those who lost out.<br />
The monograph was published by the Institute for<br />
International Economics—now the Peterson Institute—and<br />
has become one of the think tank’s bestsellers. The institute’s<br />
founding director, C. Fred Bergsten (see “An American<br />
Globalist,” in the March 2012 F&D), says that he suggested<br />
the title “instead of the long and technical one that Dani<br />
had.” But Bergsten did more than suggest the title. He also<br />
persuaded his advisory board that the monograph was worth<br />
publishing; several members of the board were opposed to<br />
associating the Institute’s name with an attack on free trade.<br />
Rodrik says that Bergsten deserves credit for backing his<br />
cause when many others were reluctant. But he also credits<br />
a seemingly unlikely institution, the IMF. “Over the years I<br />
have been quite surprised by the assistance I have received<br />
from the IMF,” where he wrote part of the monograph while<br />
a visiting scholar in 1995–96. The Fund is “not exactly the<br />
place you would think the ideas in that book would have necessarily<br />
originated.”<br />
Controls on capital<br />
In October 1997, at its annual meetings in Hong Kong SAR,<br />
the IMF put forward its arguments why countries should<br />
not only lower restrictions on trade but should also move to<br />
relax restrictions on the movement of capital across national<br />
boundaries. Economists refer to the former as current account<br />
liberalization (or convertibility) and the latter as capital<br />
account liberalization or financial globalization. The IMF<br />
asked its member countries to amend the institution’s charter<br />
to give it authority to monitor progress toward capital<br />
account convertibility.<br />
At this time, several Asian economies were engulfed in<br />
a financial crisis that many attributed to the decision to<br />
open up to foreign capital flows. Though this made the<br />
timing of the IMF request awkward, then–First Deputy<br />
Managing Director Stanley Fischer gamely went ahead.<br />
He called capital account liberalization “an inevitable step<br />
on the path of development, which cannot be avoided and<br />
should be embraced.” Fischer noted that this liberalization<br />
ensures that “residents and governments are able to borrow<br />
and lend on favorable terms, and domestic financial markets<br />
become more efficient as a result of the introduction<br />
of advanced financial technologies, leading to better allocation<br />
of both saving and investment.”<br />
Along with Jagdish Bhagwati, a champion of free trade,<br />
and Nobel Prize–winner Joseph Stiglitz, Rodrik spoke up<br />
against this financial globalization. Rodrik argued that the<br />
benefits that Fischer mentioned paled in comparison to the<br />
risks of increased volatility from the entry and exit of foreign<br />
capital. “Boom-and-bust cycles are hardly a sideshow or<br />
a minor blemish in international capital flows; they are the<br />
main story,” he said.<br />
Rodrik also was skeptical of any benefits of long-term capital<br />
moving to the countries where it was most needed. He<br />
argued against IMF insistence that capital accounts could be<br />
liberalized in “an orderly fashion and buttressed by enhanced<br />
prudential regulation of financial practices,” which he said happened<br />
more in textbooks than in the real world. “Enshrining<br />
capital account convertibility in the IMF’s articles of agreement<br />
Two decades later, the time for<br />
capital account liberalization has<br />
still not come.<br />
is an idea whose time has not yet come,” he concluded. “We<br />
have no evidence that it will solve any of our problems, and<br />
some reason to think that it may make them worse.”<br />
Indeed, two decades later, the time for capital account liberalization<br />
has still not come. Evidence has accumulated that<br />
its benefits are difficult to establish, while the costs have been<br />
undeniable. In 2006, a major study coauthored by the IMF’s<br />
then–chief economist Kenneth Rogoff found little evidence<br />
of improved economic performance after a country opens<br />
up to capital flows. Another study found that foreign capital<br />
increases volatility in developing economies. The chief economist<br />
who followed Rogoff, Raghuram Rajan, showed that<br />
countries that grew rapidly relied less, not more, on foreign<br />
capital. In 2009, Rodrik himself wrote in IMF Staff Papers, an<br />
academic journal published by the institution, that “more is<br />
not necessarily better” when it comes to foreign capital flows;<br />
“depending on context and country, the appropriate role of<br />
policy will be as often to stem the tide of capital inflows as to<br />
encourage them” (see Box 1).<br />
Killing the Consensus<br />
In 1989, John Williamson of the Institute for International<br />
Economics put together a list of 10 policy actions he felt summarized<br />
the consensus among major international organizations<br />
on what countries had to do to trigger growth. The<br />
Box 1<br />
Global financial regulation: less is more<br />
The recent global financial crisis turned a harsh spotlight on<br />
the effects of international flows of capital and triggered calls<br />
for a better system of global financial regulation. Predictably,<br />
Dani Rodrik is a lone voice in opposition, writing that “global<br />
financial regulation is neither feasible, nor prudent, nor desirable”<br />
(The Economist, March 12, 2009). He argues that desirable<br />
forms of financial regulation differ across countries and<br />
depend in part on how countries value financial stability<br />
versus financial innovation. The responsibility for regulating<br />
leverage, setting capital standards, and supervising financial<br />
markets should “rest squarely at the national level.” Global<br />
financial firms should have to comply with these national<br />
requirements, just as global manufacturers comply with<br />
product-safety rules that differ across countries. “The world<br />
economy will be far more stable and prosperous with a thin<br />
veneer of international cooperation superimposed on strong<br />
national regulations than with attempts to construct a bold<br />
global regulatory and supervisory framework.”<br />
4 Finance & Development June 2016
term “Washington Consensus”—sometimes also “neoliberal<br />
agenda”—has come to represent a general orientation toward<br />
market-based solutions for growth.<br />
Rodrik has said that “when I first began to criticize the<br />
Washington Consensus, I thought I was doing the obvious.” In a<br />
series of papers and books written during the 1990s and 2000s,<br />
he made three points against the Consensus. First, growth often<br />
happened as a result of “eclectic solutions” that combined the<br />
roles of the market and government. Second, growth was often<br />
triggered by one or a few changes and did not require a “long<br />
checklist” of reforms. Third, there were many pathways to<br />
growth, not a unique set of institutions and reforms.<br />
Rodrik provided many examples of successful industries in<br />
many countries that relied on a combination of market and<br />
state support. “Costa Rica is not a natural place to manufacture<br />
semiconductors,” he noted, but the government “got Intel<br />
to come in and do just that.” He argued that the historical<br />
record did not support assertions that the government cannot<br />
pick winners: “when economists say [this] they are really,<br />
for the most part, doing amateur political science.” What was<br />
more important, he said, was “to design institutions that …<br />
give the government the capacity to let go of the losers.”<br />
Relying on detailed case studies by other scholars, Rodrik<br />
also provided examples of “how little it takes for countries to<br />
suddenly experience a rapid growth spurt.” In Mauritius, it<br />
was the establishment of an export processing zone; in China,<br />
it was the introduction of the household responsibility system<br />
and a two-track price regime; in India it was a change<br />
in the government’s attitude from extreme hostility to being<br />
supportive of entrepreneurship. Hence, transitions to higher<br />
growth did not require a long checklist of actions. Countries<br />
could boost growth by identifying “the binding constraints”<br />
to growth and overcoming them through “well-designed but<br />
relatively minor interventions” (see Box 2).<br />
The case studies also showed there was “very little<br />
in common across [the] policy changes” that triggered<br />
growth, according to Rodrik. This suggested that there<br />
were many ways to grow. Moreover, a look at countries<br />
that were already rich—many in Europe, Japan, and the<br />
United States—showed that “you can end up being wealthy”<br />
despite differences in institutions and policies. Countries<br />
that had gotten richer more recently—those of east Asia in<br />
large part—had “marched to their own drummers and are<br />
hardly poster children for neoliberalism. East Asian countries<br />
would have been far worse off had they encountered<br />
something like the Washington Consensus. China would<br />
have been worse off if it had had no choice but to start the<br />
growth process through a structural adjustment loan from<br />
the World Bank.”<br />
Today, “the Washington Consensus is essentially dead,”<br />
Rodrik says, “replaced by a much more humble approach”<br />
that recognizes “we need a lot less consensus and a lot more<br />
experimentation.”<br />
Box 2<br />
Getting the diagnosis right<br />
With economists Ricardo Hausmann and Andrés Velasco,<br />
Dani Rodrik proposed a framework—called Growth<br />
Diagnostics—to help countries decide which reforms to<br />
pursue for growth. As the trio wrote in a March 2006 F&D<br />
article, countries should figure out a small number of binding<br />
constraints on growth and focus on overcoming those, rather<br />
than tackle a “laundry list of needed reforms.” Applying their<br />
method to El Salvador, they concluded that the binding constraint<br />
on growth was not a shortage of savings but a “dearth<br />
of ideas”: the country’s traditional sectors (such as cotton,<br />
coffee, and sugar) had declined, but no new ideas had sprung<br />
up for other potential investment sectors. They advised that<br />
encouraging more entrepreneurship and new business opportunities<br />
should be “at the center of [El Salvador’s] development<br />
strategy.” The Growth Diagnostics framework has been<br />
used by both the World Bank and the IMF as a complement<br />
to devising growth strategies. For instance, as applied by the<br />
IMF staff to Tunisia in 2016, the framework suggests that lack<br />
of “access to finance” was the binding constraint rather than<br />
infrastructure bottlenecks or a shortage of human capital.<br />
The revolution is over<br />
Andrei Shleifer, a Harvard colleague of Rodrik’s, often used<br />
to greet him in the corridors by asking, “How is the revolution<br />
going?” While there may have been some doubt about<br />
the answer when Rodrik started his Harvard career in 1985, it<br />
is clear three decades later that the revolution has succeeded.<br />
His warnings about the downsides of trade and its potential<br />
to create class divisions have become widely accepted.<br />
Harvard professor and former U.S. Treasury Secretary Larry<br />
Summers wrote in the Financial Times in April 2016 that “the<br />
core of the revolt against global integration … is not ignorance.<br />
It is a sense, not wholly unwarranted, that it is a project<br />
carried out by elites for elites with little consideration for the<br />
interests of ordinary people.”<br />
Rodrik’s caution about financial globalization is now<br />
widely shared, including at the IMF. Jonathan Ostry, an IMF<br />
deputy director who led the institution’s recent research on<br />
capital flows, says: “That Dani and the IMF can now have<br />
useful conversations about the design of capital controls is<br />
tribute both to his persistence and the institution’s flexibility.”<br />
The attacks on the Washington Consensus have led to<br />
greater humility in the advice international organizations<br />
offer countries on growth strategies. Rodrik noted that the<br />
IMF’s 2013 paper on growth strategies made a “plea for contextual<br />
analysis and recipes that sounds, to this set of ears at<br />
least, quite pleasing.”<br />
Rodrik himself seems to have acquired a deeper love of<br />
the profession he has often attacked. After two years at the<br />
Institute of Advanced Study, where his colleagues were<br />
drawn from various social sciences, he decided to return to<br />
the fold. His new book, Economics Rules—short-listed for<br />
the Financial Times’ best book award—tells noneconomists<br />
that “there is much to criticize in economics but there is also<br />
much to appreciate.” ■<br />
Prakash Loungani is a Division Chief in the IMF’s<br />
Research Department.<br />
Finance & Development June 2016 5
Africa’s Rise—<br />
Interrupted?<br />
The region’s<br />
future depends<br />
on much<br />
more than<br />
fluctuations<br />
in commodity<br />
prices<br />
Steven Radelet<br />
IS Africa’s surge of progress over? During<br />
the past two decades, many countries<br />
across the continent changed course and<br />
achieved significant gains in income, reductions<br />
in poverty, and improvements in<br />
health and education. But the recent optimism<br />
seems to have swiftly given way to a<br />
wave of pessimism. Commodity prices have<br />
dropped, the world economy has slowed, and<br />
economic growth has stalled in several sub-<br />
Saharan African countries. If high commodity<br />
prices alone drove recent advances, the<br />
prospects for further gains seem dim.<br />
But the reality is more complex, and the<br />
outlook—especially over the long run—is<br />
more varied than many now suggest. To be<br />
sure, many countries are confronting some of<br />
the most difficult tests they have faced for a<br />
decade or more, and even with sound management,<br />
progress is likely to slow in the next few<br />
years. But for others—especially oil importers<br />
with more diversified export earnings—<br />
growth remains fairly buoyant. At a deeper<br />
level, although high commodity prices helped<br />
many countries, the development gains of the<br />
past two decades—where they occurred—<br />
had their roots in more fundamental factors,<br />
including improved governance, better policy<br />
management, and a new generation of skilled<br />
leaders in government and business, which are<br />
likely to persist into the future.<br />
Managing the global slowdown—alongside<br />
other growing threats such as climate change—<br />
will require strong leadership, forceful action,<br />
and difficult choices. Overall growth is likely<br />
to slow in the next few years. But in the long<br />
run, the outlook for continued broad development<br />
progress is still solid for many countries<br />
in the region, especially those that diversify<br />
their economies, increase competitiveness, and<br />
further strengthen institutions of governance.<br />
Two decades of progress<br />
The recent slowdown follows two decades of<br />
strong progress, at least for many countries,<br />
that began in the mid-1990s and included<br />
faster economic growth, higher incomes, declines<br />
in poverty, widespread improvements<br />
in health and education, and other develop-<br />
Participants in the Absa Cape Epic mountain bike race,<br />
Cape Town, South Africa.<br />
6 Finance 6 & Finance Development & Development June 2016 June 2016
Radelet, corrected 04/19/20106<br />
AFRICA<br />
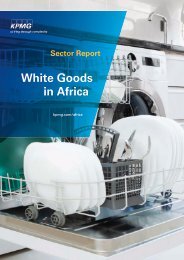
ment gains (see Chart 1). Since 1995<br />
GDP growth across the continent has<br />
averaged about 4.3 percent a year, fully<br />
3 percentage points higher than in the<br />
previous two decades. But it would be<br />
misleading to suggest that rapid growth<br />
rates were universal across the continent.<br />
They varied widely, with about half<br />
the countries in the region moving forward<br />
and others changing little. In the<br />
20 fastest growing countries—excluding<br />
oil exporters—GDP growth averaged<br />
a robust 5.8 percent for two decades,<br />
and real incomes per person more than<br />
doubled. But in other countries, growth<br />
was much slower, and in eight countries,<br />
Chart 1<br />
income per person actually fell. Some of the differences are<br />
stark: in Rwanda real income per person more than doubled; in<br />
Zimbabwe it fell 30 percent.<br />
Where growth accelerated, poverty finally began to fall. The<br />
share of people living in extreme poverty (less than $1.90/day<br />
in constant 2011 prices) dropped from 61 percent in 1993 to<br />
43 percent in 2012, a decline of nearly 1 percentage point a<br />
year for two decades. In some countries (for example, Senegal),<br />
poverty declined even more; in others (Democratic Republic of<br />
the Congo), not at all.<br />
The gains in health were even bigger. Since the mid-<br />
1990s the share of children dying before their fifth birthday<br />
has fallen more than half, from 17 percent to 8 percent.<br />
Remarkably, every single country in sub-Saharan Africa has<br />
reduced child mortality in the past two decades. Malaria<br />
deaths have fallen by half, and deaths related to HIV/AIDS<br />
and tuberculosis have both fallen by one-third. More than<br />
three-quarters of children are enrolled in primary school, up<br />
from just half in the 1980s. More than two-thirds of girls now<br />
complete primary school, which will increase their earning<br />
potential; equally as important, it means that they will have<br />
Two decades of development progress<br />
Incomes have grown, poverty has fallen, and child mortality has declined in sub-Sarahan<br />
Africa.<br />
(GDP per capita, constant 2011 U.S.<br />
dollars, using purchasing-power- (percent of population living on (mortality rate for children<br />
parity prices) less than $1.90/day) under five years old, percent)<br />
4,000<br />
80<br />
20<br />
3,000<br />
2,000<br />
1,000<br />
0<br />
60<br />
40<br />
20<br />
0<br />
0<br />
1994 2014 1994 2014 1994 2014<br />
Source: World Bank, World Development Indicators.<br />
fewer children and that those children will be healthier and<br />
better educated (see “In the Driver’s Seat” in this issue of<br />
F&D). These trends bode well for the future, as they signal<br />
the beginnings of a strong human capital skills base.<br />
Four key forces helped propel the resurgence in the countries<br />
that moved forward.<br />
First, there was a marked improvement in governance, at<br />
least in many countries. According to the U.S. think tank<br />
Freedom House, the number of electoral democracies in<br />
Africa has jumped from just four in 1990 to 23 today. With<br />
democracy came better governance, including more politi-<br />
15<br />
10<br />
5<br />
Finance & Development June 2016 7
Artists work on a mural on the wall of the Canadian Embassy, Accra, Ghana.<br />
cal freedoms, less violence, greater adherence to the rule of<br />
law, stronger public institutions, a better business environment,<br />
and less corruption. The new democracies are far from<br />
perfect, but the differences in the quality of governance are<br />
reflected in the World Bank’s annual Worldwide Governance<br />
Indicators scores. In 2014 the average governance rank for<br />
sub-Saharan Africa’s 23 democracies was the 42nd percentile<br />
globally (ahead of both India and China), while for the nondemocratic<br />
countries it was the 19th percentile (see Chart 2).<br />
A few nondemocratic countries improved governance, but<br />
these are exceptions rather than the rule.<br />
Second, there are more skilled leaders and policymakers. A<br />
new generation of managers, technicians, and entrepreneurs is<br />
rising to the top of government agencies, civil society organizations,<br />
and private businesses. The leaders in central banks and<br />
key government ministries are far better trained, more experienced,<br />
and more capable than their predecessors 20 years ago.<br />
Third, and related, economic and social policies have<br />
improved significantly. Macroeconomic management has<br />
been much more effective, with more flexible exchange<br />
rates, lower inflation, smaller budget deficits, and higher<br />
levels of foreign exchange reserves. Strong state control<br />
has given way to more market-oriented economic systems.<br />
Governments have removed many distortions that hindered<br />
growth, which led to more open trade, greater choice for<br />
farmers when it came to buying inputs and selling their<br />
products, less red tape, and a lower cost of doing business.<br />
It is partly because of these policy improvements that many<br />
countries were able to weather difficult global shocks in<br />
Many countries are confronting<br />
some of their most difficult<br />
challenges in a decade or more.<br />
recent years, including the food crisis of 2007 and the global<br />
financial crisis of 2008–09.<br />
Fourth—the key condition that is now beginning to change—<br />
during much of the past two decades world economic conditions<br />
were generally favorable. Trade expanded rapidly and<br />
with that came access to new technologies and ideas, alongside<br />
bigger markets. China became both a big market for exports<br />
and a major source of investment in many countries. Interest<br />
rates were low, making borrowing for infrastructure projects<br />
far more affordable. And from 2002 through 2014, rising commodity<br />
prices helped the major oil exporters (Angola, Republic<br />
of Congo, Ghana, Nigeria, and others) alongside other resource<br />
exporters, such as Liberia, Namibia, and Zambia. Rising prices<br />
did not help all countries—the majority of African countries are<br />
oil importers that were hurt by higher prices, and many saw relatively<br />
little change in key prices—but commodity prices buoyed<br />
economic activity in much of the region.<br />
In addition to these four key forces, foreign aid played an<br />
important secondary role. Aid was particularly important in<br />
improving health, and helped save millions of lives through<br />
programs that increased access to vaccines, improved child<br />
health, and fought diseases such as tuberculosis, malaria, and<br />
8 Finance & Development June 2016
HIV/AIDS. And the preponderance of academic research in<br />
recent years concludes that aid has helped accelerate growth<br />
on average and consolidate democracy in some countries,<br />
especially since the mid-1990s (for a good recent summary of<br />
this research, see Arndt, Jones, and Tarp, 2015).<br />
The view that Africa’s surge happened only because of the<br />
commodity price boom is too simplistic. It overlooks the acceleration<br />
in growth that started in 1995, seven years before commodity<br />
prices rose; the impact of commodity prices, which<br />
varied widely across countries (and hurt oil importers); and<br />
changes in governance, leadership, and policy that were critical<br />
catalysts for change. This broader understanding of the drivers<br />
of progress is crucial in considering the prospects for the<br />
future: sub-Saharan Africa’s long-term future will not be determined<br />
by the vagaries of the commodity markets alone, but by<br />
how well these and other challenges are managed.<br />
Choppy waters<br />
However, global circumstances have changed significantly,<br />
and many countries are confronting some of their most difficult<br />
challenges in a decade or more. Growth has slowed significantly<br />
around the world, including in several important<br />
export markets. Growth in Europe has slowed sharply, and<br />
the U.S. recovery remains modest. As growth has slowed, so<br />
has trade. World trade expanded by nearly 7 percent a year in<br />
the decade between 1998 and 2007, but since 2012 the pace<br />
has fallen by more than half to just 3 percent a year.<br />
Perhaps most important, China’s growth has dropped to<br />
about 6 percent, well below the pace of recent years. China’s<br />
trade with sub-Saharan Africa exploded from less than $20 billion<br />
in 2003 to more than $170 billion in 2013. But China’s<br />
weakened growth and its efforts to put greater emphasis on its<br />
domestic economy have led to a sharp slowdown in trade with<br />
Africa and a significant contraction in some countries, especially<br />
Angola, the Republic of Congo, Equatorial Guinea, South<br />
Africa, and Zambia—China’s main African trading partners.<br />
The changes are not all negative: the rapid rise in wages in China<br />
creates new opportunities for African countries to expand manufacturing.<br />
But the relationships with China are again changing<br />
rapidly, and managing them carefully will be central to continued<br />
long-term growth in many countries across the region (see<br />
“A Fork in the Road,” in this issue of F&D).<br />
With growth slowing, commodity prices have dropped significantly.<br />
The prices of corn, copper, and cotton have all fallen<br />
by more than 20 percent since 2013, and iron ore and oil prices<br />
have dropped more than 50 percent. These declines have had<br />
a wide-ranging impact on export earnings, budget revenues,<br />
investment, employment, exchange rates, and foreign exchange<br />
reserves. The effects are particularly large in the oil producers<br />
(Angola, Republic of Congo, and Nigeria, among others) and<br />
in countries that export iron ore (Liberia, Sierra Leone, South<br />
Africa), copper (Republic of Congo, South Africa, Zambia),<br />
and diamonds (Botswana, Namibia, South Africa).<br />
Correspondingly, growth in sub-Saharan Africa slowed<br />
from 5 percent in 2014 to 3.5 percent in 2015, and the IMF<br />
projects that it will remain subdued at 3 percent in 2016.<br />
Once again, there is wide variation, with some countries hit<br />
hard and others actually benefiting from price changes (see<br />
Chart 3). Oil exporters have seen the biggest drop in growth,<br />
alongside iron ore, copper, and diamond producers. South<br />
Africa, one of the region’s major economic engines, has been<br />
rocked by drought, falling export prices, and growing political<br />
struggles, and growth is now only about 1 percent. In<br />
Nigeria, the other regional powerhouse, last year’s successful<br />
political transition was followed by immediate challenges<br />
stemming from the steep decline in oil prices, widening fiscal<br />
and trade imbalances, and a hesitant response from policymakers.<br />
Angola, Liberia, and Zambia also have been hit hard.<br />
By contrast, most sub-Saharan African countries are oil<br />
importers, and they have benefited from the drop in fuel<br />
Radelet, corrected 04/15/20106<br />
prices. Some countries, such as CÔte d’Ivoire, have gained<br />
both from a rise in export prices (in this case, cocoa) and the<br />
drop in oil import prices. Similarly, many countries are food<br />
importers and have been helped by the decline in prices for<br />
rice, wheat, and other food products. Countries with more<br />
diversified exports are experiencing a more moderate impact<br />
on export prices, coupled with gains on the import side.<br />
Chart 2<br />
Straight and narrow<br />
Democracy has spread in sub-Saharan Africa, and governance<br />
has improved.<br />
(governance, global percentile ranking,<br />
(number of electoral democracies) 2014)<br />
25<br />
50<br />
20<br />
15<br />
10<br />
5<br />
10<br />
0<br />
1989 Radelet, corrected 99 04/19/20106 0<br />
2009<br />
Sources: Freedom House, Freedom in the World—Electoral Democracies; World Bank<br />
Institute, Worldwide Governance Indicators.<br />
Note: SSA = sub-Saharan Africa.<br />
Chart 3<br />
Downshift<br />
Growth in Africa has slowed, but large differences remain across<br />
countries.<br />
(GDP growth, percent)<br />
7<br />
Oil-importing countries (excluding South Africa)<br />
6<br />
5<br />
4<br />
3<br />
2<br />
1<br />
South Africa<br />
Oil-exporting countries<br />
All SSA<br />
Electoral<br />
democracies<br />
Nondemocracies<br />
Oil exporters<br />
Sub-Saharan Africa<br />
0<br />
2012 13 14 15 16 17<br />
Source: IMF, Regional Economic Outlook: Sub-Saharan Africa, May 2016. Figures for<br />
2016 and 2017 are projections.<br />
40<br />
30<br />
20<br />
Central America<br />
South Asia<br />
Finance & Development June 2016 9
Students working on a science experiment, Mvezo, South Africa.<br />
Kenya, Mozambique, Rwanda, Tanzania, and Uganda are still<br />
expected to grow by 5 percent or more this year.<br />
But countries across the region face several other longterm<br />
challenges, starting with weaknesses in infrastructure<br />
for power, roads, and water (see “Impediment to Growth” in<br />
this issue of F&D). World Bank researchers estimate that infrastructure<br />
deficiencies in Africa have reduced growth by more<br />
than 2 percentage points a year. Only about one-third of rural<br />
Africans live within two kilometers of an all-season road, compared<br />
with two-thirds in other regions. And while many parts<br />
of Africa have abundant water, the lack of water storage and<br />
irrigation facilities undermines economic activity. The impact<br />
of these shortages will only grow as climate change advances.<br />
Demographic shifts present another major test. Sub-Saharan<br />
Africa’s population is projected to climb from 965 million in<br />
2016 to 2.1 billion in 2050. Nigeria alone could have 400 million<br />
people by 2050, more than double its current size. Urban<br />
populations will grow especially quickly, posing major challenges<br />
in job creation, infrastructure, education, health, and<br />
agricultural production. But demographic shifts also provide<br />
an opportunity: history shows that population growth is not<br />
necessarily a constraint on growth. Larger urban populations,<br />
a growing share of working-age people, and increased female<br />
labor force participation all present opportunities to expand<br />
manufacturing and services—much as happened in Asia in<br />
recent decades—especially when accompanied by investment<br />
in infrastructure and education.<br />
Perhaps the most difficult challenge of all will be climate<br />
change. Temperatures in sub-Saharan Africa are expected to<br />
rise between 1.5 and 3 degrees Celsius by 2050, and weather<br />
patterns, temperatures, and rainfall are expected to be more<br />
erratic. There will be myriad effects, including a rise in sea<br />
level in coastal regions, lower water tables, more frequent<br />
storms, and adverse impacts on health. Arguably worst will be<br />
the blow to output and labor productivity in agriculture, the<br />
dominant source of income in Africa, especially for the poor.<br />
The road ahead<br />
Dealing with these challenges will test the skills of Africa’s<br />
new generation of leaders. But once again, the effects are likely<br />
to vary widely: countries with the most diverse export bases<br />
will probably be affected the least, while those with narrow<br />
export bases and weak governance will suffer most. Continued<br />
long-term progress through this challenging period calls<br />
for action in four areas.<br />
First up is adroit macroeconomic management. Widening<br />
trade deficits are putting pressure on foreign exchange<br />
reserves and currencies, tempting policymakers to try to<br />
artificially hold exchange rates stable. Parallel exchange rates<br />
have begun to emerge in several countries. But since commodity<br />
prices are expected to remain low, defending fixed<br />
exchange rates is likely to lead to even bigger and more<br />
difficult exchange rate adjustments down the line. As difficult<br />
as it may be, countries must allow their currencies to<br />
depreciate to encourage exports, discourage imports, and<br />
maintain reserves. At the same time, budget deficits are<br />
widening, and with borrowing options limited, closing the<br />
gaps requires difficult choices. At the core will be the ability<br />
to mobilize domestic resources and increase tax revenues,<br />
which will allow countries to control deficits while financing<br />
critical investments in roads, power, schools, and clinics.<br />
The amounts involved are significant: Every 1 percentage<br />
point increase in revenue as a share of GDP for sub-Saharan<br />
Africa as a whole raises an additional $17 billion a year. In<br />
10 Finance & Development June 2016
some countries, it might make sense to augment domestic<br />
revenue with borrowing, especially for priority infrastructure<br />
projects. But the burden of debt is accelerating, interest rates<br />
are rising, and spreads on sovereign bond issues in Africa are<br />
climbing quickly—putting the brakes on further borrowing.<br />
Second, countries must move aggressively to diversify their<br />
economies away from dependence on commodity exports.<br />
Governments must establish more favorable environments<br />
for private investment in downstream agricultural processing,<br />
manufacturing, and services (such as data entry), which<br />
can help expand job creation, accelerate long-term growth,<br />
reduce poverty, and minimize vulnerability to price volatility.<br />
The effects of the current commodity price shocks are so<br />
large precisely because countries have not diversified their economic<br />
activities. The exact steps will differ by country, but they<br />
Countries must move aggressively to<br />
diversify their economies away from<br />
dependence on commodity exports.<br />
begin with increasing agricultural productivity, creating more<br />
effective extension services, building better farm-to-market<br />
roads, ensuring that price and tariff policies do not penalize<br />
farmers, and investing in new seed and fertilizer varieties.<br />
Investments in power, roads, and water will be critical. As in<br />
east Asia, governments should coordinate public infrastructure<br />
investment in corridors, parks, and zones near population<br />
centers to benefit firms through increased access to electricity,<br />
lower transportation costs, and a pool of nearby workers, which<br />
can significantly reduce production costs. Financing these<br />
investments will require a deft combination of prudent borrowing<br />
mixed with higher domestic revenue. At the same time, the<br />
basic costs of doing business remain high in many countries.<br />
To help firms compete, governments must lower tariff rates,<br />
cut red tape, and eliminate unnecessary regulations that inhibit<br />
business growth. Now is the time to slash business costs and<br />
help firms compete domestically, regionally, and globally.<br />
Third, Africa’s surge of progress cannot persist without<br />
strong education and health systems. The increases in school<br />
enrollment and completion rates, especially for girls, are good<br />
first steps. But school quality suffers from outdated curricula,<br />
inadequate facilities, weak teacher training, insufficient local<br />
control, teacher absenteeism, and poor teacher pay. The coming<br />
years call for dramatic improvement in quality to equip<br />
students—especially girls—with the skills they need to be productive<br />
workers. Similarly, health systems remain weak, underfunded,<br />
and overburdened, as was illustrated so clearly during<br />
the recent Ebola virus disease outbreak (see “After Ebola” in<br />
this issue of F&D). Robust efforts are needed to improve access<br />
to health facilities, train providers, bolster the delivery of basic<br />
health services, and strengthen health systems more broadly.<br />
Fourth, continued long-term progress requires building<br />
institutions of good governance and deepening democracy.<br />
The transformation during the past two decades away from<br />
authoritarian rule is remarkable, but it remains incomplete.<br />
Better checks and balances on power through more effective<br />
legislative and judicial branches, increased transparency and<br />
accountability, and strengthening the voice of the people are<br />
what it takes to sustain progress. Some nondemocratic countries<br />
have done well, but the majority of authoritarian governments<br />
have been governance disasters.<br />
Finally, the international community has an important role to<br />
play. Foreign aid has helped support the surge of progress, and<br />
continued assistance will help mitigate the impacts of the current<br />
slowdown. Larger and longer-term commitments are required,<br />
especially for better-governed countries that have shown a<br />
strong commitment to progress. To the extent possible, direct<br />
budget support will help ease adjustment difficulties for countries<br />
hit hardest by commodity price shocks. In addition, donor<br />
financing for infrastructure—preferably as grants or low-interest<br />
loans—will help build the foundation for long-term growth and<br />
prosperity. Meanwhile, this is not the time for rich countries to<br />
turn inward and erect trade barriers. Rather, wealthy nations<br />
should encourage further progress and economic diversification<br />
by reducing barriers to trade for products from African countries<br />
whose economies are least developed.<br />
It is easy to be pessimistic in the current global economic<br />
environment. But of course, it is always easy to be pessimistic.<br />
Most analysts were negative about Africa’s prospects in<br />
the mid-1990s, just as many countries there were turning<br />
around and beginning to rise. There was further pessimism<br />
during the global food crisis of 2007 and the 2008–09 financial<br />
crisis. But, against all odds, many countries across the<br />
region have experienced a remarkable transformation.<br />
The global slowdown presents major challenges that will<br />
not be easily overcome. Over the next few years, growth will<br />
probably remain moderate across the region, and the pace of<br />
overall development progress is likely to slow. In some countries,<br />
especially those reliant on a few commodity exports,<br />
the slowdown could be quite significant. Policymakers may<br />
not be able to generate rapid growth right away, but they can<br />
do much to keep the slowdown in check and strengthen the<br />
foundation for lasting progress. Looking ahead over a longerterm<br />
horizon, the fundamental improvements under way in<br />
governance, capacity building, and encouraging a new generation<br />
of leaders point to favorable prospects.<br />
With concerted action and courageous leadership, look for<br />
many African countries to continue to make substantial development<br />
progress over the next two decades and further reduce<br />
poverty, improve governance, and expand prosperity. ■<br />
Steven Radelet is Director of the Global Human Development<br />
Program at Georgetown University’s Edmund A. Walsh School<br />
of Foreign Service and author of The Great Surge: The Ascent<br />
of the Developing World.<br />
Reference:<br />
Arndt, Channing, Sam Jones, and Finn Tarp, 2015, “What Is the<br />
Aggregate Economic Rate of Return to Foreign Aid?” World Bank<br />
Economic Review, July, pp. 1–29.<br />
Finance & Development June 2016 11
STRAIGHT TALK<br />
Time for a Policy Reset<br />
Sub-Saharan Africa’s economies face severe strains and<br />
must take action to reignite sustainable growth<br />
Antoinette M. Sayeh is<br />
Director of the IMF’s<br />
African Department.<br />
OVER the past few years, I have<br />
been heartened by the progress on<br />
the ground in sub-Saharan Africa.<br />
Along with the extended period of<br />
strong economic growth of the past 15 years<br />
came improvements in health indicators and<br />
standards of living. Now that the region’s economy<br />
has entered a rough patch, there is a risk<br />
that the progress that has reached so many will<br />
stall. A confluence of external and domestic<br />
factors is exerting severe strain on many countries,<br />
including the largest ones. So to reignite<br />
the engine of sustainable growth that has propelled<br />
the region in the recent past and secure<br />
favorable medium-term prospects, governments<br />
must implement a strong policy reset.<br />
The pace of economic expansion in the<br />
region declined to 3½ percent in 2015, the<br />
slowest in some 15 years. The growth outlook<br />
varies greatly across countries in the region,<br />
but the IMF projects overall growth to slow<br />
further this year to 3 percent—well below<br />
the 6 percent or so observed over the past<br />
decade, and barely above population growth.<br />
Indeed, GDP per capita growth will be under<br />
1 percent for two years in a row for the first<br />
time since the late 1990s.<br />
World of multiple shocks<br />
The slowdown reflects the adverse impact of<br />
the commodity price slump on some of the<br />
larger economies, tighter financing conditions,<br />
and, more recently, the drought in eastern<br />
and southern Africa.<br />
The sharp decline in commodity prices<br />
in recent years has severely strained many<br />
of the largest sub-Saharan African economies.<br />
While oil prices have recovered somewhat<br />
since the beginning of 2016, they are<br />
still some 60 percent below their 2013 peak<br />
levels, a shock of unprecedented magnitude.<br />
As a result, oil exporters such as Nigeria<br />
and Angola, as well as most countries in the<br />
Economic Community of Central African<br />
States, continue to face particularly difficult<br />
economic conditions.<br />
Growth will slow further for the region’s<br />
oil exporters in 2016, to 2¼ percent, from as<br />
high as 6 percent in 2014, according to IMF<br />
projections. For example, growth in Angola<br />
will likely be slowed by limited foreign<br />
exchange supply and lower public spending.<br />
Similarly, in Nigeria, economic activity<br />
is constrained by the lower oil prices and<br />
compounded by disruptions to private sector<br />
activity through exchange rate restrictions.<br />
Unfortunately, nonenergy commodity<br />
exporters, such as Ghana, South Africa, and<br />
Zambia, have also been hurt by the decline<br />
in commodity prices.<br />
The shift in the sources of China’s growth—<br />
from resource-intensive investment and<br />
exports to more domestically driven growth—<br />
is certainly playing a role in the slowdown<br />
experienced by many countries in the region.<br />
During the 2000s, China became the region’s<br />
single largest trade partner, and African countries<br />
have enjoyed a healthy trade surplus<br />
with that country, especially since the global<br />
financial crisis. With the slump in commodity<br />
prices, this has changed dramatically, and<br />
the trade balance has recently turned negative.<br />
These trends are likely to continue to limit<br />
growth over the medium term.<br />
For most of the region’s frontier markets,<br />
external financing conditions have tightened<br />
substantially compared with those before<br />
mid-2014, when markets enjoyed ample<br />
access to global liquidity. At the same time,<br />
some forms of capital flows to the region—<br />
notably, cross-border bank loans, relied on<br />
by more than just frontier markets—have<br />
declined significantly.<br />
And on top of all this, several southern<br />
and eastern African countries are suffering<br />
from a severe drought that is putting millions<br />
12 Finance & Development June 2016
AFRICA<br />
of people at risk of food insecurity. The drought will probably<br />
dampen growth in a number of countries, including Ethiopia,<br />
Malawi, and Zambia, and food inflation is accelerating in<br />
many countries. Humanitarian needs are putting additional<br />
strain on the budgetary and external positions of many of the<br />
affected countries. The impact of the drought varies across<br />
countries, but whenever food security is precarious, there are<br />
severe human costs. And this already tragic situation could<br />
still get a lot worse; a shocking 40 to 50 million people are<br />
likely to be food insecure by the end of 2016.<br />
Strong potential<br />
This confluence of factors is exerting serious headwinds.<br />
But does this mean that the region’s growth momentum has<br />
stalled? I don’t think so—for several reasons.<br />
First, the overall weak picture masks, as usual, widely<br />
varying circumstances—not surprising, given that the<br />
region is home to 45 very diverse countries. Many countries<br />
across the region, notably those with the lowest income,<br />
continue to register robust growth. Most oil importers are<br />
generally faring better, with growth over 5 percent, often<br />
supported by ongoing infrastructure investment and strong<br />
private consumption. For instance, growth in Kenya is projected<br />
to rise to 6 percent in 2016, aided by investment in<br />
the transportation sector, a pickup in electricity production,<br />
and a rebound in tourism. Similarly, Senegal is expected to<br />
see continued strong growth at 6½ percent, supported by<br />
improving agricultural productivity and a dynamic private<br />
sector. In CÔte d’Ivoire, high cocoa prices and good<br />
agricultural production, as well as an anticipated boost<br />
in investment following the recent presidential election,<br />
should drive growth to 8½ percent this year. In some other<br />
countries, such as the Central African Republic, growth<br />
prospects are now rebounding from severe shocks or with<br />
the attenuation of conflict. And the decline in oil prices has<br />
benefited many of these countries, though the drop in other<br />
commodity prices and currency depreciations have partly<br />
offset the gains.<br />
More broadly, the region’s medium-term growth prospects<br />
continue to be favorable. True, the near-term outlook for<br />
many sub-Saharan African countries remains difficult and<br />
clouded by risks. But generally the underlying domestic drivers<br />
of growth over the past decade or so still persist. In particular,<br />
the much improved business environment and favorable<br />
demographics are likely to play an important role in supporting<br />
growth in the coming decades.<br />
Pressing the reset button<br />
While the region’s growth potential remains strong, the current<br />
slowdown highlights that the region is not immune to the<br />
multiple transitions afoot in the global economy. As a result,<br />
to reap the region’s strong potential, a significant policy reset<br />
is critical in many cases. Such a reset is particularly urgent in<br />
two groups of countries—the region’s commodity exporters<br />
and countries with access to international capital markets.<br />
For natural resource exporters, a robust and prompt<br />
shift in policy response is needed given the prospect of an<br />
extended period of sharply lower commodity prices. To<br />
date, commodity exporters—particularly oil exporters—<br />
have generally responded hesitantly and insufficiently to<br />
the historically large terms-of-trade decline they are experiencing.<br />
Faced now with rapidly depleting fiscal and foreign<br />
reserves and constrained financing, they must respond<br />
quickly and strongly to prevent a disorderly adjustment and<br />
to lay the groundwork for a quicker, durable, and inclusive<br />
economic recovery.<br />
For countries that are not part of a monetary union,<br />
exchange rate flexibility should be part of the first line of<br />
defense against commodity price declines, as part of a broader<br />
macroeconomic policy package. Because the fall in revenues<br />
from the extractive sector will likely be long lived, many<br />
affected countries also must contain fiscal deficits and build<br />
a sustainable tax base from the rest of the economy. In their<br />
consolidation efforts, countries should aim to preserve priority<br />
spending, such as social expenditures and growth-friendly<br />
capital investments, also with a view to maintaining their longer-term<br />
development goals.<br />
The region is not immune to the<br />
multiple transitions afoot in the<br />
global economy.<br />
Driven by the favorable external financing environment<br />
of recent years, fiscal and external current account deficits<br />
have grown substantially in many of the region’s frontier<br />
markets, as they sought to strengthen their weak infrastructure,<br />
including roads, railways, and electricity and water<br />
networks. Now that external financing is much tighter,<br />
these countries will need to reduce their fiscal deficits—<br />
depending on the country’s circumstances—either by better<br />
prioritizing spending or by boosting tax revenues. That will<br />
help these countries rebuild cushions against possible worsening<br />
of external conditions.<br />
Indeed, the current challenges sub-Saharan Africa faces<br />
are a sobering reminder of the need to strengthen resilience<br />
against external shocks. Structural measures, such as enhancing<br />
the business climate and improving the quality of public<br />
investment, would nurture the private sector and help diversify<br />
the export base and sources of growth and jobs beyond<br />
commodities. In addition, further developing the region’s<br />
financial sector, including by strengthening legal frameworks<br />
and corporate governance, could also help.<br />
Now is the time to reset policies to address current challenges<br />
and ensure the resumption of Africa’s strong rising<br />
path. The required measures may cause a short-term slowdown<br />
in growth, but they will prevent the risk of crises if<br />
action is not taken promptly. With that, I believe countries<br />
in the region will be well positioned to reap their substantial<br />
economic potential. ■<br />
Finance & Development June 2016 13
Cashing In on the<br />
DIGITAL REVOLUTION<br />
Members of the Mada Saving Club in Tsafe, Nigeria, checking their cell phones.<br />
Njuguna Ndung’u, Armando Morales, and Lydia Ndirangu<br />
Digitization<br />
makes finance<br />
accessible,<br />
lowers costs,<br />
and creates<br />
opportunity<br />
IT is the topic du jour for policymakers in<br />
almost every developing economy—especially<br />
in sub-Saharan Africa. Financial<br />
inclusion makes saving easier and enables<br />
accumulation and diversification of assets,<br />
boosting economic activity in the process. As<br />
its economies continue to grow, the region<br />
must take one crucial step if it wants to escape<br />
the poverty trap, and even more so now<br />
as commodity exporters face a downward<br />
terms-of-trade trend: deliver more financial<br />
services to people and institutions.<br />
Yet access to financial services for the<br />
poor has been limited. Minimum bank balance<br />
requirements, high ledger fees (costs<br />
for maintaining micro accounts), and the<br />
distance between poor people’s homes and<br />
bank outlets hinder their access to financial<br />
services and credit. Moreover, unaffordable<br />
“collateral technology” (the system of fixed<br />
assets required for loan approval) raises costs<br />
more than anything else, and the financial<br />
products available are often not suitable for<br />
customers with low and irregular income.<br />
Banks have had to bear high costs to provide<br />
financial services to the poor. Market<br />
segmentation, low technological development,<br />
informality, and weak regulation<br />
increase the costs of doing business. In<br />
Kenya, and in Africa more broadly, markets<br />
are heavily segmented according to income,<br />
niche, and location, and their sophistication,<br />
level of development, and formality or<br />
informality reflect that segmentation.<br />
High customer-monitoring costs, perceived<br />
higher risk, and a lack of transparent<br />
information have been almost insurmountable<br />
challenges for banks, and microfinance<br />
and other specialized institutions have not<br />
been able to fill the gap.<br />
14 Finance & Development June 2016
AFRICA<br />
A new landscape<br />
The global financial crisis changed the landscape. Foreign<br />
banks scaled back their activities in some African countries,<br />
while new local banks increased their presence. The relative<br />
success of microfinance institutions in some countries (especially<br />
those that introduced a new technological platform<br />
to manage micro savings and deposit accounts) encouraged<br />
domestic banks to expand their networks. At the same time,<br />
nonbank financial institutions, such as savings and loans and<br />
cooperatives, formalized their activities. In response, regulators<br />
began introducing alternative models that helped cut<br />
intermediation costs. For example, agency banking allowed<br />
banks to locate nontraditional outlets in remote areas where<br />
brick-and-mortar branches and outlets are not financially<br />
feasible. Bank representatives at such outlets can perform<br />
authorized tasks, such as opening bank accounts, processing<br />
loan applications and loan repayments, and so forth.<br />
These changes were driven by demand. Market participants<br />
pressured regulators to build their capacity to cope with innovations<br />
and to develop institutions to support financial sector<br />
growth. Greater credit information sharing and the development<br />
of information for market participants, deposit insurance,<br />
and financial intelligence units generated a virtuous circle.<br />
But these changes pale compared with the transformation<br />
introduced by the emergence and low cost of digital<br />
financial services. In Kenya, mobile-phone-based technology<br />
(M-Pesa) for the delivery of financial services lowered<br />
transaction costs significantly and started a revolution in<br />
the payment system. M-Pesa is an electronic money transfer<br />
product that allows users to store value on their mobile<br />
phone or mobile account in the form of electronic currency.<br />
This currency can be used for a number of purposes, including<br />
transfers to other users, payments for goods and services,<br />
and conversion to and from cash.<br />
Suddenly, businesses did not have to give their employees<br />
time off to take money to their villages to care for relatives<br />
or small farms. Employees no longer had to travel long distances<br />
carrying cash and exposing themselves to robbery<br />
and other dangers. Relatives back home did not have to<br />
make long trips and risk assault or blackmail by local criminals<br />
who tracked the frequency of their travels. The digital<br />
revolution allowed people to make financial transactions<br />
and money transfers from the comfort of their homes. The<br />
lower cost left them with more disposable income, and they<br />
now had a secure way to store cash, even those working in<br />
Ndungu, 05/2/2016<br />
the informal economy.<br />
Immediate impact<br />
Traditional financial institutions were initially skeptical: it was<br />
hard to fathom how financial services, especially banking ser-<br />
Kenya: a four-step virtuous process<br />
Kenya still enjoys the advantages of an early start in pushing<br />
the frontier of financial inclusion through digital financial<br />
services. Geospatial surveys show how much financial<br />
institutions have responded to an increasingly welcoming<br />
environment (see chart). In Kenya a much larger share of the<br />
population is within 5 kilometers of a “financial access touch<br />
point” and had many more such touch points per person than<br />
was true in other countries in the region.<br />
Kenya stands out for its people’s use of mobile-phonebased<br />
money—in less than 10 years the share has grown<br />
from zero to more than 75 percent of the adult population.<br />
Banks have worked closely with telecommunications companies,<br />
which has allowed them a higher market presence<br />
there than in many emerging markets. In recent years, the<br />
insurance sector has expanded as well, targeting Kenya’s<br />
emerging middle class, and group-financing programs have<br />
also grown. This virtuous circle—facilitated by adaptive and<br />
flexible regulatory frameworks, reforms in financial infrastructure,<br />
and rapid improvements in skills and capacity—<br />
can be divided into four phases:<br />
Expansion of the mobile-phone technological platform for<br />
person-to-person transfers, payments, and settlements (products<br />
such as M-Pesa): In Kenya, the value of these transactions<br />
has reached the equivalent of 4.5 percent of annualized<br />
GDP a day.<br />
Introduction of virtual savings accounts using a digital<br />
financial services platform complemented by virtual banking<br />
services to manage micro accounts: in other words, digital<br />
financial services entered the core of banking intermediation.<br />
Exponential growth<br />
Banks have expanded their networks in urban and rural areas.<br />
(number of branches)<br />
1,600<br />
Rural branches (left scale)<br />
1,280<br />
Urban branches (left scale)<br />
ATMs (right scale)<br />
960<br />
640<br />
320<br />
0<br />
2005 07 09 2011 13<br />
Source: Central Bank of Kenya.<br />
(number of ATMs)<br />
3,000<br />
2,400<br />
1,800<br />
1,200<br />
Use of transaction, saving, and financial operations data<br />
from the digital financial services platform to generate credit<br />
scores and evaluate and price microcredit risk: This data<br />
analysis has helped overcome the so-called collateral technology<br />
hurdle, which has long been the main obstacle to financial<br />
access by the poor and has hindered the development of<br />
credit markets in Africa.<br />
Expansion of digital financial services for cross-border<br />
payments and international remittances: Regional crossborder<br />
payments and international remittance transfers are<br />
starting to come on board. The Kenyan example shows that<br />
once the process reaches this phase, demand for regulations<br />
to cope with innovations and more intensive use of technology<br />
to monitor this market can even discourage money laundering<br />
and the financing of terrorism.<br />
600<br />
0<br />
Finance & Development June 2016 15
vices, could be provided through a mobile phone. They soon<br />
saw the advantages of linking communication and transactions<br />
in real time. M-Pesa allows transactions to take place across<br />
different segments of the market using the same platform.<br />
Commercial banks eliminated the extra costs charged to highrisk<br />
potential customers, because M-Pesa’s real-time settlement<br />
platform does not require traditional risk assessment. There<br />
was an unbundling effect: payments and liquidity distribution<br />
took place outside the halls of banking, allowing banks to<br />
tailor their products to small-scale demand (Klein and Mayer,<br />
2012). In a sense, commercial banks and microfinance institutions<br />
saw that investing in a technological platform suited to<br />
handling micro accounts was an opportunity to expand their<br />
deposit base and market share. Moreover, they realized that<br />
greater capacity and higher intermediation would encourage<br />
microsavers to deposit even more in the banking system.<br />
The impact was immediate: total access to financial services<br />
of all kinds has increased steadily in recent years in several<br />
African countries, despite some decline in the reach of<br />
informal lenders (see Chart 1). FinScope surveys conducted<br />
by the Financial Sector Deepening Trust (with networks<br />
throughout Africa) show a dramatic decline in the share of<br />
Ndungu, 04/26/2016<br />
Chart 1<br />
Finance for all<br />
The number of people excluded from financial services has<br />
decreased in many African countries.<br />
(percent of population excluded from financial services)<br />
Kenya<br />
2016 42% 33% 7% 17%<br />
2012<br />
2009<br />
2006<br />
2014<br />
2012<br />
2010<br />
2016<br />
2012<br />
2013<br />
2009<br />
2013<br />
2009<br />
2015<br />
2009<br />
Source: Various FinScope surveys.<br />
32% 35% 8% 25%<br />
21% 20% 27% 33%<br />
15% 12% 32% 41%<br />
36%<br />
33%<br />
30%<br />
6%<br />
11%<br />
Nigeria<br />
12% 12%<br />
17%<br />
17%<br />
40%<br />
46%<br />
40%<br />
Rwanda<br />
26% 42% 21% 11%<br />
23% 19% 30% 28%<br />
Tanzania<br />
14% 44% 16% 27%<br />
9% 7% 29%<br />
55%<br />
Uganda<br />
20% 34% 31% 15%<br />
21% 7% 42%<br />
30%<br />
Zambia<br />
21% 17% 21% 41%<br />
15% 8% 14% 63%<br />
Formal (banks only) Other formal Informal excluded<br />
the “excluded” population. For example, in Rwanda, 89 percent<br />
of the population had some kind of financial access in<br />
2016. This was made possible by the expansion of activities<br />
of savings and credit cooperatives and growth in digital<br />
financial services supported by online government services<br />
(Rwanda FinScope, 2016).<br />
The drop in exclusion is also remarkable in Kenya<br />
(25 percentage points in the past 10 years), explained by<br />
entrance into markets of supervised institutions, including<br />
banks (accessibility grew from 15 to 42 percent of the population<br />
between 2006 and 2016). Progress in Tanzania and<br />
Uganda up to 2013 was also notable (28 and 15 percentage<br />
point reduction in exclusion, respectively, between 2009 and<br />
2013), mainly explained by growing activities of nonbank<br />
institutions (see Chart 2).<br />
The Kenyan example shows that financial inclusion is<br />
more about opening financial services to the poor than just<br />
providing affordable financing. Banks’ bet on expanding<br />
the infrastructure for greater financial presence has been<br />
largely successful. More bank branches (especially in rural<br />
areas), automated teller machines in growing urban centers,<br />
and bank agents in remote locations have all paid off<br />
in new and highly profitable business opportunities. And<br />
Kenyan banks are now exporting their redefined business<br />
models to the rest of Africa, supported by their expanded<br />
Ndungu, 04/26/2016<br />
Chart 2<br />
Finance at your doorstep<br />
There is no need to travel long distances to access financial<br />
services.<br />
(percentage of population<br />
within 5 kilometers of a (thousands of financial (financial access touch<br />
financial center) access touch points) points per 100,000 people)<br />
100<br />
80<br />
175<br />
80<br />
60<br />
Ndungu, 60 renumbered, 05/2/2016<br />
40<br />
40<br />
20<br />
20<br />
0<br />
Chart 3<br />
The big surprise<br />
Increased financial access in Kenya has led to better quality of<br />
bank assets.<br />
(loans and nonperforming loans, billions of U.S. dollars)<br />
25<br />
Gross loans (left scale)<br />
20<br />
Gross nonperforming loans (left scale)<br />
Ratio of gross nonperforming loans to<br />
15<br />
gross loans (right scale)<br />
10<br />
Source: Country geospatial surveys.<br />
5<br />
Kenya<br />
Tanzania<br />
Uganda<br />
Nigeria<br />
Source: Central Bank of Kenya.<br />
0<br />
Kenya<br />
Tanzania<br />
Uganda<br />
Nigeria<br />
150<br />
125<br />
100<br />
75<br />
50<br />
25<br />
0<br />
Kenya<br />
Tanzania<br />
Uganda<br />
Nigeria<br />
(percent)<br />
50<br />
0<br />
0<br />
2002 04 06 08 10 12 14<br />
40<br />
30<br />
20<br />
10<br />
16 Finance & Development June 2016
deposit base. Some 11 Kenyan banks now have more than<br />
300 branch outlets in east Africa (including South Sudan).<br />
At the same time, contrary to common belief, increased<br />
financial access has led to improved quality of bank assets<br />
when accompanied by better financial oversight. The<br />
Financial inclusion opens the door<br />
for potentially game-changing<br />
opportunities.<br />
recent drop in the share of nonperforming loans in total<br />
loans reflects mainly better credit appraisal—thanks to<br />
measures such as the 2010 Credit Information Sharing<br />
regulation, which helped reduce the disparity in information<br />
between lenders and prospective small-scale borrowers<br />
(see Chart 3).<br />
Welfare gains<br />
Kenya is a good example of the potential benefits of financial<br />
inclusion. Based on a model by IMF economists Dabla-Norris<br />
and others (2015), we estimated the reduction in transaction<br />
costs and the impact on Kenya’s growth from financial inclusion.<br />
First, it generates additional funds channelled to entrepreneurs.<br />
Second, lower transaction costs help improve the<br />
efficiency of contracts. Finally, more efficient allocation of<br />
funds in the financial system allows talented people without<br />
resources to become entrepreneurs.<br />
All these channels are expected to be significant in Kenya<br />
given that country’s substantial increase in access to credit<br />
by small and medium-sized enterprises—from 25 percent to<br />
33 percent between 2006 and 2013 (World Bank Enterprise<br />
Surveys). Our preliminary results show a reduction in transaction<br />
costs of 65 percent during 2006–13, with an annual<br />
contribution to GDP growth of about 0.45 percentage point<br />
(Morales and others, forthcoming).<br />
This boost to credit access took place even though<br />
it was partly offset by the rollout of stronger financial<br />
regulations, which raised monitoring costs and collateral<br />
requirements. This implies that financial inclusion<br />
through adequate policies could complement efforts to<br />
strengthen the financial regulatory framework, by helping<br />
banks expand their lending base while enhancing their<br />
soundness. The dramatic reduction in transaction costs<br />
spurred by digital financial services has clearly played a<br />
key role in this achievement.<br />
Digital financial services not only contribute to financial<br />
development, they also support financial stability. With less<br />
need for cash for transactions, more economic agents can<br />
send and follow financial market signals, contributing to a<br />
more solid and vibrant financial system. The environment<br />
for monetary policy improves as a result.<br />
In addition to these benefits, there are other reasons why<br />
proactive policies enhance financial inclusion:<br />
• Achieving inclusive growth without fast progress in<br />
financial inclusion in low-income countries is very difficult.<br />
According to World Bank Enterprise Surveys, in most<br />
African countries, small and medium-sized enterprises still<br />
report lack of access to financial services as their main obstacle<br />
to conducting business. These enterprises are a key sector<br />
of the economy because of their potential for employment<br />
generation and reduction of the informal sector.<br />
• For low-income countries with some degree of financial<br />
intermediation, there is a clear correlation between financial<br />
inclusion and human development (IMF, 2014), which points<br />
to a need to improve the regulatory technology.<br />
• Successful financial inclusion discourages policies that<br />
constrain market development. In several African countries<br />
initiatives still focus on specialized institutions, such as development<br />
banks or other institutions that lend to particular<br />
sectors—in agriculture or to small and medium-sized businesses—or<br />
on initiatives to introduce interest rate controls,<br />
despite overwhelming evidence against their effectiveness. As<br />
more and more citizens benefit from financial inclusion, the<br />
case for inappropriate measures will weaken.<br />
In addition to lowering the costs of transactions, financial<br />
inclusion opens the door for potentially game-changing<br />
opportunities: innovative pension plan support and government-targeted<br />
social protection, expansion of regional<br />
payment systems within regional blocks, enforcement of<br />
policies to stop money laundering and the financing of<br />
terrorism, and a better environment for forward-looking<br />
monetary policy to replace years of financial repression and<br />
reactive policies. ■<br />
Njuguna Ndung’u is an associate professor of economics at<br />
the University of Nairobi and was previously Governor of<br />
the Central Bank of Kenya. Lydia Ndirangu is the Head of<br />
the Research Centre at the Kenya School of Monetary Studies.<br />
Armando Morales is the IMF Resident Representative<br />
in Kenya.<br />
References:<br />
Dabla-Norris, Era, Yan Ji, Robert Townsend, and D. Filiz Unsal, 2015,<br />
“Identifying Constraints to Financial Inclusion and Their Impact on GDP<br />
and Inequality: A Structural Framework for Policy,” IMF Working Paper<br />
15/22 (Washington: International Monetary Fund).<br />
FinScope Surveys, various issues (Midrand, South Africa: FinMark<br />
Trust).<br />
International Monetary Fund (IMF), 2014, Regional Economic<br />
Outlook: Sub-Saharan Africa—Fostering Durable and Inclusive Growth<br />
(Washington, April).<br />
Kimenyi, Mwangi S., and Njuguna S. Ndung’u, 2009, “Expanding<br />
the Financial Services Frontier: Lessons from Mobile Phone Banking in<br />
Kenya” (Washington: Brookings Institution).<br />
Klein, Michael, and Colin Mayer, 2012, “Mobile Banking and Financial<br />
Inclusion: The Regulatory Lessons,” World Bank Policy Research Working<br />
Paper 5664 (Washington).<br />
Morales, Armando, Lydia Ndirangu, Njuguna Ndung’u, and Fan Yang,<br />
forthcoming, “Measuring the Impact of Financial Inclusion in Kenya,” IMF<br />
Working Paper (Washington: International Monetary Fund).<br />
World Bank Enterprise Surveys, various issues.<br />
Finance & Development June 2016 17
Inching toward<br />
Integration<br />
A new index<br />
allows African<br />
countries<br />
to see how<br />
their regional<br />
integration<br />
efforts stack up<br />
Carlos Lopes<br />
IT costs more to move a container from<br />
Kenya to Burundi than from Belgium or<br />
the United Kingdom to Kenya. Twenty<br />
percent of Africa’s international infrastructure<br />
networks, such as the Trans-African<br />
Highway network, are impassable. Flight connectivity<br />
is the lowest in the world and centered<br />
on only about 328 hubs for a land mass<br />
of around 11.7 million square miles, making<br />
it time consuming and costly to travel between<br />
African countries (United Nations Statistics<br />
Division, 2016).<br />
Although the pan-African ideal has been<br />
part of the continent’s modern history since<br />
the struggles for independence in Europeanruled<br />
African territories in the 1950s and 60s,<br />
African leaders never succeeded in translating<br />
this ideal into political capital. Attempts<br />
at real integration have so far yielded only<br />
mixed results.<br />
A series of initiatives dating to 1980—the<br />
Lagos Plan of Action, the Abuja Treaty, the<br />
New Partnership for Africa’s Development,<br />
and the more recent Agenda 2063—were<br />
each heralded as the economic response to<br />
Africa’s need for a new, more interconnected<br />
future. Why is it proving to be so painfully<br />
difficult to implement this vision of a truly<br />
integrated continent?<br />
Broader perspective needed<br />
Part of the response lies in the need for Africa’s<br />
regional integration agenda to move beyond<br />
a focus on trade alone. There is a case<br />
to be made for a much broader perspective.<br />
Just as important as the variety of what is on<br />
offer at the local market is how easily citizens<br />
move between countries, where individuals<br />
travel for leisure or for work, how cost-effective<br />
telecommunications are, where people<br />
choose to study or look for a job, and even<br />
how they transfer money to their family or<br />
get start-up capital for a business.<br />
Yet few policymakers focus on this bigger<br />
picture when considering policies to boost<br />
integration.<br />
The continent’s regional economic communities<br />
are one tangible sign of progress<br />
on integration. Regional economic communities<br />
are the building blocks of the African<br />
18 Finance & Development June 2016
AFRICA<br />
Economic Community established by the 1991 Abuja Treaty,<br />
which provides the overarching framework for continental<br />
economic integration.<br />
These country groups include the Arab Maghreb Union<br />
and the Community of Sahel-Saharan States in the north, the<br />
Economic Community of West African States (ECOWAS)<br />
in the west, the East African Community (EAC) and the<br />
Intergovernmental Authority on Development in the east, the<br />
Southern African Development Community (SADC) in the<br />
south, the Common Market for Eastern and Southern Africa<br />
(COMESA) in the southeast, and the Economic Community<br />
of Central African States in the center.<br />
The regional economic communities are taking concrete<br />
steps toward integration. For instance, in mobile telecommunications,<br />
they are now applying innovative measures<br />
to reduce the cost of mobile roaming through closer cooperation.<br />
This is particularly true in the EAC. In January 2015,<br />
Kenya, Rwanda, South Sudan, and Uganda launched the East<br />
Africa One Area Network in a bid to harmonize regional calling<br />
rates and lower costs between partner states. Recent estimates<br />
suggest that mobile phone traffic grew by 935 percent<br />
within three months of the launch, while the cost of making<br />
calls fell by over 60 percent.<br />
But critical challenges remain. Formal intra-African trade in<br />
goods is 14 percent, compared with 17 percent for South and<br />
Central America, 42 percent for North America, 62 percent<br />
for the European Union, and 64 percent for Asia. And Africa’s<br />
largest economies still trade on a most-favored-nation basis.<br />
These are just a few examples of how far the continent<br />
has to go before it is truly integrated. While<br />
policymakers have designed integration<br />
frameworks, their implementation has been<br />
hampered by the absence of monitoring and<br />
evaluation mechanisms. Simply put, there<br />
was until recently no means of measuring, in<br />
a precise and objective way, which countries<br />
are making the most progress in deepening<br />
regional integration, in which areas individual<br />
countries are falling behind, and which<br />
policies and institutions have proved most<br />
effective in promoting integration.<br />
Quantifying integration<br />
To fill this gap, the African Union, the African<br />
Development Bank, and the Economic Commission<br />
for Africa have launched the African Regional<br />
Integration Index, which presents a crossborder<br />
and multidimensional view of integration.<br />
The index measures five different dimensions:<br />
trade integration, regional infrastructure,<br />
productive integration, free movement<br />
of people, and financial and macroeconomic<br />
integration. These dimensions build on an<br />
overview of the key socioeconomic factors that<br />
are fundamental to integration. Sixteen categories,<br />
cutting across the five dimensions, are<br />
used to calculate the index (Chart 1).<br />
Lopes, corrected 5/4/16<br />
Trade integration. The free movement of goods is key for<br />
trade growth. Businesses and people benefit when trade flows<br />
are faster and more cost-effective. But in Africa, trade links to<br />
the rest of the world are more direct and efficient than trade<br />
between neighboring regions because of infrastructure gaps<br />
or capital costs and nontariff barriers.<br />
Regional infrastructure. Infrastructure development<br />
across the continent is the most visible face of regional integration.<br />
It includes highways being built across borders,<br />
flights taking passengers from one capital to another, and<br />
more people using mobile phone roaming on city streets<br />
or rural outposts. Countless connections made by road, by<br />
air, or increasingly by airwaves have an important impact<br />
on Africa’s integration efforts. Better regional infrastructure<br />
means lower transaction costs and faster delivery of goods<br />
and services, so regional hubs—as well as small or landlocked<br />
countries—have a lot to gain from promoting infrastructure<br />
to boost economic growth.<br />
Productive integration. Central to Africa’s economic success<br />
is the need to increase production and productivity. Africa<br />
could do more to develop regional and global value chains,<br />
which means fostering more diverse and resilient economic<br />
bases. As consumer purchasing power rises, intermediate<br />
goods that are used by a business in the production of finished<br />
goods or services will be important for Africa’s internal<br />
market. Building industrial clusters goes together with access<br />
to regional trade corridors that get goods moving and with<br />
promoting more regional electricity to power production.<br />
Whether for agriculture or industrial production, regions need<br />
Chart 1<br />
Gauging progress<br />
The African Regional Integration Index measures 16 different indicators across five<br />
broad dimensions.<br />
lnfrastructure Development Index:<br />
transportation, electricity, information<br />
and communication technology,<br />
water and sanitation<br />
•<br />
Proportion of intraregional flights •<br />
Total regional electricity •<br />
trade (net) per capita<br />
Average cost of mobile •<br />
phone roaming<br />
Regional •<br />
convertibility of<br />
national<br />
currencies<br />
Inflation rate •<br />
differential<br />
Proportion of regional economic•<br />
community member countries<br />
whose nationals are issued<br />
a visa on arrival<br />
Regional<br />
infrastructure<br />
Financial and<br />
macroeconomic<br />
integration<br />
Free movement<br />
of people<br />
Level of customs duties<br />
on lmports<br />
•<br />
Share of intraregional goods<br />
• exports<br />
Share of intraregional goods<br />
Trade<br />
integration<br />
•<br />
Ratification (or not)<br />
of regional economic<br />
community protocol on<br />
free movement of people<br />
Productive<br />
integration<br />
• imports<br />
•<br />
Share of total intraregional<br />
goods trade<br />
• Share of intraregional<br />
intermediate goods<br />
exports<br />
• Share of intraregional<br />
intermediate goods<br />
imports<br />
• Merchandise Trade<br />
Complementarity Index<br />
• Proportion of regional economic<br />
community member countries<br />
whose nationals do not require a<br />
visa for entry<br />
Sources: Economic Commission for Africa, African Union Commission, and African Development Bank (2016).<br />
Finance & Development June 2016 19
to unlock their productive potential, inject investment, overcome<br />
bottlenecks, and make sectors more competitive.<br />
Free movement of people. Cross-border movement represents<br />
not only a powerful boost to economic growth and<br />
skills development, it also supports competitiveness. Free<br />
movement of people benefits both the country opening its<br />
borders and the country whose citizens are on the move, as<br />
In Africa, trade links to the rest<br />
of the world are more direct and<br />
efficient than trade between<br />
neighboring regions.<br />
is evident in the growth of remittances in recent years. For<br />
many African countries, migration can plug skills gaps and<br />
allow the exchange of ideas, leading to the expansion of<br />
entrepreneurship and innovation beyond borders.<br />
Financial and macroeconomic integration. When capital<br />
flows more freely, investment increases, finance is allocated<br />
where it is most productive, and the continent’s investors<br />
get higher returns. In turn, as the transaction costs of doing<br />
business fall and financial institutions work more effectively,<br />
micro, small, and medium-sized enterprises and start-ups<br />
will benefit. Better financial integration promotes knowledge<br />
and technology transfer as well as greater innovation.<br />
Practical, results-focused tool<br />
Both a status report and an energizer for change, the index<br />
aims to be an accessible, comprehensive, practical, and<br />
results-focused tool that emphasizes policies and on-theground<br />
realities. It is designed to provide policymakers at<br />
the national, regional, and international levels; businesses;<br />
and other stakeholders reliable data that rank countries and<br />
institutions in various categories and dimensions, showing<br />
strengths and weaknesses. The goal is to enable action.<br />
The index—in its first edition—focuses on comparative<br />
analysis within and among the regional economic communities,<br />
with the aim of taking into account the diversity in<br />
Africa’s integration efforts. It allows each community to identify<br />
its strengths and gaps across each of the five dimensions.<br />
Several important findings have emerged from initial analysis.<br />
Africa’s overall regional integration across the regional<br />
economic communities stands below the halfway mark on<br />
the scale that ranges from no integration at all to fully integrated<br />
on all dimensions (see Chart 2). This shows that the<br />
overall integration in the region has significant potential to<br />
progress. The EAC comes out as the most integrated regional<br />
community overall, followed by the SADC and ECOWAS.<br />
Part of the reason the EAC does so well may be related to<br />
pre-independence history, when the core of the EAC was<br />
run as the East African Federation by the British with shared<br />
governance, traditions, and institutions. With recent strong<br />
political commitment at the highest level, the current phase<br />
of east African integration—after a hiatus during the 1960s,<br />
1970s, and 1980s—is building upon this shared history.<br />
What can explain these differing levels of performance of<br />
Africa’s regional economic communities?<br />
It is important to note that indicators described in<br />
Chart 1 include both “input” gauges to measure policies<br />
and “outcome” gauges that measure the value of the resulting<br />
cross-border economic flows. The highest-performing<br />
regional economic communities in the index perform well<br />
on both. This correlation between performance in the input<br />
and outcome indicators suggests that the policies measured<br />
by the former do indeed lead to better integration outcomes.<br />
In other words, EAC, ECOWAS, and SADC may perform<br />
better than the other blocs because they have implemented<br />
the pro-integration policies that are measured in the index.<br />
While every regional economic community has a higherthan-average<br />
score in one or more dimensions, in each case the<br />
highest scores are on trade integration and the lowest on financial<br />
and macroeconomic integration. A series of actions can<br />
improve financial and macroeconomic integration, including<br />
promoting banking across borders outside the well-established<br />
financial centers; standardizing regional payments; putting in<br />
place multilateral fiscal guidelines; and converging on inflation<br />
targets, public finance, and exchange rate stability.<br />
The regional economic communities rank closest to each<br />
other on regional infrastructure and productive integration<br />
and furthest apart on free movement of people and financial<br />
and macroeconomic integration (see table).<br />
Results show the 28 top performing countries considered<br />
the most integrated overall across the eight regional economic<br />
communities included in the index. An additional<br />
Lopes, corrected 5/4/16<br />
19 countries are considered broadly integrated. The analysis<br />
also shows that the economic weight of a country does not<br />
necessarily correspond to its regional integration score, with<br />
Chart 2<br />
Measuring up<br />
Well-established organizations—such as the East African<br />
Community—with close economic, political, and social ties score<br />
better overall on the integration index.<br />
(average overall scores on regional integration by regional economic community)<br />
CEN-SAD<br />
COMESA<br />
ECCAS<br />
IGAD<br />
UMA<br />
RECs<br />
ECOWAS<br />
SADC<br />
EAC<br />
0.395<br />
0.415<br />
0.454<br />
0.457<br />
0.459<br />
0.470<br />
0.509<br />
0.531<br />
0.540<br />
0.0 0.2 0.4 0.6 0.8 1.0<br />
Sources: Economic Commission for Africa, African Union Commission, and African Development<br />
Bank (2016).<br />
Note: CEN-SAD = Community of Sahel-Saharan States, COMESA = Common Market for Eastern<br />
and Southern Africa, EAC = East African Community, ECCAS = Economic Community of Central<br />
African States, ECOWAS = Economic Community of West African States, IGAD = Intergovernmental<br />
Authority on Development, RECs = average of all regional economic communities, SADC =<br />
Southern African Development Community, and UMA = Arab Maghreb Union. Scores are calculated<br />
on a scale of 0 (low) to 1 (high).<br />
20 Finance & Development June 2016
Closer look<br />
By assigning scores on each dimension, the index allows<br />
regions to see exactly where they fall short.<br />
(score on each dimension by regional economic community)<br />
Trade<br />
Integration<br />
Regional Productive<br />
Infrastructure Integration<br />
Free Movement<br />
of People<br />
Financial<br />
Integration<br />
CEN-SAD 0.353 0.251 0.247 0.479 0.524<br />
COMESA 0.572 0.439 0.452 0.268 0.343<br />
EAC 0.780 0.496 0.553 0.715 0.156<br />
ECCAS 0.526 0.451 0.293 0.400 0.599<br />
ECOWAS 0.442 0.426 0.265 0.800 0.611<br />
IGAD 0.505 0.630 0.434 0.454 0.211<br />
SADC 0.508 0.502 0.350 0.530 0.397<br />
UMA 0.631 0.491 0.481 0.493 0.199<br />
Average 0.540 0.461 0.384 0.517 0.381<br />
Sources: Economic Commission for Africa, African Union Commission, and African<br />
Development Bank (2016).<br />
CEN-SAD = Community of Sahel-Saharan States, COMESA = Common Market for Eastern<br />
and Southern Africa, EAC = East African Community, ECCAS = Economic Community of<br />
Central African States, ECOWAS = Economic Community of West African States, IGAD<br />
= Intergovernmental Authority on Development, SADC = Southern African Development<br />
Community, and UMA = Arab Maghreb Union. Scores are calculated on a scale of 0 (low)<br />
to 1 (high).<br />
the exception of Kenya and South Africa. For instance, while<br />
Nigeria represents 37 percent of regional GDP, it is not a top<br />
performer on regional integration, nor is Egypt. Conversely,<br />
countries such as CÔte d’Ivoire, which contributes only<br />
3 percent of regional GDP, are among the top performers.<br />
So what does all this mean for Africa’s integration, and<br />
does the multiplicity of regional groupings help or hinder it?<br />
Although the index cannot directly answer this question,<br />
other research (Economic Commission for Africa, the<br />
African Union Commission, and the African Development<br />
Bank, 2012) clearly shows that Africa’s regional economic<br />
communities have been the locus of many effective integration<br />
measures, particularly in the areas of trade integration<br />
and free movement of people. While these efforts represent<br />
progress, the multiplicity of standards, rules of origin, and<br />
regimes that span the continent surely increase the burden<br />
of compliance on African businesses. Africa needs to harmonize<br />
integration policies across its various regional blocs. ■<br />
Carlos Lopes is a United Nations Under-Secretary-General<br />
and Executive Secretary of the Economic Commission for<br />
Africa.<br />
This article is based on the Africa Regional Integration Index Report<br />
2016 of the Economic Commission for Africa, the African Union<br />
Commission, and the African Development Bank.<br />
References:<br />
Economic Commission for Africa, the African Union Commission, and<br />
the African Development Bank, 2016, Africa Regional Integration Index<br />
Database (Addis Ababa).<br />
———, 2012, Assessing Regional Integration in Africa V: Towards an<br />
African Continental Free Trade Area (Addis Ababa).<br />
United Nations Statistics Division (UNSD), 2016, UNdata.<br />
<br />
<br />
<br />
Read our blog by leading economists<br />
and IMF officials about pressing issues<br />
in the global economy<br />
http://blog-imfdirect.imf.org<br />
Finance & Development June 2016 21
Maggie Lawson, or Mama Benz,<br />
visiting the warehouse of her cloth<br />
business, Lomé, Togo.<br />
In the<br />
DRIVER’S SEAT<br />
Gender<br />
equality can<br />
boost growth<br />
in sub-Saharan<br />
Africa<br />
Christine Dieterich, Dalia Hakura, and Monique Newiak<br />
TOGO’S thriving textile industry is<br />
attributed to Maggy Lawson, better<br />
known as “Mama Benz” for the<br />
striking Mercedes-Benz she—and<br />
her mother before her—was famous for driving.<br />
In a break from tradition, she inherited<br />
her mother’s business and rose to prominence<br />
as a businesswoman in the 1970s by selling<br />
brightly printed cotton cloth for garments<br />
made throughout west Africa. Her immense<br />
success created many local jobs.<br />
Mama Benz is just one of many examples<br />
of the positive effect women can have on sub-<br />
Saharan African economies.<br />
Gender inequality and economic outcomes<br />
are intertwined, research shows: stronger<br />
growth advances gender equality, and gender<br />
equality boosts growth (Duflo, 2012; see<br />
Chart 1).<br />
There are many reasons to believe that<br />
gender equality lifts growth. Closing worldwide<br />
gender gaps in education would give a<br />
tremendous boost to global human capital<br />
and reduce income inequality (Gonzales and<br />
others, 2015b). Women tend to spend more<br />
of their household income on the education<br />
of their children and grandchildren than<br />
men do, so that closing the pay gap between<br />
men and women could translate to higher<br />
school enrollment for children, in turn leading<br />
to higher growth. And more women in<br />
the workforce means a larger pool of capable<br />
workers and entrepreneurs.<br />
A faster demographic transition—lowering<br />
the number of dependent children—can<br />
contribute to reducing inequality, particularly<br />
for low-income households, and allow<br />
greater investment in the human capital of<br />
the female labor force (Soares, 2005; Soares<br />
and Falcão, 2008).<br />
Sub-Saharan Africa’s labor markets show<br />
relatively high female labor force participation,<br />
reflecting women’s need to work for<br />
subsistence, but the jobs are often in the lowproductivity<br />
agricultural sector and mostly<br />
in the informal sector. Wage employment<br />
remains a male-dominated domain—limiting<br />
the efficient use of talent.<br />
22 Finance & Development June 2016
AFRICA<br />
These inequities are mirrored elsewhere. According to the<br />
United Nations (UN) Gender Inequality Index, which measures<br />
inequality in the labor market, mortality and fertility<br />
rates, education, and empowerment, many countries in sub-<br />
Saharan Africa—notably Mali and Niger—stand out as having<br />
some of the world’s highest gender inequality.<br />
Income inequality is also high in sub-Saharan Africa. In<br />
the past 15 years, rapid growth in the region has boosted<br />
per capita income, and poverty rates have fallen. But wide<br />
income disparity across the population remains and has<br />
even increased in many countries, making incomes in the<br />
region the most unequal in the world after Latin America<br />
and the Caribbean (see Chart 2). Greater income equality can<br />
encourage economic growth because it increases low-income<br />
households’ ability to invest in education and physical capital.<br />
It can also reduce sociopolitical instability and poor governance,<br />
which discourage private investment (Barro, 2000).<br />
Costly inequality<br />
Given that both income and gender inequality are high in the<br />
region, and in light of global evidence that such inequity hinders<br />
growth, the inevitable question is how much inequality<br />
harms economic prosperity in the region.<br />
The potential harm is substantial, though it varies across<br />
countries. Our research finds that reducing income and gender<br />
inequality to the levels currently observed in the fastgrowing<br />
economies of southeast Asia (Indonesia, Malaysia,<br />
Philippines, Dieterich, 04/27/2016 Thailand, Vietnam) could boost sub-Saharan<br />
Africa’s annual real per capita GDP growth by an average<br />
of close to 1 percentage point a year. This is roughly the<br />
same order of magnitude as the impact on annual per capita<br />
growth of closing the infrastructure gap over the past 10<br />
years between the two regions.<br />
Chart 1<br />
More equality, higher growth<br />
High gender inequality appears to be hindering sub-Saharan<br />
Africa’s growth, even after taking into account each country’s<br />
level of development.<br />
(United Nations Gender Inequality Index and GDP per capita growth not<br />
explained by level of development, 1990–2010)<br />
15<br />
10<br />
5<br />
0<br />
–5<br />
–10<br />
Rest of the world<br />
Sub-Saharan Africa<br />
–15<br />
0 20 40 60 80<br />
Gender Inequality Index (→ more inequality)<br />
Sources: UNDP Human Development Report; World Bank, World Development Indicators;<br />
and IMF staff estimates.<br />
Note: Countries showing growth above zero are growing faster than can be explained by<br />
their per capita income, and those that exhibit growth lower than zero are growing more<br />
slowly.<br />
Our study highlights a number of explanations for inequi-<br />
ties that are holding back sub-Saharan Africa’s growth potential.<br />
Many of these driving forces affect gender inequality and<br />
income inequality similarly. Indeed, gender inequality itself<br />
propels some income inequality.<br />
Our study also confirms that inequality of opportunity—<br />
that is, initial conditions and availability of resources that<br />
help people reach their full economic potential—explains<br />
much income and gender inequality. For instance, lack of<br />
access to education, health care, and basic infrastructure<br />
services can limit human capital development and reduce<br />
productivity. In sub-Saharan Africa, there has been general<br />
improvement, but many countries are still trailing countries<br />
with similar incomes in other regions.<br />
Opportunities for women have generally improved—but<br />
not enough. For example, male and female primary school<br />
enrollment has risen since the turn of the century, driven by<br />
the UN Millennium Development Goals. But only 91 girls for<br />
every 100 boys are enrolled in primary or secondary school,<br />
and only 73 women for every 100 men are at the postsecondary<br />
level. The reasons for these gaps range from lack of basic<br />
infrastructure, which means more time spent (mainly by<br />
females) on household activities to high adolescent fertility<br />
rates and early marriage, which bind girls to household work<br />
at an early age. In Niger, for example, there are more than 200<br />
births for each 1,000 girls ages 15 to 19, and only 15 percent<br />
of girls are enrolled in secondary education.<br />
Similarly, women are behind in access to financial services.<br />
Dieterich, 04/27/2016<br />
The percentage of the population with an account at a financial<br />
institution has increased in recent years, but more so<br />
for men than for women. In some countries, such as Kenya,<br />
mobile-phone-based accounts have overtaken traditional bank<br />
accounts and have helped close the gap between income groups<br />
in access to finance, but the gender gap in access to mobile<br />
money remains high. In Kenya, more than 62 percent of men<br />
Chart 2<br />
High income inequality<br />
Despite strong growth in sub-Saharan Africa, inequality has<br />
fallen little—and unevenly across countries.<br />
(change in Gini coefficient, a measure of inequality)<br />
115<br />
95<br />
75<br />
55<br />
35<br />
15<br />
0<br />
–25<br />
–45<br />
SLE<br />
NGA CPV<br />
ETH<br />
MOZ<br />
UGA<br />
TZA ZMB<br />
BFA<br />
MLI<br />
MUS<br />
NAM<br />
BWA<br />
MWI<br />
ZAF GHA<br />
LSO<br />
SEN<br />
SWZ CMR<br />
KEN<br />
SYC GIN<br />
CAF<br />
NER<br />
GMB<br />
MDG<br />
CIV<br />
BDI<br />
GNB<br />
ZWE<br />
–25 –20 –15 –10 –5 0 5 10 15<br />
Real GDP per capita growth, 1995–2011<br />
Sources: World Bank, World Development Indicators database; and Solt (2014).<br />
Note: Change is between 1995 (or next earliest available year) and 2011 (or latest<br />
available year). Data labels in the figure use International Organization for Standardization<br />
(ISO) country codes.<br />
RWA<br />
Finance & Development June 2016 23
have a mobile account; fewer than 55 percent of women have<br />
such accounts, which limits the benefits of new technology.<br />
And numerous legal restrictions on women’s economic activity<br />
remain (World Bank, 2015), which discourages women<br />
from saving in a formal institution and borrowing for business<br />
activities. These restrictions account for as much as 5 percentage<br />
points of the labor market participation gender gap in<br />
Opportunities for women could<br />
alleviate inequalities and unleash<br />
the region’s growth potential.<br />
some countries of the region (Hallward-Driemeier and Hasan,<br />
2013; Demirguc-Kunt, Klapper, and Singer, 2013; Gonzales<br />
and others, 2015a). Despite some progress since the 1990s,<br />
eight countries in sub-Saharan Africa still have 10 or more such<br />
restrictions, including the need for her husband’s consent before<br />
a woman can open a bank account or start a new job.<br />
Addressing the problem<br />
A handful of well-designed and targeted policy interventions<br />
to open up opportunities for low-income households and<br />
women could alleviate inequalities and unleash the region’s<br />
growth potential.<br />
Home-based businesses contribute significantly to increasing<br />
and diversifying women’s income, especially given their<br />
obstacles to wage employment. Currently, fees, levies, and<br />
taxes on home businesses are a popular source of revenue<br />
for local governments. Opening new sources of local government<br />
financing through property tax reform would reduce<br />
the burden on household businesses.<br />
Better access to financial services can help address both<br />
income and gender inequality. For example, banks will be<br />
more likely to lend to new customers if credit bureaus with<br />
centralized records make information about potential customers<br />
easily available. New technologies such as mobile<br />
banking can facilitate access to financial services in remote<br />
regions and for women.<br />
Abolishing laws that favor men’s economic activity over<br />
women’s is another notable yet easy way to support growth.<br />
Some sub-Saharan African countries have taken measures<br />
to level the playing field for women. For instance, in 1996<br />
Namibia removed a number of legal barriers facing women,<br />
and female labor force participation rose by almost 8 percentage<br />
points in the decade that followed. Within the past three<br />
years, many sub-Saharan African countries have changed<br />
their laws to foster equality. For instance, Guinea’s new labor<br />
code now includes a clause on nondiscrimination based on<br />
gender; in Kenya the new law on matrimonial property gives<br />
both spouses equal rights to administer joint property; and<br />
South Africa’s law now mandates equal pay for work of equal<br />
value (World Bank, 2015).<br />
Finally, improvements in infrastructure, including better<br />
access to electricity and water, will affect growth both directly<br />
and by increasing the time girls and women have to participate<br />
in education and market activities. That means stronger<br />
human capital and an influx of skills to the labor market.<br />
Evidence from microsurveys in Ghana suggests that when<br />
girls spend half as much time fetching water their school<br />
attendance rises by 2.4 percent on average, with larger effects<br />
in rural areas (Nauges and Strand, 2013).<br />
Such measures could reduce income and gender inequality<br />
in the region substantially and support two goals that are<br />
valuable in their own right and that are important drivers for<br />
sustained economic growth. In particular, they can help unlock<br />
the combined energies of sub-Saharan Africa’s women—paving<br />
the way for more success stories like that of Mama Benz. ■<br />
Christine Dieterich and Dalia Hakura are Deputy Division<br />
Chiefs and Monique Newiak is an Economist, all in the IMF’s<br />
African Department.<br />
This article is based on Chapter 3 of the IMF’s October 2015 Regional<br />
Economic Outlook: Sub-Saharan Africa and the forthcoming IMF<br />
Working Paper “Inequality, Gender Gaps and Economic Growth:<br />
Comparative Evidence for Sub-Saharan Africa,” by Dalia Hakura,<br />
Mumtaz Hussain, Monique Newiak, Vimal Thakoor, and Fan Yang.<br />
References:<br />
Barro, Robert J., 2000, “Inequality and Growth in a Panel of<br />
Countries,” Journal of Economic Growth, Vol. 5, No. 1, pp. 5–32.<br />
Demirguc-Kunt, Asli, Leora Klapper, and Dorothe Singer,<br />
2013,“Financial Inclusion and Legal Discrimination against Women:<br />
Evidence from Developing Countries,” World Bank Policy Research<br />
Working Paper 6416 (Washington).<br />
Duflo, Esther, 2012, “Women Empowerment and Economic<br />
Development,” Journal of Economic Literature, Vol. 50, No. 4, pp.<br />
1051–79.<br />
Gonzales, Christian, Sonali Jain-Chandra, Kalpana Kochhar, and<br />
Monique Newiak, 2015a, “Fair Play: More Equal Laws Boost Female<br />
Labor Force Participation,” IMF Staff Discussion Note 15/02 (Washington:<br />
International Monetary Fund).<br />
——— and Tilek Zeinullayev, 2015b, “Catalyst for Change: Empowering<br />
Women and Tackling Income Inequality,” IMF Staff Discussion Note 15/20<br />
(Washington: International Monetary Fund).<br />
Hallward-Driemeier, Mary, and Tazeen Hasan, 2013, Empowering<br />
Women: Legal Rights and Economic Opportunities in Africa<br />
(Washington: World Bank).<br />
Nauges, Céline, and Jon Strand, 2013, “Water Hauling and Girls’<br />
School Attendance: Some New Evidence from Ghana,” World Bank Policy<br />
Research Working Paper 6443 (Washington)<br />
Soares, Rodrigo R., 2005, “Mortality Reductions, Educational<br />
Attainment, and Fertility Choice,” American Economic Review, Vol. 95,<br />
No. 3, pp. 580–601.<br />
———, and Bruno L.S. Falcão, 2008, “The Demographic Transition and<br />
the Sexual Division of Labor,” Journal of Political Economy, Vol. 116, No.<br />
6, pp. 1058–104.<br />
Solt, Frederick, 2014, “The Standardized World Income Inequality<br />
Database,” Working Paper. SWIID 5.0, October.<br />
World Bank, 2015, Women, Business and the Law 2016—Getting to<br />
Equal (Washington).<br />
24 Finance & Development June 2016
AFRICA<br />
African countries have made some<br />
progress in improving health systems,<br />
but holes remain<br />
After Ebola<br />
Amanda Glassman<br />
NEARLY two years after the peak of the Ebola outbreak,<br />
affected countries in Africa have made some<br />
progress in improving their health systems, and a<br />
continent-wide agency designed to prevent, detect,<br />
and fight disease outbreaks has been established.<br />
But whether donor funds pledged to combat Ebola have<br />
materialized and—if so—how they have been spent is unclear.<br />
The affected countries in west Africa will have to keep the<br />
pressure on donors to deliver on promises and make a concerted<br />
effort to document and evaluate the impact of health<br />
systems spending.<br />
The lack of spending accountability and of concrete results<br />
in the public domain raise persistent questions regarding the<br />
international community’s ability to respond effectively to<br />
large-scale outbreaks.<br />
Progress on health systems<br />
Recent Ebola flare-ups in west Africa were quickly identified,<br />
and contacts were traced and safely contained. The response<br />
to these latest flare-ups demonstrates increased capacity<br />
of the region’s health systems. Recent investments in rapid<br />
response teams, surveillance, lab diagnostics, risk communication,<br />
infection prevention and control measures, and other<br />
programs seem to be paying off.<br />
Other routine health system functions are also improving.<br />
In Sierra Leone, for example, a mid-2015 measles and polio<br />
vaccination campaign reached almost all children under the<br />
age of five who had missed out during the Ebola outbreak.<br />
Another bright spot is the creation in 2015 of the African<br />
Centres for Disease Control and Prevention (African<br />
CDC) with $6.9 million in funding from the African Union<br />
Commission and technical support from the U.S. Centers for<br />
Disease Control. The African CDC is set to coordinate research<br />
throughout Africa on the biggest public health threats, gathering<br />
data and reinforcing countries’ capacity to prevent and<br />
respond to outbreaks. However, initial funding and staffing is<br />
minimal, and leadership has not yet been named.<br />
Still, huge risks remain. At the peak of the outbreak, surveys<br />
conducted in Guinea, Liberia, and Sierra Leone found<br />
that the number of people seeking health care had dropped<br />
by half. Analysts estimate that this forgone care likely resulted<br />
in increased mortality from other prevalent infectious diseases,<br />
such as malaria, tuberculosis, and HIV/AIDS (Parpia<br />
and others, 2016). The cure rate for tuberculosis in Liberia<br />
has dropped from 55 percent before the Ebola outbreak to<br />
about 28 percent. Many also worry that the disease-specific<br />
approach taken by external funders hinders rather than helps<br />
the attempt to rebuild the health system as a whole.<br />
Donor delivery<br />
Overall donations to the Ebola response were robust: the<br />
United Nations Office for the Coordination of Humanitarian<br />
Affairs (OCHA), which collects data on humanitarian<br />
contributions, estimates that $3.62 billion was pledged<br />
during 2014–15. The U.S. government also authorized an<br />
emergency appropriation of $5.4 billion, the most funding<br />
the U.S. Congress has ever provided for an international<br />
health emergency.<br />
Of the OCHA-tracked funding, about one-third had been<br />
disbursed to affected countries by February 2015; there have<br />
been no updates since. A November 2014 White House fact<br />
sheet says that the goal of the U.S. funding was to “fortify<br />
domestic public health systems, contain and mitigate the epidemic<br />
in West Africa, speed the procurement and testing of<br />
vaccines and therapeutics … enhancing capacity for vulnerable<br />
countries to prevent disease outbreaks, detect them early,<br />
and swiftly respond … ” As of December 2015, U.S. agencies<br />
that received Ebola funding had obligated 47 percent of the<br />
total approved and disbursed 23 percent. But there is little<br />
public information on how the roughly $1.2 billion disbursed<br />
was used, although review plans are underway by the relevant<br />
U.S. agencies’ inspectors general.<br />
Despite a nearly unprecedented global effort to coordinate<br />
a response to the Ebola outbreak, west African governments<br />
do not yet know the amount, timing, and conditions of most<br />
of the aid—nor how much will be given to governments to<br />
distribute and whether governments will have a say in its use.<br />
The lack of documentation and accountability for the<br />
uses and outcome of the spending does not bode well for the<br />
future—a particularly sore point from the perspective of the<br />
United States. The Obama administration’s recent tussle with<br />
Congress over an emergency appropriation request to combat<br />
the Zika virus reflects such concerns. ■<br />
Amanda Glassman is Director of Global Health Policy and Vice<br />
President for Programs at the Center for Global Development.<br />
Reference:<br />
Parpia Alyssa S., Martial L. Ndeffo-Mbah, Natasha S. Wenzel,<br />
and Alison P. Galvani, 2016, “Effects of Response to 2014–2015<br />
Ebola Outbreak on Deaths from Malaria, HIV/AIDS, and<br />
Tuberculosis,” Emerging Infectious Diseases, Vol. 22, No. 3.<br />
Finance & Development June 2016 25
Impediment to<br />
GROWTH<br />
Africa’s inadequate infrastructure<br />
limits the continent’s economic<br />
progress, but funding roads, ports,<br />
and power projects is difficult<br />
Amadou Sy<br />
INADEQUATE infrastructure—including unreliable energy,<br />
an ineffective urban-rural road network, and inefficient<br />
ports—is one of the largest impediments to economic<br />
Sy, corrected growth 04/13/2016 in Africa. It limits the returns from human capital<br />
investment—such as education and health. Hospitals and<br />
schools cannot function properly without electricity.<br />
A 2009 World Bank study estimated that sub-Saharan<br />
Africa’s infrastructure needs are about $93 billion a year<br />
(Foster and Briceño-Garmendia). Recently, the IMF estimated<br />
that budget spending on infrastructure by sub-Saharan<br />
Chart 1<br />
Making commitments<br />
A growing number of foreign commitments are being made to<br />
fund sub-Saharan Africa’s infrastructure needs.<br />
(billions of U.S. dollars)<br />
35<br />
30<br />
Private investment China<br />
Official development financing<br />
25<br />
Sy,<br />
20<br />
04/12/2016<br />
15<br />
10<br />
5<br />
0<br />
1990 2000 10<br />
Source: Gutman, Sy, and Chattopadhyay (2015).<br />
Chart 2<br />
Dominant destinations<br />
Five of the 51 countries in sub-Saharan Africa received more than<br />
half of the total external commitments to infrastructure spending<br />
between 2009 and 2012.<br />
(percent of total external commitments, 2009–12)<br />
47%<br />
7%<br />
17%<br />
8%<br />
11%<br />
10%<br />
Source: Gutman, Sy, and Chattopadhyay (2015).<br />
South Africa<br />
Nigeria<br />
Ghana<br />
Kenya<br />
Ethiopia<br />
Other 46 countries<br />
African countries reached about $51.4 billion (IMF, 2014),<br />
meaning a financing gap of about $41.6 billion.<br />
External commitments, both private and public, appear<br />
to fill a substantial share of this gap (see Chart 1). They rose<br />
to about $30 billion a year in 2012 from $5 billion in 2003<br />
(Gutman, Sy, and Chattopadhyay, 2015). Official development<br />
financing has increased—especially from the World<br />
Bank and the African Development Bank. Private participation<br />
in infrastructure has surged and now accounts for more<br />
than half of external financing. China has become a major<br />
bilateral source of financing.<br />
But the remaining gap of about $11.6 billion is probably<br />
too low an estimate that global assistance in any event will<br />
not fill under current circumstances. First, the 2009 World<br />
Bank calculation underestimates current needs, such as urban<br />
infrastructure. Second, the $30 billion in external commitments<br />
is not comparable to budget spending. These commitments<br />
materialize over time and do not arrive evenly. One<br />
large deal, such as a major energy investment in South Africa<br />
in 2012, can distort that year’s data. Third, overall numbers<br />
don’t tell the whole story. Of the $59.4 billion in budget spending<br />
on infrastructure by African governments, South Africa<br />
accounted for about $29 billion in 2012, with the number two<br />
country, Kenya, allocating about $3 billion. Countries also<br />
vary widely in their commitment to infrastructure spending.<br />
Angola, Cabo Verde, and Lesotho invest more than 8 percent<br />
of GDP, while oil-rich Nigeria and fragile South Sudan allocate<br />
less than 1 percent.<br />
In addition, most external financing is concentrated in a<br />
few large countries and a few sectors. Five countries attracted<br />
more than half of the total external commitments to infrastructure<br />
development in 2009–12 (see Chart 2).<br />
Except for Nigeria and South Africa, sub-Saharan African<br />
countries have been unable to attract significant private<br />
investment outside the telecommunications sector. In 2013,<br />
sub-Saharan Africa received about $17 billion in private<br />
funds, of which all but $2 billion went to South Africa and<br />
Nigeria in sectors other than telecommunications. Overall,<br />
private investment (which includes public-private partnerships)<br />
went mostly to information and communications<br />
technology and electricity from 2005 to 2012.<br />
A policy agenda for building and maintaining infrastructure<br />
in sub-Saharan Africa under these circumstances should<br />
have at least three priorities.<br />
First, domestic budget spending—the largest source of<br />
African infrastructure financing—should be increased.<br />
African countries generate more than $520 billion annually<br />
from domestic taxes and can mobilize more domestic revenue<br />
through improved tax administration and measures to<br />
26 Finance & Development June 2016
AFRICA<br />
broaden the tax base. The average tax-to-GDP ratio increased<br />
from 18 percent in 2000–02 to 21 percent in 2011–13—<br />
equivalent to half the development aid Africa received in<br />
2013 (Africa Progress Panel, 2014). The increase in domestic<br />
financing is no doubt the result of debt relief, some increased<br />
tax revenue collection, gains from the commodity price boom,<br />
and improved macroeconomic and institutional policies.<br />
But it will be hard for many countries to find more domestic<br />
revenue. Tax mobilization remains low despite significant<br />
effort and recent reforms in non-resource-rich countries<br />
(Bhushan, Samy, and Medu, 2013). The ratio of general government<br />
tax revenue to GDP in 2013 ranged from 2.8 percent in<br />
the Democratic Republic of the Congo to 25 percent in South<br />
Africa (one of the highest among developing economies).<br />
Helping African countries raise more funds domestically for<br />
many purposes, including infrastructure, should be a priority<br />
for African policymakers and the international community. In<br />
2015, global donors committed to helping African countries<br />
Reducing inefficiencies could<br />
substantially increase the<br />
economic dividends from<br />
public investment.<br />
improve tax collection. In 2011, the latest year for which figures<br />
are available, less than 1 percent of official development<br />
assistance went to domestic revenue mobilization.<br />
Second, sources of domestic revenue should be broadened.<br />
From 2006 to 2014, 13 countries issued a total of $15 billion<br />
in international sovereign bonds, often intending to use<br />
the proceeds to finance infrastructure. But a more prudent<br />
and sustainable way to finance infrastructure would be to<br />
increase the participation of domestic institutional investors,<br />
such as pension funds.<br />
African pension funds have about $380 billion in assets<br />
under management, 85 percent of which are in South Africa<br />
(see table). In countries such as Cabo Verde, Kenya, South<br />
Africa, Swaziland, Tanzania, and Uganda, funds are investing<br />
in infrastructure (Inderst and Stewart, 2014). Pension fund<br />
trustees and managers should consider whether risk-adjusted<br />
investments can be made within the context of their fiduciary<br />
duty to beneficiaries. Countries must also improve the governance,<br />
regulation, and development of domestic financial<br />
and capital market instruments for infrastructure investment—and<br />
seek to attract foreign institutional investors too.<br />
Third, funds must be spent efficiently. Most of the debate on<br />
infrastructure needs in sub-Saharan Africa focuses on financing<br />
issues. But there is evidence that efficiency, not financing,<br />
is often the barrier to investment. For example, the IMF (2015)<br />
estimates that about 40 percent of the potential value of public<br />
investment in low-income countries is lost to inefficiencies<br />
in the investment process due to time delays, cost overruns,<br />
and inadequate maintenance. Those inefficiencies are often<br />
Mine the gap<br />
Pension fund assets in Africa could be tapped as a source for<br />
investment in infrastructure.<br />
Pension Fund Assets under Management<br />
Country<br />
(billions of U.S. dollars)<br />
South Africa 322.0<br />
Nigeria 25.0<br />
Namibia 10.0<br />
Kenya 7.3<br />
Botswana 6.0<br />
Tanzania 3.1<br />
Ghana 2.6<br />
Zambia 1.8<br />
Uganda 1.5<br />
Rwanda 0.5<br />
Total 379.8<br />
Sources: Making Finance Work for Africa; and author’s calculations.<br />
Note: Asset amounts represent the latest figures available.<br />
the result of undertrained officials; inadequate processes for<br />
assessing needs and preparing for and evaluating bids; and corruption.<br />
Reducing inefficiencies could substantially increase<br />
the economic dividends from public investment.<br />
The 2009 World Bank study estimated that if inefficiencies<br />
were addressed through such measures as rehabilitating<br />
existing infrastructure, targeting subsidies better, and<br />
improving budget execution—in other words more efficient<br />
use of existing infrastructure—the $93 billion financing need<br />
could be reduced by $17 billion. That means that the focus<br />
of attention on infrastructure should be broadened beyond<br />
financing issues to include efforts to improve efficiency. This<br />
is a complex task that requires African governments and the<br />
international community to focus on individual sectors and<br />
how they operate in particular countries and requires robust<br />
monitoring capability.<br />
Amadou Sy is a senior fellow and director of the Africa Growth<br />
Initiative at the Brookings Institution.<br />
References:<br />
Africa Progress Panel, 2014, “Grain Fish Money: Financing Africa’s<br />
Green and Blue Revolutions,” Africa Progress Report 2014” (Geneva).<br />
Bhushan, Aniket, Yiagadeesen Samy, and Kemi Medu, 2013,<br />
“Financing the Post–2015 Development Agenda: Domestic Revenue<br />
Mobilization in Africa,” North-South Institute Research Report (Ottawa).<br />
Foster, Vivien, and Cecilia Briceño-Garmendia, 2009, “Africa’s<br />
Infrastructure: A Time for Transformation,” Africa Development Forum<br />
Series (Washington: World Bank).<br />
Gutman Jeffrey, Amadou Sy, and Soumya Chattopadhyay, 2015,<br />
Financing African Infrastructure: Can the World Deliver? (Washington:<br />
Brookings Institution).<br />
Inderst, Georg, and Fiona Stewart, 2014, Institutional Investment<br />
in Infrastructure in Emerging Markets and Developing Economies<br />
(Washington: World Bank).<br />
International Monetary Fund (IMF), 2014, Regional Economic<br />
Outlook: Sub-Saharan Africa—Staying the Course (Washington, October).<br />
———, 2015, “Making Public Investment More Efficient,” IMF Staff<br />
Report (Washington).<br />
Finance & Development June 2016 27
A FORK in<br />
the ROAD<br />
China’s new growth<br />
strategy could hurt Africa’s<br />
commodity-dependent economies<br />
Wenjie Chen and Roger Nord<br />
CHINA’S breakneck growth is slowing, and the drivers<br />
of that growth are changing from investment<br />
and exports to domestic consumption. This shift is<br />
affecting the global economy—but especially commodity<br />
exporters, many of which are in Africa. The Chinese<br />
Customs office announced recently that China’s imports from<br />
Africa fell by almost 40 percent in 2015. Slumping Chinese<br />
demand has led to precipitous price declines, putting pressure<br />
on the fiscal and external accounts of many African countries.<br />
Economic growth in sub-Saharan Africa, which averaged 5 to<br />
6 percent over the past two decades, fell below 4 percent in<br />
2015 and is expected to decline further in 2016.<br />
Yet, despite the uncertain economic environment, in<br />
December 2015 Chinese President Xi Jinping promised $60 billion<br />
in financing for Africa over the next three years, which is<br />
more than twice the amount China pledged three years earlier.<br />
Does China’s new growth model mean that Africa’s economic<br />
renaissance is over? Or can Africa adapt to the new<br />
realities and seize new opportunities, including in its engagement<br />
with China? In attempting to answer these questions,<br />
we first look back at the extraordinary growth in the economic<br />
ties between China and Africa.<br />
China’s rapid growth over the past 40 years has turned it<br />
into a major trading hub for most countries in the world—<br />
directly, or indirectly through other trading partners.<br />
A dramatic shift<br />
This is the case in sub-Saharan Africa, where a remarkable<br />
shift in trade has taken place in the past two decades. Advanced<br />
economies accounted for close to 90 percent of sub-<br />
Saharan Africa’s exports in 1995; today new partners—including<br />
Brazil, China, and India—account for over 50 percent,<br />
with China responsible for about half of that. Similarly, in<br />
2014, China became the single largest source of imports in<br />
sub-Saharan Africa.<br />
Metal and mineral products and fuel represent 70 percent<br />
of sub-Saharan African exports to China. On the other hand,<br />
the majority of sub-Saharan Africa’s imports from China are<br />
manufactured goods and machinery.<br />
Chinese workers from the Zhongyuan Petroleum Exploration Bureau<br />
(ZPEB) of Sinopec and Sudanese workers drill an oil well in South<br />
Sudan.<br />
Access to new markets for its raw materials has spurred<br />
Africa’s exports, which quintupled in real value over the past<br />
two decades. And by diversifying its trading partners, sub-<br />
Saharan Africa has reduced the volatility of its exports, which<br />
helped cushion the impact of the global financial crisis in<br />
2008–09. When recession-ravaged advanced economies cut<br />
back imports, China increased its share of exports from sub-<br />
Saharan Africa, allowing most of the region to sustain robust<br />
economic growth. Trade has also boosted living standards in<br />
Africa through access to cheap Chinese consumer goods and<br />
has contributed to low and stable inflation.<br />
Investor and lender<br />
Sub-Saharan Africa has also diversified its sources of capital.<br />
China’s foreign direct investment (<strong>FD</strong>I) in sub-Saharan Africa<br />
has increased significantly since 2006. Although the latest official<br />
statistics (2012) indicate that it is less than 5 percent of the<br />
region’s total <strong>FD</strong>I, which usually involves some form of control<br />
of an enterprise, anecdotal evidence suggests that the reality<br />
may be much higher. Many small-scale Chinese entrepreneurs<br />
have established themselves in Africa.<br />
In addition, Chinese loans to sub-Saharan Africa—many<br />
of them financing public infrastructure projects—have risen<br />
rapidly (see “Impediment to Growth” in this issue of F&D),<br />
and China’s share of total sub-Saharan African external debt<br />
28 Finance & Development June 2016
AFRICA<br />
rose from less than 2 percent before 2005 to about 15 percent<br />
in 2012. This has provided many African countries with<br />
a welcome new source of project financing. And increasingly,<br />
China is relying on Africa, which is a large source of engineering<br />
contracts to build roads and hydropower projects.<br />
China’s investment-heavy, export-oriented economic growth<br />
model made it a growing importer of commodities for most of<br />
this century. Chinese demand dramatically drove up the prices<br />
of metals, energy, and agricultural commodities to the benefit<br />
of sub-Saharan Africa’s many commodity exporters.<br />
But that has changed. Reduced investment in China has<br />
curbed its appetite for raw materials, resulting in a sharp<br />
swing in its trade balance with sub-Saharan Africa. Iron ore<br />
and oil prices, for example, have fallen by more than half<br />
from their recent peaks, and many other commodities have<br />
also suffered sharp declines. Futures markets suggest further<br />
declines in 2016 and little recovery before 2020.<br />
<strong>FD</strong>I is less cyclical and driven more by medium-term considerations<br />
than many other types of investment. But recent<br />
Chinese mine closures in sub-Saharan Africa (copper mines<br />
in Zambia, iron ore mines in South Africa, and the cancellation<br />
of an iron ore project in Cameroon, for example) suggest<br />
that returns on investment in the traditional commodity sectors<br />
are falling. In May 2015, China’s Ministry of Commerce<br />
estimated that the value of China’s <strong>FD</strong>I flows to Africa fell<br />
45.9 percent in the first quarter of 2015 compared with the<br />
same period in 2014. The number of approved projects has<br />
also been falling since 2013 (see chart).<br />
The immediate impact on commodity exporters has been<br />
severe. Oil exporters, in particular, are experiencing sharp<br />
declines in exports, putting pressure on foreign exchange<br />
reserves and exchange rates. Many commodity exporters<br />
also derive significant government revenue from natural<br />
resources and now face growing budget deficits and pressure<br />
to reduce spending. In Angola, for example, the fall in<br />
oil prices Chen, corrected wiped 4/11/20106 out about half of its revenue base, with a loss<br />
of more than 20 percent of GDP. Lower spending levels, in<br />
both the public and private sectors, have led to sharply lower<br />
growth for oil-exporting countries, now expected to average<br />
barely 2 percent in 2015–16, compared with an average of<br />
more than 7 percent in the preceding decade.<br />
Pulling back<br />
After steadily increasing direct investment in Africa since the<br />
start of the century, Chinese entities have sharply reduced<br />
the number of new projects since 2013.<br />
(number of projects)<br />
600<br />
500<br />
400<br />
300<br />
200<br />
100<br />
0<br />
2000 03 06 09 12 15<br />
Source: Chinese Ministry of Commerce.<br />
The spillovers from China are not limited to direct chan-<br />
nels such as lower export demand and global commodity price<br />
declines. There are also effects from one African economy on<br />
another. Slowdowns in large economies in sub-Saharan Africa,<br />
such as South Africa and Nigeria, affect smaller neighbors with<br />
Slowdowns in large economies<br />
in sub-Saharan Africa, such as<br />
South Africa and Nigeria, affect<br />
smaller neighbors.<br />
which they trade. Uganda, which is not a commodity exporter, is<br />
affected by the economic contraction in South Sudan, which had<br />
become an important destination for Uganda’s regional exports.<br />
Countries such as South Africa, Zambia, and the Democratic<br />
Republic of Congo are important exporters to China and also<br />
are large importers from other African countries.<br />
A silver lining<br />
But the dark clouds have at least two silver linings. China’s recent<br />
pledge to more than double the financing for Africa to<br />
$60 billion over the coming three years reflects both a strong<br />
commitment to the continent and the continued availability of<br />
ample financing for Chinese investors. Of course, it will require<br />
identifying new commercial opportunities, likely outside of the<br />
traditional natural resources sectors. But the recent surge in<br />
Chinese outward capital flows, especially from Chinese businesses,<br />
signals a continued appetite among Chinese investors to<br />
make investments and seek high returns outside their economy.<br />
Africa’s non-commodity-dependent frontier economies in east<br />
Africa, for example, could be attractive new growth markets.<br />
Moreover, global demographic trends provide an opportunity<br />
for sub-Saharan Africa to benefit from China’s new<br />
growth model (See “Surf the Demographic Wave,” in the<br />
March 2016 F&D). Bangladesh and Vietnam have already<br />
stepped into the global garment and textile value chains once<br />
dominated by China, which is moving up to other highervalue-added<br />
supply chains. In a supply chain, various stages<br />
of making a product, from extracting raw materials to final<br />
assembly, are performed in firms located in several countries.<br />
By 2035, the number of sub-Saharan Africans reaching<br />
working age (15–64) will exceed that of the rest of the<br />
world combined. If sub-Saharan Africa countries can reduce<br />
infrastructure bottlenecks, improve the business climate, and<br />
diversify their economies and increase their integration into<br />
global value chains over the coming decades, they will have<br />
a historic opportunity to decisively boost growth and reduce<br />
poverty on the continent. It will be up to the continent’s policymakers<br />
to seize this opportunity. ■<br />
Wenjie Chen is an Economist and Roger Nord is Deputy<br />
Director, both in the IMF’s African Department.<br />
Finance & Development June 2016 29
Runaway<br />
Nigeria’s film industry<br />
is taking off<br />
SUCCESS<br />
Nigerian actor Wole Ojo and Moroccan actress Fatym Layachi during the shooting of the movie The CEO in Lagos, Nigeria.<br />
Steve Omanufeme<br />
SHE was named one of the 100 most influential people<br />
by TIME magazine in 2013, alongside Michelle<br />
Obama and Beyoncé. She has more than 1 million<br />
likes on her Facebook page. She is a United Nations<br />
World Food Programme ambassador and an Amnesty International<br />
activist. She is certainly one of the most popular actors<br />
most people outside Africa have never heard of.<br />
Meet Omotola Jalade Ekeinde, the queen of Nollywood, the<br />
Nigerian film industry. With more than 300 films, and millions<br />
of video copies sold, she is living proof of Nigeria’s film<br />
industry dynamism. After decades of slow growth, Nollywood,<br />
one of the largest film industries in the world in terms of number<br />
of films produced, is a story of runaway success.<br />
The industry currently accounts for N 853.9 billion ($7.2<br />
billion), or 1.42 percent of Nigeria’s GDP. It employs more<br />
than a million people directly or indirectly. It is being touted<br />
as the country’s second-biggest source of jobs after agriculture.<br />
Based on the sheer quantity and quality of films being<br />
made, economic observers consider Nollywood one of the<br />
major planks on which to diversify the Nigerian economy.<br />
According to Roberts Orya, former CEO of the Nigerian<br />
Export-Import Bank, a development bank owned by the<br />
federal government, Nollywood generates at least $590 million<br />
annually. That is still a small number, given the scale<br />
of Nigeria’s economy and its population, but the industry is<br />
making a difference.<br />
According to Charles Awurum, actor and producer, the<br />
impact of Nollywood on Nigeria is there for all to see. “If for<br />
nothing else, Nollywood has created thousands of jobs for<br />
so many Nigerians. The industry is open to all who are talented<br />
in all areas of the motion picture industry. It has drastically<br />
prevented and reduced the crime rate in the country,<br />
put food on people’s table—and the multiplier effect is tremendous.<br />
It is an industry that if given the enabling environment<br />
will be the country’s number one revenue earner. It has<br />
improved the lifestyles of Nigerians,” he said.<br />
African success story<br />
Nollywood films have a large following in Africa and among<br />
the African diaspora. These films gained popularity during<br />
the digital revolution of the early 1990s, when camcorders<br />
replaced 35 mm cameras and digital systems replaced celluloid<br />
as recording devices. Nigeria continued to use the inexpensive<br />
VHS tapes and players, which were easily accessible<br />
and affordable for consumers, but eventually film technology<br />
evolved as movies on DVD started to generate huge demand.<br />
Producing a movie in Nigeria costs between $25,000 and<br />
$70,000 on average. Films are produced within a month and<br />
are profitable within two to three weeks of release. On average<br />
movies released as DVDs are reported to sell more easily,<br />
to the tune of 20,000-plus units, and top-rated successful<br />
ones sell more than 200,000 units.<br />
30 Finance & Development June 2016
Patrick Ebewo, a Nigerian writer, attributes the popularity<br />
of Nigerian movies not only to their low unit cost but<br />
also to their “indigenous content of issues relevant to a mass<br />
audience.” Through a combination of African story lines<br />
and Western technology, “these films document and recreate<br />
socio-political and cultural events,” he said. The former<br />
director-general of the United Nations Educational, Scientific<br />
and Cultural Organization, Kōichirō Matsuura, says that<br />
“film and video production are shining examples of how cultural<br />
industries, as vehicles of identity, values, and meanings,<br />
The Nollywood film industry is not<br />
just about entertainment; it is also<br />
a moneymaker.<br />
can open the door to dialogue and understanding between<br />
peoples, but also to economic growth and development.”<br />
Actress Ebube Nwagbo notes that Nollywood has put<br />
Nigeria in a positive light by placing it on the world map.<br />
“There are lots of reasons for the industry’s success in<br />
Africa, but most importantly, it is the acceptance and recognition.<br />
They have accepted Nollywood. It’s definitely an<br />
industry to reckon with. We have been able to tell our stories<br />
in our own African way, and Africans can identify and<br />
relate to it,” she said.<br />
Lillian-Amah Aluko, actress, producer, and scriptwriter,<br />
attributes Nollywood’s success in Africa to its portrayal of<br />
Africans telling African stories in their own way and often<br />
in their own languages. “The thirst and hunger for local<br />
productions has made way for the rise of pay-per-view<br />
TV on the continent, which in turn has helped put some<br />
funding in the way of producers, either by purchasing their<br />
content or commissioning productions. Also the rise of<br />
Internet use on the continent has helped bridge a little of<br />
the distribution problems, as content is also now available<br />
online,” she notes.<br />
A long history<br />
Though filmmaking was on the rise in the 1960s, Nigeria’s<br />
domestic video industry, Nollywood, made a dramatic leap<br />
in 1992 with the release of the thriller Living in Bondage. The<br />
film, written by Kenneth Nnebue and Okechukwu Ogunjiofor,<br />
tells the story of a businessman who killed his wife in a<br />
human sacrifice ritual that made him rich overnight but who<br />
is then haunted by her ghost. It instantly became the first<br />
Nigerian blockbuster. Since then, thousands of releases have<br />
been similarly successful.<br />
The release of Living in Bondage sparked the revival of the<br />
domestic video industry, which had started decades before.<br />
In fact the Nnebue experiment followed years of hard work<br />
by pioneering filmmakers such as Hubert Ogunde, Jab Adu,<br />
Ola Balogun, Moses Olaiya (Baba Sala), and Eddie Ugboma.<br />
The industry considers these professionals the first generation<br />
of Nigerian filmmakers.<br />
Nigeria became fully involved in the production of films<br />
in the 1970s, when the first indigenous feature film, Kongi’s<br />
Harvest, written by Nobel Prize laureate Wole Soyinka, was<br />
produced in the country. But an American directed the film,<br />
and many of its crewmembers were foreigners. Later, more<br />
people, such as Balogun, Ugbomah, and Ladi Ladebo, to<br />
mention a few, got involved in producing indigenous films.<br />
Because Nigeria has such a long history of film making, many<br />
people criticize the term Nollywood for its lack of originality,<br />
merely aping the labels of the two largest film industries—<br />
Hollywood in the United States and Bollywood in India.<br />
The importance of Nollywood to the Nigerian economy<br />
was only fully realized when the Nigerian GDP was rebased<br />
in 2014. The sectors captured in the rebasing exercise were<br />
arts, entertainment, and recreation; financial institutions and<br />
insurance; real estate, professional, scientific, and technical<br />
services; administrative and support services; public administration,<br />
education, human health, and social services; and<br />
other services—these had previously not been included in<br />
GDP at all. Among the segments included for the first time<br />
were Nollywood, the information technology sector, the<br />
music industry, online sales, and telecommunications. As a<br />
result of this rebasing exercise, Nigeria’s GDP in 2013 jumped<br />
from an initial estimate of $285.5 billion to $510 billion.<br />
Opportunities for growth<br />
Clearly, the Nollywood film industry is not just about entertainment;<br />
it is also a moneymaker. The spread of digital<br />
technology has been identified as a growth driver for the film<br />
industry and will continue to play that role as domestic and<br />
foreign consumption continue to rise. Greater Internet access,<br />
increased smartphone use, and improved bandwidth are also<br />
contributing to a production boom.<br />
An increase in demand for programming is likely to generate<br />
new opportunities for content producers too. According<br />
to a PricewaterhouseCoopers report, Nigeria’s entertainment<br />
and media revenue could more than double, to an estimated<br />
$8.5 billion in 2018, from $4 billion in 2013, with the Internet<br />
a key driver. The number of mobile Internet subscribers is<br />
forecast to surge to 50.4 million in 2018, from 7.7 million in<br />
2013, according to the report. In addition, the region’s growing<br />
young population and the development of the Internet<br />
represent huge potential for the industry.<br />
Likewise, pay-TV penetration is forecast to reach 24.4 percent<br />
in 2018, with competition among digital terrestrial television<br />
operators set to grow after Nigeria migrates to digital.<br />
But there is some doubt whether the country will be able to<br />
meet the June 2016 digital switchover deadline—set by a 2006<br />
agreement brokered by the United Nations’ International<br />
Telecommunication Union.<br />
Platforms such as Nigeria’s iROKOtv offer new distribution<br />
channels for the more than 2,000 Nollywood films produced<br />
annually. The tech company, which pays filmmakers<br />
about $10,000 to $25,000 for the right to stream their content<br />
for a period of time, claims to be the world’s largest online<br />
distributor of African content, with a catalogue of 5,000<br />
Nollywood films.<br />
Finance & Development June 2016 31
A girl sorts through DVDs at the Nigerian film market in Lagos, Nigeria.<br />
As Nollywood matures, consumers’ expectations are likely to<br />
change, and current practices and pricing and delivery methods<br />
may need review. With the emergence of alternative movie distribution<br />
technologies, such as those offered by services such as<br />
Apple Store and Netflix, consumers will demand more.<br />
The need for homegrown content remains crucial to the<br />
development of the industry. For Charles Igwe, filmmaker<br />
and CEO of the production firm Nollywood Global, content<br />
is quickly going digital, with an explosion of film content<br />
in all forms. “Big telecoms companies will have to improve<br />
delivery … creating the capacity to make content is imperative<br />
if we are going to exist in this space.”<br />
Dealing with the pirates<br />
However, Nollywood’s popularity also means serious piracy<br />
problems. Based on data from the World Bank, news website<br />
TRUEAfrica.co estimates that for every legitimate copy sold,<br />
nine others are pirated. This means little or no income going to<br />
the filmmakers and practically no revenue for the government.<br />
Nollywood movies are increasingly consumed outside<br />
Nigeria. The retailers of these movies are few and far between<br />
in most cities. And despite the success of the movies, Nollywood<br />
actors’ incomes are low. Even the most popular are paid only<br />
between $1,000 and $3,000 a film. Only a few can claim higher<br />
earnings. It appears likely that illegal downloads and bootleg<br />
DVDs will continue to undercut revenue.<br />
The country is taking steps to strengthen intellectual property<br />
rights, including a $9.85 million state fund to improve Nigeria’s<br />
content distribution network. The current collaboration between<br />
the World Bank and the Nigerian Export Promotion Council,<br />
the Nigerian Copyright Commission, and the National Film and<br />
Video Censors Board is therefore necessary and urgent, many<br />
analysts believe.<br />
Over time, Nollywood will have to abandon the current pricing<br />
and supply models that have served it so well and gravitate<br />
toward more globally acceptable standards. The industry<br />
is already stepping up its standards to match those of other<br />
countries’ film industries. A new group of professional actors—<br />
among them, Genevieve Nnaji, Ramsey Nouah, Kunle Afolayan,<br />
and Desmond Elliot—is coming on stage.<br />
Nollywood and its Queen Omotola, who recently topped<br />
the charts at $32,000 a film, are bracing for new opportunities<br />
and new records. ■<br />
Steve Omanufeme is a business journalist based in Lagos.<br />
Dismal science?<br />
IMF<br />
Listen to our podcast interviews with top economic<br />
experts and decide: www.imf.org/podcasts<br />
32 Finance & Development June 2016
Off Its Pinnacle<br />
Robert J. Gordon<br />
THE average American family of<br />
1870 would have been astounded<br />
by the living standards of their 1970<br />
descendants. From electric lighting<br />
to healthier and longer life spans, in but a century<br />
the American standard of living changed<br />
dramatically from the primitive conditions<br />
of 1870 to the modern world of today. Those<br />
sweeping improvements were in no small way<br />
due to technological changes that may never<br />
be rivaled for their broad impact on growth,<br />
productivity, and well-being.<br />
My recently published book, The Rise and<br />
Fall of American Growth, chronicles those<br />
changes, examines their sources, and looks<br />
at why productivity grew rapidly before 1970<br />
and much more slowly since then. It also<br />
forecasts muted growth in productivity and<br />
income per person from 2015 to 2040.<br />
revolutionary century after the U.S. Civil War<br />
was made possible by a unique clustering, in<br />
the late 19th century, of “great inventions,”<br />
principal among which were electricity and<br />
the internal combustion engine.<br />
The first industrial revolution, between<br />
1770 and 1830, witnessed the arrival of the<br />
steam engine, railroads, steamships, and<br />
mechanized cotton spinning and weaving.<br />
The most important industrial revolution<br />
was the second, with inventions centered on<br />
Is the United<br />
States entering<br />
a period of<br />
sustained<br />
low economic<br />
growth?<br />
The special century<br />
The 100 years after 1870 witnessed an economic<br />
revolution in which households were<br />
freed from an unremitting daily grind of<br />
painful manual labor, household drudgery,<br />
darkness, isolation, and early death. In only<br />
a century daily life changed beyond recognition.<br />
Manual outdoor jobs were replaced<br />
by work in air-conditioned environments,<br />
housework was increasingly performed by<br />
electric appliances, darkness was replaced by<br />
light, and isolation was replaced not just by<br />
travel, but also by color television images that<br />
brought the world into the living room. Most<br />
important, a newborn infant could expect to<br />
live not to age 45, but to age 72. The economic<br />
revolution of 1870 to 1970 was unique in<br />
human history.<br />
The foundation of the book’s analysis is that<br />
economic growth is not a steady process that<br />
creates economic advance at an even, regular<br />
pace. Instead, progress occurs much more<br />
rapidly in some eras than in others. There was<br />
virtually no economic growth for millennia<br />
until 1770, only slow growth in the transition<br />
century before 1870, and remarkably rapid<br />
growth in the century ending in 1970. Growth<br />
has been slower since then because some<br />
inventions are more important than others. The<br />
Workers put the finishing touches on a 1949 Ford sedan.<br />
Finance & Development June 2016 33
the period between 1870 and 1940, including not just electricity<br />
and the internal combustion engine but also communication<br />
and entertainment devices such as the telephone,<br />
radio, and motion pictures, as well as chemicals, plastics,<br />
antibiotics, and the tools of modern medicine. The second<br />
industrial revolution is also notable for its radical improvement<br />
in working conditions on the job and at home. The<br />
third industrial revolution comprises the digital inventions<br />
since 1960, including the mainframe and personal computer,<br />
the Internet, and mobile telephones.<br />
The economic growth since 1970 created by the third<br />
industrial revolution has been simultaneously dazzling and<br />
disappointing. This seeming paradox is resolved when we recognize<br />
that advances since 1970 have tended to be channeled<br />
into a narrow sphere of human activity involving entertainment,<br />
communication, and the collection and processing of<br />
information. Technology for processing information evolved<br />
from the mainframe to networked personal computers,<br />
search engines, and e-commerce. Communication advanced<br />
from dependence on landline phones to ever smaller and<br />
smarter mobile phones. But for the rest of what humans care<br />
about—food, clothing, shelter, transportation, health, and<br />
working conditions both inside and outside the home—progress<br />
slowed both qualitatively and quantitatively after 1970.<br />
Any consideration of future U.S. economic progress must<br />
look beyond the pace of innovation to include the headwinds<br />
that are blowing with gale-like force to slow progress. Chief<br />
among them is the rise of inequality that since the late 1970s<br />
has steadily directed an increasing share of the fruits of U.S.<br />
growth to those at the top of the income distribution. Other<br />
headwinds include the slowing rate of advance of educational<br />
attainment, the drain on economic growth caused by the<br />
aging of the population and the retirement of the baby-boom<br />
generation, and the fiscal challenge of a rising debt-to-GDP<br />
ratio as the old-age income and health programs—Social<br />
Security and Medicare—approach insolvency.<br />
Measures and mismeasures of progress<br />
The diminished impact of innovation, due to the narrower<br />
scope of the post-1970 inventions, is evident when growth<br />
rates of labor productivity and total factor productivity are<br />
compared across selected eras of the past 125 years. The<br />
growth rate of labor productivity (output per hour) was 2.82<br />
percent a year in the period 1920–70, more than a full percentage<br />
point faster than in 1890–1920 or in the period that<br />
extends from 1970 to 2014. Each vertical bar in Chart 1 is divided<br />
into three parts to break down the contribution to productivity<br />
growth of rising educational attainment, the steadily<br />
rising amount of capital input per worker hour—usually called<br />
capital deepening—and what remains after deducting the<br />
contributions of education and capital deepening, total factor<br />
productivity (TFP), the best proxy available for the underlying<br />
effect of innovation and technological change on economic<br />
growth. Because the contributions of education and capital<br />
deepening were roughly the same in each of the three time<br />
intervals, all of the faster growth of labor productivity between<br />
1920 and 1970 was the result of more rapid innovation<br />
and technological change. The margin of superiority of TFP<br />
growth in the 1920–70 interval is almost triple the growth rate<br />
in the other two periods.<br />
Are these very different TFP growth rates credible? A<br />
major theme of my book is that real GDP, the numerator of<br />
output per hour, greatly understates the improvement in the<br />
standard of living, particularly for the United States in the<br />
special 1870–1970 century. First, changes in real GDP omit<br />
many dimensions of improvement in the quality of life that<br />
matter to people. Second, the price indices used to convert<br />
current-dollar spending to constant inflation-adjusted “real”<br />
dollars overstate price increases. The improvements in the<br />
standard of living that are missed by real GDP data seem to<br />
be more important before 1970 than after. Among the more<br />
important are the value of clean running water, waste disposal,<br />
and the indoor bathroom, not to mention the reduction<br />
in infant mortality from 22 percent in 1890 to less than<br />
1 percent after 1950. An explicit allowance for declining<br />
infant mortality greatly increases the peaking of TFP growth<br />
in Gordon, the 1929–50 corrected 04/11/2016 interval, as does an allowance for the greater<br />
leisure associated with shorter work hours.<br />
After 1970, real GDP continued to miss the value of<br />
advances, but the extent of the mismeasurement declined<br />
along with the narrower scope of innovation. And the mea-<br />
Chart 1<br />
Sourcing productivity<br />
The fast growth of labor productivity from 1920 to 1970<br />
compared with periods before and after is due mainly to total<br />
factor productivity, which represents innovation and technical<br />
change.<br />
(annual growth in U.S. productivity and its components, percent)<br />
3<br />
2.82<br />
Education<br />
Capital deepening<br />
Total factor productivity<br />
2<br />
1.62<br />
1.5<br />
1<br />
0<br />
1890–1920 1920–70 1970–2014<br />
Source: Gordon (2016).<br />
Note: Capital deepening is the contribution to labor productivity growth of more capital per<br />
worker hour. Productivity is output per worker hour. Total factor productivity is the portion of<br />
output not the result of inputs (capital and labor).<br />
34 Finance & Development June 2016
surement of price change improved, with the introduction<br />
of price indices that adjust for quality changes in information<br />
technology equipment. Moreover, in contrast to the era<br />
before 1936, when there was no consumer price index (CPI)<br />
for automobiles, during the postwar years quality changes in<br />
new automobiles were carefully measured by the CPI, including<br />
the value of government-mandated antipollution devices.<br />
The third industrial revolution<br />
To understand the sources of today’s slow growth, consider<br />
the decline in the growth rate of labor productivity since<br />
1955 when a so-called Kalman filter is used to smooth the<br />
data and remove any correlation with ups and downs in the<br />
unemployment rate over the business cycle (see Chart 2). It<br />
shows that after 1955 labor productivity growth proceeded<br />
through four stages. It was fast in the 1950s and 1960s, slower<br />
from the 1970s to 1995, and fast again in a temporary revival<br />
from 1995 to 2004. Since then there has been a precipitous<br />
slowdown. The actual rate of productivity growth over the six<br />
years ending in 2015 was a mere 0.5 percent a year. Why did<br />
the productivity revival of the late 1990s die out so quickly?<br />
Most of the economy realized a one-time benefit from the<br />
Internet and Web revolution, but methods of production<br />
have changed little since. These major sectors include agriculture,<br />
mining, construction, retail trade, transportation,<br />
finance, insurance, real estate, professional and business services,<br />
education, health, arts and entertainment, accommo-<br />
Gordon, corrected 4/11/20106<br />
dation and food services, and government. In each of these<br />
sectors, paper-dependent business procedures typical of 1970<br />
had by 2005 been replaced by digitization, and flat screens<br />
were everywhere. The revolutions in everyday life made<br />
Chart 2<br />
Slowdown<br />
Labor productivity growth was rapid in the 1950s and 1960s,<br />
slower from the 1970s to 1995, and fast again until 2004<br />
and has been dramatically slower since then.<br />
(growth rate, U.S. productivity, percent)<br />
3<br />
2<br />
1<br />
0<br />
1955 65 75 85 95 2005 15<br />
Source: Gordon (2016).<br />
Note: A Kalman filter was applied to smooth the data and remove any correlation with<br />
ups and downs of the unemployment rate over the business cycle. Productivity is output<br />
per worker.<br />
possible by e-commerce and search engines were already<br />
well established—Amazon dates to 1994, Google to 1998,<br />
and Wikipedia and iTunes to 2001. Facebook was founded<br />
in 2004. Will future innovations be sufficiently powerful<br />
and widespread to duplicate the brief revival in productivity<br />
growth between 1996 and 2004? A look at many of the<br />
important economic sectors that experienced that revival<br />
suggest that the answer is, “Unlikely.”<br />
Stasis in the office: The digital revolution of 1970–2000<br />
utterly changed the way offices function. In 1970 the electronic<br />
calculator had just been invented, but the computer<br />
terminal was still in the future. Office work required innumerable<br />
clerks to operate the keyboards of electric typewriters<br />
that could not download content from the rest of the<br />
world. Memory typewriters were just being introduced, so<br />
there was still repetitive retyping. By 2000, though, every<br />
office was equipped with Web-linked personal computers<br />
that could not only perform any word-processing task but<br />
could also download multiple varieties of content and perform<br />
any type of calculation at blinding speed. By 2005 the<br />
introduction of flat screens had completed the transition to<br />
the modern office. But then progress stopped. The equipment<br />
used in office work and the productivity of office employees<br />
closely resemble the office of a decade ago.<br />
Stasis in retailing: Since the development of big-box<br />
retailers in the 1980s and 1990s, and the conversion of<br />
checkout aisles to bar-code scanners, little has changed in<br />
the retail sector. Payment methods have gradually changed<br />
from cash and checks to credit and debit cards. In the early<br />
years of credit cards in the 1970s and 1980s, checkout clerks<br />
had to make voice phone calls for authorization, then terminals<br />
that dialed the authorization phone number took<br />
over. Now the authorization arrives within seconds. Bigbox<br />
retailers brought with them many other aspects of the<br />
productivity revolution. They transformed supply chains,<br />
wholesale distribution, inventory management, pricing,<br />
and product selection. But that productivity-enhancing<br />
shift from traditional small-scale retailing is largely over.<br />
E-commerce raises productivity but still accounts for only<br />
about 6 percent of total retail trade (Hortaçsu and Syverson,<br />
2015). The retail productivity gains that are a major accomplishment<br />
of the third industrial revolution will be difficult<br />
to surpass in the next several decades.<br />
Stasis in finance and banking: The revolution in information<br />
and communications technology changed finance and<br />
banking along many dimensions—from the humble streetcorner<br />
ATM to the development of fast trading on the stock<br />
exchanges. But both the ATM and billion-share trading days<br />
are creations of the 1980s and 1990s. Nothing much has<br />
changed since. And despite all those ATMs, the United States<br />
Finance & Development June 2016 35
still maintains a system of 97,000 bank branches, many of<br />
which are empty much of the time.<br />
Stasis in consumer electronics: Television made its transition<br />
to color between 1965 and 1972. Variety increased with<br />
cable television in the 1970s and 1980s, and picture quality<br />
was improved with high-definition signals and receiving sets.<br />
Variety increased even further when Blockbuster, and then<br />
Netflix, made it possible to rent an almost infinite variety of<br />
motion picture DVDs. Now movie streaming is common.<br />
Further, homes have experienced the same access to Web<br />
information and entertainment, as well as to e-commerce,<br />
that arrived a few years earlier in the office. But smartphones<br />
and tablets have saturated their potential market, and further<br />
advances in consumer electronics have become less impressive.<br />
Decline in business dynamism: Recent research has used<br />
the word “dynamism” to describe the process of creative<br />
destruction Gordon, corrected by 4/11/20106 which start-up and young firms become the<br />
source of productivity gains by introducing best-practice<br />
technologies and methods and shifting resources away from<br />
old low-productivity firms. The share of total employment<br />
accounted for by firms no older than five years declined<br />
Chart 3<br />
Investment declines<br />
Net investment has averaged 3.3 percent of total capital stock<br />
since 1955, but it was almost always above that average<br />
before 1987 and, but for a few years in the 1990s, has been<br />
below it since 1987.<br />
(net investment to capital stock, percent)<br />
6<br />
5<br />
4<br />
3<br />
1950–2007 average<br />
Gordon,<br />
2<br />
corrected 04/5/2016<br />
1<br />
0<br />
1950 60 70 80 90 2000 10<br />
Source: Gordon (2016).<br />
Note: The data represent a five-year moving average of the ratio of net private investment to<br />
private business capital stock.<br />
Chart 4<br />
Swings in production ability<br />
Manufacturing capacity rose steadily between 1977 and<br />
1995, peaked in 2000, and slumped after that.<br />
(annual change in manufacturing capacity, percent)<br />
7<br />
6<br />
5<br />
4<br />
3<br />
2<br />
1<br />
0<br />
–1<br />
1977 82 87 92 97 2002 07 12<br />
Source: Gordon (2016).<br />
Note: Data represent an annualized five-year change in manufacturing capacity.<br />
Both the ATM and billion-share<br />
trading days are creations of the<br />
1980s and 1990s.<br />
by almost half from 19.2 percent in 1982 to 10.7 percent in<br />
2011. This decline was pervasive across retailing and services,<br />
and after 2000 the high-tech sector experienced a large<br />
decline in start-ups and fast-growing young firms (Davis and<br />
Haltiwanger, 2014).<br />
Decline in net investment: An important component of the<br />
slowdown in economic growth has been the behavior of net<br />
investment. As a share of the capital stock, real net investment<br />
averaged 3.3 percent over the period 1950–2007. But<br />
the actual values were almost always above that average<br />
before 1987 and, but for a few years in the late 1990s, have<br />
almost always been below it since 1987 (see Chart 3). Some<br />
commenters say the decline in net investment is a cause of<br />
the productivity slowdown, but there is also a reverse causation:<br />
the slump in investment is the result of the diminished<br />
impact of innovations. Firms have plenty of cash that could<br />
be invested, but they prefer instead to buy back shares.<br />
Declining growth of manufacturing capacity: As shown<br />
above, the revival in productivity growth between 1995 and<br />
2004 was unique in the post-1970 era. Equally unique was<br />
the soaring temporary growth in the capacity of the manufacturing<br />
sector (see Chart 4). The average growth rate of<br />
capacity ranged between 2 and 3 percent from 1977 to 1995,<br />
rose to a peak of 6.8 percent in 2000, and then fell in most<br />
years after 2007 to less than 1 percent. Much of the growth in<br />
capacity in the late 1990s was associated with the information<br />
technology investment boom, but since 2011 most information<br />
technology investment equipment has been imported.<br />
Assessing the future<br />
The point of departure in forecasting growth in productivity<br />
and the standard of living from 2015 to 2040 is a division of<br />
the time period since 1970 into three intervals—1970–94,<br />
1994–2004, and 2004–15. As we have seen, the atypical<br />
1994– 2004 interval, when output per hour grew at 2.26 percent<br />
a year, is unlikely to be repeated. The sharp upward shift<br />
in productivity associated with the digital revolution that replaced<br />
paper, file-card catalogs, file cabinets, and linotype<br />
operators with proprietary and Internet software, electronic<br />
catalogs, and flat screens emerged largely during this period.<br />
Since that decade is not a relevant basis for the likely future<br />
growth of productivity, the baseline reference point is the<br />
average growth rate achieved from 1970 to 1994 and from<br />
2004 to 2015, or 1.38 percent a year. When we subtract 0.18<br />
percentage point to reflect the slowing advance of educational<br />
attainment, the projected 2015–40 labor productivity<br />
growth rate is 1.20 percent (see Chart 5). This compares to a<br />
rate of 2.26 percent a year from 1920 to 2014.<br />
36 Finance & Development June 2016
Employees do paperwork at the brokerage house of Merrill Lynch, Pierce,<br />
Fenner & Smith, New York, United States,1965.<br />
The newsroom in the Washington Post’s new building<br />
in Washington, D.C., United States, 2016.<br />
To translate projected growth in output per hour to output<br />
per person, 0.4 percentage point is deducted annually,<br />
mainly to account for the retirement of the baby-boom generation.<br />
This results in a 2015–40 forecast for output per<br />
person of 0.80 percent a year, contrasting with the historical<br />
rate of 2.11 percent a year. To get to median income per<br />
person, another 0.40 percentage point a year is subtracted<br />
to reflect a continued rise in inequality at roughly the same<br />
rate experienced from 1975 to 2014. An additional subtraction<br />
of 0.1 percentage point is made for anticipated cuts in<br />
social Gordon, benefits corrected 04/11/2016 or increases in Social Security and Medicare<br />
taxes that will be needed to counteract the upward creep in<br />
the federal debt-to-GDP ratio because of an aging population.<br />
The resulting forecast for 0.3 percent annual growth in<br />
per capita disposable median income (that is, the amount<br />
Chart 5<br />
Future shock<br />
By a variety of measures of real income, growth will be<br />
substantially slower in the coming quarter-century than in<br />
the preceding 95 years.<br />
(annual growth rate, percent)<br />
3<br />
2.26<br />
2.11<br />
1920–2014<br />
2015–40<br />
2<br />
1.82<br />
1.69<br />
1.20<br />
1<br />
0.8<br />
0.4 0.3<br />
0<br />
Output per hour Output Median income Disposable<br />
per person per person median income<br />
per person<br />
Source: Gordon (2016).<br />
Note: Data for 1920 through 2014 are actual; from 2015 to 2040 data are projected. To<br />
translate output per hour to output per person 0.4 percentage point is subtracted to reflect<br />
the larger number of nonworking people, largely the result of baby boomer retirement. In<br />
calculating median income per person, another 0.4 percentage point is deducted to reflect<br />
the effects of continued rising inequality. To calculate median disposable income another<br />
0.1 percentage point is deducted to account for anticipated cuts in social benefits or<br />
increases in taxes to support them.<br />
of total income that can be spent) contrasts with the rate of<br />
1.69 percent a year achieved from 1920 to 2014.<br />
While the forecasts may appear pessimistic, they do not<br />
countenance an end to innovation and technical change.<br />
On the contrary, the prediction of 1.20 percent productivity<br />
growth is very similar to 1970–94 and 2004–15. A compound<br />
1.2 percent growth rate would imply a level of labor productivity<br />
in the year 2040 that is 35 percent above that in 2015, and<br />
would be achieved by further innovations in robotics, artificial<br />
intelligence and big data, 3-D printing, and driverless vehicles.<br />
But while innovation continues, the median growth rate of<br />
real income per person will be less than productivity growth<br />
because of an aging of the population and rising inequality.<br />
Government policy can affect these impediments to median<br />
income growth. The best offset to the retirement of the babyboom<br />
generation is substantially increased immigration to<br />
lower the average age of the population and to raise the proportion<br />
that is working. A larger working population would<br />
raise tax revenue and counteract future increases in the<br />
debt-to-GDP ratio from the aging of the population. As for<br />
inequality, the government cannot prevent successful CEOs,<br />
entertainment stars, and entrepreneurs from earning high<br />
incomes, but it can use progressive taxation to redistribute<br />
income and promote more equality of after-tax incomes.<br />
Robert J. Gordon is the Stanley G. Harris Professor of the<br />
Social Sciences at Northwestern University.<br />
References:<br />
Davis, Stephen J., and John Haltiwanger, 2014, “Labor Market Fluidity<br />
and Economic Performance,” NBER Working Paper 20479 (Cambridge,<br />
Massachusetts: National Bureau of Economic Research).<br />
Gordon, Robert J., 2016, The Rise and Fall of American Growth:<br />
The U.S. Standard of Living since the Civil War (Princeton, New Jersey:<br />
Princeton University Press).<br />
Hortaçsu, Ali, and Chad Syverson, 2015, “The Ongoing Evolution<br />
of US Retail: A Format Tug-of-War,” NBER Working Paper 21464<br />
(Cambridge, Massachusetts: National Bureau of Economic Research).<br />
Finance & Development June 2016 37
Inside the stock exchange in Santiago, Chile, one of the<br />
first countries to adopt a form of neoliberal policies.<br />
Neoliberalism:<br />
Oversold?<br />
Jonathan D. Ostry, Prakash Loungani, and Davide Furceri<br />
Instead of<br />
delivering<br />
growth, some<br />
neoliberal<br />
policies have<br />
increased<br />
inequality,<br />
in turn<br />
jeopardizing<br />
durable<br />
expansion<br />
MILTON Friedman in 1982 hailed<br />
Chile as an “economic miracle.”<br />
Nearly a decade earlier, Chile<br />
had turned to policies that have<br />
since been widely emulated across the globe.<br />
The neoliberal agenda—a label used more by<br />
critics than by the architects of the policies—<br />
rests on two main planks. The first is increased<br />
competition—achieved through deregulation<br />
and the opening up of domestic markets, including<br />
financial markets, to foreign competition.<br />
The second is a smaller role for the state,<br />
achieved through privatization and limits on<br />
the ability of governments to run fiscal deficits<br />
and accumulate debt.<br />
There has been a strong and widespread<br />
global trend toward neoliberalism since the<br />
1980s, according to a composite index that<br />
measures the extent to which countries introduced<br />
competition in various spheres of economic<br />
activity to foster economic growth.<br />
As shown in the left panel of Chart 1, Chile’s<br />
push started a decade or so earlier than 1982,<br />
with subsequent policy changes bringing it<br />
ever closer to the United States. Other countries<br />
have also steadily implemented neoliberal<br />
policies (see Chart 1, right panel).<br />
There is much to cheer in the neoliberal<br />
agenda. The expansion of global trade<br />
has rescued millions from abject poverty.<br />
Foreign direct investment has often been a<br />
way to transfer technology and know-how to<br />
developing economies. Privatization of stateowned<br />
enterprises has in many instances led<br />
to more efficient provision of services and<br />
lowered the fiscal burden on governments.<br />
However, there are aspects of the neoliberal<br />
agenda that have not delivered as expected.<br />
Our assessment of the agenda is confined to<br />
the effects of two policies: removing restrictions<br />
on the movement of capital across a<br />
country’s borders (so-called capital account<br />
liberalization); and fiscal consolidation, sometimes<br />
called “austerity,” which is shorthand<br />
38 Finance & Development June 2016
for policies to reduce fiscal deficits and debt levels. An assessment<br />
of these specific policies (rather than the broad neoliberal<br />
agenda) reaches three disquieting conclusions:<br />
• The benefits in terms of increased growth seem fairly difficult<br />
to establish when looking at a broad group of countries.<br />
• The costs in terms of increased inequality are prominent.<br />
Such costs epitomize the trade-off between the growth<br />
and equity effects of some aspects of the neoliberal agenda.<br />
• Increased inequality in turn hurts the level and sustainability<br />
of growth. Even if growth is the sole or main purpose<br />
of the neoliberal agenda, advocates of that agenda still need<br />
to pay attention to the distributional effects.<br />
Open and shut?<br />
As Maurice Obstfeld (1998) has noted, “economic theory leaves<br />
no doubt about the potential advantages” of capital account liberalization,<br />
which is also sometimes called financial openness.<br />
It can allow the international capital market to channel world<br />
savings to their most productive uses across the globe. Developing<br />
economies with little capital can borrow to finance investment,<br />
thereby promoting their economic growth<br />
without requiring sharp increases in their own<br />
saving. But Obstfeld also pointed to the “genuine<br />
hazards” of openness to foreign financial flows<br />
and concluded that “this duality of benefits and<br />
risks is inescapable in the real world.”<br />
This indeed turns out to be the case. The<br />
link between financial openness and economic<br />
growth is complex. Some capital inflows, such as<br />
foreign direct investment—which may include<br />
a transfer of technology or human capital—do<br />
seem to boost long-term growth. But the impact<br />
of other flows—such as portfolio investment<br />
and banking and especially hot, or speculative,<br />
debt inflows—seem neither to boost growth nor<br />
allow the country to better share risks with its<br />
trading partners (Dell’Ariccia and others, 2008;<br />
Ostry, Prati, and Spilimbergo, 2009). This suggests<br />
that the growth and risk-sharing benefits<br />
of capital flows depend on which type of flow<br />
is being considered; it may also depend on the<br />
nature of supporting institutions and policies.<br />
Although growth benefits are uncertain, costs<br />
in terms of increased economic volatility and<br />
crisis frequency seem more evident. Since 1980,<br />
there have been about 150 episodes of surges<br />
in capital inflows in more than 50 emerging<br />
market economies; as shown in the left panel<br />
of Chart 2, about 20 percent of the time, these<br />
episodes end in a financial crisis, and many of<br />
these crises are associated with large output<br />
declines (Ghosh, Ostry, and Qureshi, 2016).<br />
The pervasiveness of booms and busts gives<br />
credence to the claim by Harvard economist<br />
Dani Rodrik that these “are hardly a sideshow<br />
or a minor blemish in international capital<br />
flows; they are the main story.” While there are<br />
Ostry, corrected 04/11/20106<br />
Chart 1<br />
many drivers, increased capital account openness consistently<br />
figures as a risk factor in these cycles. In addition to raising the<br />
odds of a crash, financial openness has distributional effects,<br />
appreciably raising inequality (see Furceri and Loungani, 2015,<br />
for a discussion of the channels through which this operates).<br />
Moreover, the effects of openness on inequality are much<br />
higher when a crash ensues (Chart 2, right panel).<br />
The mounting evidence on the high cost-to-benefit ratio of<br />
capital account openness, particularly with respect to shortterm<br />
flows, led the IMF’s former First Deputy Managing<br />
Director, Stanley Fischer, now the vice chair of the U.S.<br />
Federal Reserve Board, to exclaim recently: “What useful<br />
purpose is served by short-term international capital flows?”<br />
Among policymakers today, there is increased acceptance<br />
of controls to limit short-term debt flows that are viewed as<br />
likely to lead to—or compound—a financial crisis. While not<br />
the only tool available—exchange rate and financial policies<br />
can also help—capital controls are a viable, and sometimes the<br />
only, option when the source of an unsustainable credit boom<br />
is direct borrowing from abroad (Ostry and others, 2012).<br />
Push to compete<br />
Since the 1980s countries have adopted policies to foster increased domestic<br />
competition through deregulation and opening their economies to foreign capital.<br />
(index of competition)<br />
1.0<br />
0.8<br />
United States<br />
0.6<br />
0.6<br />
0.4<br />
Chile<br />
World<br />
0.4<br />
Brazil<br />
Ostry, revised 05/5/2016<br />
0.2<br />
0.2<br />
India<br />
0.0<br />
1962 72 82 92<br />
0.0<br />
2002 1962 72 82 92 2002<br />
Source: Ostry, Prati, and Spilimbergo (2009).<br />
Note: The chart shows the average values of a composite index of structural policies that countries adopted with the aim of<br />
increasing competition. The areas are openness of capital account; openness of current account; liberalization of agricultural<br />
and network industries; domestic financial liberalization; and reduction in the amount of taxes between wages and take-home<br />
pay. An index value of zero is total lack of competition and 1 is unfettered competition.<br />
Chart 2<br />
1.0<br />
0.8<br />
Spain<br />
Opening up to trouble<br />
Surges of foreign capital inflows increased the chance of a financial crisis, and<br />
such inflows worsen inequality in a crisis.<br />
(increased probability of crisis)<br />
20<br />
16<br />
Full sample<br />
Postsurge period<br />
12<br />
8<br />
4<br />
0<br />
Financial crisis (banking<br />
or currency crisis)<br />
Twin crises (banking<br />
and currency crisis)<br />
(increase in inequality, percent)<br />
4<br />
No crisis<br />
Crisis<br />
3<br />
Year 2 Year 5<br />
Sources: Ghosh, Ostry, and Qureshi (2016), left panel; Furceri and Loungani (2015), right panel.<br />
Note: The left panel shows the increased probability of a crisis during a surge in capital inflows. It is based on 165 episodes<br />
of inflows in 53 emerging market economies between 1980 and 2014. The right panel compares the increase in the Gini<br />
measure of income inequality when capital account liberalization was followed by a crisis with periods when no crisis ensued.<br />
It is based on 224 episodes of capital account liberalization in 149 countries between 1970 and 2010.<br />
2<br />
1<br />
0<br />
Finance & Development June 2016 39
Size of the state<br />
Curbing the size of the state is another aspect of the neoliberal<br />
agenda. Privatization of some government functions<br />
is one way to achieve this. Another is to constrain government<br />
spending through limits on the size of fiscal deficits<br />
and on the ability of governments to accumulate debt. The<br />
economic history of recent decades offers many examples<br />
of such curbs, such as the limit of 60 percent of GDP set<br />
for countries to join the euro area (one of the so-called<br />
Maastricht criteria).<br />
Economic theory provides little guidance on the optimal<br />
public debt target. Some theories justify higher levels<br />
of debt (since taxation is distortionary) and others point<br />
to lower—or even negative—levels (since adverse shocks<br />
call for precautionary saving). In some of its fiscal policy<br />
advice, the IMF has been concerned mainly with the pace at<br />
which governments reduce deficits and debt levels following<br />
the buildup of debt in advanced economies induced by<br />
the global financial crisis: too slow would unnerve markets;<br />
too fast would derail recovery. But the IMF has also argued<br />
for paying down debt ratios in the medium term in a broad<br />
mix of advanced and emerging market countries, mainly as<br />
insurance against future shocks.<br />
But is there really a defensible case for countries like<br />
Germany, the United Kingdom, or the United States to pay<br />
down the public debt? Two arguments are usually made in<br />
support of paying down the debt in countries with ample fiscal<br />
space—that is, in countries where there is little real prospect<br />
of a fiscal crisis. The first is that, although large adverse<br />
shocks such as the Great Depression of the 1930s or the<br />
global financial crisis of the past decade occur rarely, when<br />
they do, it is helpful to have used the quiet times to pay down<br />
the debt. The second argument rests on the notion that high<br />
debt is bad for growth—and, therefore, to lay a firm foundation<br />
for growth, paying down the debt is essential.<br />
It is surely the case that many countries (such as those<br />
in southern Europe) have little choice but to engage in fiscal<br />
consolidation, because markets will not allow them to<br />
continue borrowing. But the need for consolidation in some<br />
countries does not mean all countries—at least in this case,<br />
caution about “one size fits all” seems completely warranted.<br />
Markets generally attach very low probabilities of a debt crisis<br />
to countries that have a strong record of being fiscally<br />
responsible (Mendoza and Ostry, 2007). Such a track record<br />
gives them latitude to decide not to raise taxes or cut productive<br />
spending when the debt level is high (Ostry and<br />
others, 2010; Ghosh and others, 2013). And for countries<br />
with a strong track record, the benefit of debt reduction, in<br />
terms of insurance against a future fiscal crisis, turns out<br />
to be remarkably small, even at very high levels of debt to<br />
GDP. For example, moving from a debt ratio of 120 percent<br />
of GDP to 100 percent of GDP over a few years buys the<br />
country very little in terms of reduced crisis risk (Baldacci<br />
and others, 2011).<br />
But even if the insurance benefit is small, it may still be<br />
worth incurring if the cost is sufficiently low. It turns out,<br />
however, that the cost could be large—much larger than the<br />
benefit. The reason is that, to get to a lower debt level, taxes<br />
that distort economic behavior need to be raised temporarily<br />
or productive spending needs to be cut—or both. The<br />
costs of the tax increases or expenditure cuts required to<br />
bring down the debt may be much larger than the reduced<br />
crisis risk engendered by the lower debt (Ostry, Ghosh, and<br />
Espinoza, 2015). This is not to deny that high debt is bad for<br />
growth and welfare. It is. But the key point is that the welfare<br />
Governments with ample fiscal<br />
space will do better by living with<br />
the debt.<br />
cost from the higher debt (the so-called burden of the debt)<br />
is one that has already been incurred and cannot be recovered;<br />
it is a sunk cost. Faced with a choice between living with<br />
the higher debt—allowing the debt ratio to decline organically<br />
through growth—or deliberately running budgetary<br />
surpluses to reduce the debt, governments with ample fiscal<br />
space will do better by living with the debt.<br />
Austerity policies not only generate substantial welfare costs<br />
due to supply-side channels, they also hurt demand—and thus<br />
worsen employment and unemployment. The notion that fiscal<br />
consolidations can be expansionary (that is, raise output and<br />
employment), in part by raising private sector confidence and<br />
investment, has been championed by, among others, Harvard<br />
economist Alberto Alesina in the academic world and by former<br />
European Central Bank President Jean-Claude Trichet in<br />
the policy arena. However, in practice, episodes of fiscal consolidation<br />
have been followed, on average, by drops rather than by<br />
expansions in output. On average, a consolidation of 1 percent<br />
of GDP increases the long-term unemployment rate by 0.6 percentage<br />
point and raises by 1.5 percent within five years the Gini<br />
measure of income inequality (Ball and others, 2013).<br />
In sum, the benefits of some policies that are an important<br />
part of the neoliberal agenda appear to have been somewhat<br />
overplayed. In the case of financial openness, some capital<br />
flows, such as foreign direct investment, do appear to confer<br />
the benefits claimed for them. But for others, particularly<br />
short-term capital flows, the benefits to growth are difficult<br />
to reap, whereas the risks, in terms of greater volatility and<br />
increased risk of crisis, loom large.<br />
In the case of fiscal consolidation, the short-run costs<br />
in terms of lower output and welfare and higher unemployment<br />
have been underplayed, and the desirability for<br />
countries with ample fiscal space of simply living with high<br />
debt and allowing debt ratios to decline organically through<br />
growth is underappreciated.<br />
An adverse loop<br />
Moreover, since both openness and austerity are associated<br />
with increasing income inequality, this distributional<br />
effect sets up an adverse feedback loop. The increase in<br />
40 Finance & Development June 2016
inequality engendered by financial openness and austerity<br />
might itself undercut growth, the very thing that the neoliberal<br />
agenda is intent on boosting. There is now strong<br />
evidence that inequality can significantly lower both the<br />
level and the durability of growth (Ostry, Berg, and Tsangarides,<br />
2014).<br />
The evidence of the economic damage from inequality<br />
suggests that policymakers should be more open to redistribution<br />
than they are. Of course, apart from redistribution,<br />
policies could be designed to mitigate some of the impacts<br />
in advance—for instance, through increased spending on<br />
education and training, which expands equality of opportunity<br />
(so-called predistribution policies). And fiscal consolidation<br />
strategies—when they are needed—could be<br />
designed to minimize the adverse impact on low-income<br />
groups. But in some cases, the untoward distributional<br />
consequences will have to be remedied after they occur<br />
by using taxes and government spending to redistribute<br />
income. Fortunately, the fear that such policies will themselves<br />
necessarily hurt growth is unfounded (Ostry, 2014).<br />
Finding the balance<br />
These findings suggest a need for a more nuanced view of<br />
what the neoliberal agenda is likely to be able to achieve. The<br />
IMF, which oversees the international monetary system, has<br />
been at the forefront of this reconsideration.<br />
For example, its former chief economist, Olivier Blanchard,<br />
said in 2010 that “what is needed in many advanced economies<br />
is a credible medium-term fiscal consolidation, not a<br />
fiscal noose today.” Three years later, IMF Managing Director<br />
Christine Lagarde said the institution believed that the<br />
U.S. Congress was right to raise the country’s debt ceiling<br />
“because the point is not to contract the economy by slashing<br />
spending brutally now as recovery is picking up.” And in<br />
2015 the IMF advised that countries in the euro area “with<br />
fiscal space should use it to support investment.”<br />
On capital account liberalization, the IMF’s view has also<br />
changed—from one that considered capital controls as almost<br />
always counterproductive to greater acceptance of controls<br />
to deal with the volatility of capital flows. The IMF also recognizes<br />
that full capital flow liberalization is not always an<br />
appropriate end-goal, and that further liberalization is more<br />
beneficial and less risky if countries have reached certain<br />
thresholds of financial and institutional development.<br />
Chile’s pioneering experience with neoliberalism received<br />
high praise from Nobel laureate Friedman, but many economists<br />
have now come around to the more nuanced view<br />
expressed by Columbia University professor Joseph Stiglitz<br />
(himself a Nobel laureate) that Chile “is an example of a<br />
success of combining markets with appropriate regulation”<br />
(2002). Stiglitz noted that in the early years of its move to<br />
neoliberalism, Chile imposed “controls on the inflows of<br />
capital, so they wouldn’t be inundated,” as, for example,<br />
the first Asian-crisis country, Thailand, was a decade and<br />
a half later. Chile’s experience (the country now eschews<br />
capital controls), and that of other countries, suggests that<br />
no fixed agenda delivers good outcomes for all countries for<br />
all times. Policymakers, and institutions like the IMF that<br />
advise them, must be guided not by faith, but by evidence of<br />
what has worked. ■<br />
Jonathan D. Ostry is a Deputy Director, Prakash Loungani is a<br />
Division Chief, and Davide Furceri is an Economist, all in the<br />
IMF’s Research Department.<br />
References:<br />
Baldacci, Emanuele, Iva Petrova, Nazim Belhocine, Gabriela Dobrescu,<br />
and Samah Mazraani, 2011, “Assessing Fiscal Stress,” IMF Working Paper<br />
11/100 (Washington: International Monetary Fund).<br />
Ball, Laurence, Davide Furceri, Daniel Leigh, and Prakash Loungani,<br />
2013, “The Distributional Effects of Fiscal Austerity,” UN-DESA Working<br />
Paper 129 (New York: United Nations).<br />
Dell’Ariccia, Giovanni, Julian di Giovanni, André Faria, M. Ayhan<br />
Kose, Paolo Mauro, Jonathan D. Ostry, Martin Schindler, and Marco<br />
Terrones, 2008, Reaping the Benefits of Financial Globalization, IMF<br />
Occasional Paper 264 (Washington: International Monetary Fund).<br />
Furceri, Davide, and Prakash Loungani, 2015, “Capital Account<br />
Liberalization and Inequality,” IMF Working Paper 15/243 (Washington:<br />
International Monetary Fund).<br />
Ghosh, Atish R., Jun I. Kim, Enrique G. Mendoza, Jonathan D. Ostry,<br />
and Mahvash S. Qureshi, 2013, “Fiscal Fatigue, Fiscal Space and Debt<br />
Sustainability in Advanced Economies,” Economic Journal, Vol. 123, No.<br />
566, pp. F4–F30.<br />
Ghosh, Atish R., Jonathan D. Ostry, and Mahvash S. Qureshi, 2016,<br />
“When Do Capital Inflow Surges End in Tears?” American Economic<br />
Review, Vol. 106, No. 5.<br />
Mendoza, Enrique G., and Jonathan D. Ostry, 2007, “International<br />
Evidence on Fiscal Solvency: Is Fiscal Policy ‘Responsible’?” Journal of<br />
Monetary Economics, Vol. 55, No. 6, pp. 1081–93.<br />
Obstfeld, Maurice, 1998, “The Global Capital Market: Benefactor or<br />
Menace?” Journal of Economic Perspectives, Vol. 12, No. 4, pp. 9–30.<br />
Ostry, Jonathan D., 2014, “We Do Not Have to Live with the Scourge of<br />
Inequality,” Financial Times, March 3.<br />
———, Andrew Berg, and Charalambos Tsangarides, 2014,<br />
“Redistribution, Inequality, and Growth,” IMF Staff Discussion Note 14/02<br />
(Washington: International Monetary Fund).<br />
Ostry, Jonathan D., Atish R. Ghosh, Marcos Chamon, and Mahvash S.<br />
Qureshi, 2012, “Tools for Managing Financial-Stability Risks from Capital<br />
Inflows,” Journal of International Economics, Vol. 88, No. 2, pp. 407–21.<br />
Ostry, Jonathan D., Atish R. Ghosh, Jun I. Kim, and Mahvash Qureshi,<br />
2010, “Fiscal Space,” IMF Staff Position Note 10/11 (Washington:<br />
International Monetary Fund).<br />
Ostry, Jonathan D., Atish R. Ghosh, and Raphael Espinoza, 2015,<br />
“When Should Public Debt Be Reduced?” IMF Staff Discussion Note 15/10<br />
(Washington: International Monetary Fund).<br />
Ostry, Jonathan D., Alessandro Prati, and Antonio Spilimbergo,<br />
2009, Structural Reforms and Economic Performance in Advanced<br />
and Developing Countries, IMF Occasional Paper 268 (Washington:<br />
International Monetary Fund).<br />
Rodrik, Dani, 1998, “Who Needs Capital-Account Convertibility?”<br />
in Should the IMF Pursue Capital-Account Convertibility? Essays in<br />
International Finance 207 (Princeton, New Jersey: Princeton University).<br />
Stiglitz, Joseph, 2002, “The Chilean Miracle: Combining Markets with<br />
Appropriate Reform,” Commanding Heights interview.<br />
Finance & Development June 2016 41
CURRENCY NOTES<br />
The Future<br />
Is Plastic<br />
For countries concerned about the environmental impact<br />
of their currency, a switch to polymer notes makes sense<br />
Ping Wang<br />
AS countries sign on to the Paris Agreement on climate<br />
change and strive to become more sustainable,<br />
many are considering the environmental<br />
impact of their currency as well as its durability<br />
and security.<br />
Money has been made from a variety of materials over<br />
the years—from leather in China during the Han Dynasty,<br />
to shells, precious metals, cotton paper, and most recently,<br />
plastic. The materials reflect the social and political climate<br />
of the time as well as available technologies and resources.<br />
For centuries, people in China used precious metal coins<br />
strung together through a center hole to conduct transactions.<br />
But with larger commercial transactions in the 7th<br />
century, there was a move to the easier-to-transport paper<br />
currency. In the 13th century Marco Polo reported back to<br />
Europe from his travels on the use of paper rather than coins,<br />
and Europe’s earliest modern paper banknotes were issued by<br />
the Bank of Stockholm in 1661.<br />
The design for the new Australian $5 polymer note, due out in September<br />
2016, the first of a new series. Australia was the first country to issue<br />
polymer currency.<br />
Vanuatu's 2,000 vatu polymer note; also in circulation are VT 10,000,<br />
VT 1,000, and VT 200, with VT 5,000 and VT 500 yet to be issued.<br />
Paper quickly became the currency of choice around the<br />
world and remained so for centuries. But with recent technological<br />
developments, plastic film notes offer additional<br />
security features along with longevity and energy efficiency.<br />
Move to plastic<br />
Polymer banknotes were first issued in 1988 by Australia,<br />
which now uses polymer exclusively and is about to launch<br />
a new series of notes, starting with the $5 bill in September.<br />
Polymer is now used in over 20 countries as diverse as Australia,<br />
Canada, Fiji, Mauritius, New Zealand, Papua New Guinea,<br />
Romania, and Vietnam.<br />
The Bank of Canada began its move to polymer banknotes<br />
in 2011, after assessing the environmental impact of producing<br />
paper and plastic bills. A life-cycle assessment examined<br />
the effect—including primary energy demands and the<br />
potential for global warming—of each stage of production,<br />
from growing the cotton to produce the banknote paper or<br />
producing the raw material for polymer notes through the<br />
destruction and disposal of worn notes.<br />
42 Finance & Development June 2016
Anriano, 4/15/16<br />
At the end of their life, paper bills are usually<br />
shredded and relegated to a landfill. But polymer<br />
notes taken out of circulation are shredded, converted<br />
into pellets, and used to make everyday<br />
plastic items such as lawn furniture.<br />
The Bank of England spent three years studying<br />
the potential effect of a switch from cotton<br />
and linen paper notes and concluded as well that<br />
plastic was the way to go. A polymer £5 note<br />
featuring Sir Winston Churchill will launch in<br />
September 2016, followed by a £10 Jane Austen<br />
note in late 2017 and a £20 note by 2020.<br />
On announcement of the U.K. move, Bank<br />
of England Governor Mark Carney said, “The<br />
quality of polymer notes is higher, they are<br />
more secure from counterfeiting, and they can<br />
be produced at lower cost to the taxpayer and<br />
the environment.”<br />
Canadian polymer bills: Canada released the $100 note in November 2011, the $50 in March<br />
2012, the $20 in November 2012, and the $10 and $5 bills in November 2013.<br />
In all categories and phases, polymer outperformed<br />
paper. For example, the study found, a polymer bill promises<br />
a 32 percent reduction in global warming potential<br />
and 30 percent reduction in primary energy demand compared<br />
with paper. Most important, polymer notes last more<br />
than twice as long as paper notes—and higher denominations,<br />
which are handled less frequently, last even longer.<br />
This means fewer polymer notes have to be manufactured<br />
and distributed over the life of a series. And polymer notes<br />
weigh less than paper ones, so even their transportation and<br />
distribution are easier on the environment.<br />
Mixed reactions<br />
Ordinary users have mixed reactions to the bills’<br />
plasticky feel. Zoë Martin, a tutor in Toronto,<br />
Canada, says, “They stick to each other because<br />
of static cling, they don’t fold up nicely like paper<br />
bills when they’re new, and they’re slippery<br />
so they slide out of your pocket.” But Michael<br />
Brienza, a Toronto day care teacher, says, “I prefer<br />
them; they’re so much cleaner. The paper bills got<br />
all grimy.” And Peter Cecil Sinnott, a data science<br />
graduate of Montreal’s McGill University, says, “The fact that<br />
they’re waterproof means getting them wet isn’t going to cost<br />
you. True story: my sister once found one of the new Canadian<br />
$100 bills while snorkeling in the tropics. Who knows<br />
how long it was sitting on that reef?”<br />
To paraphrase Mr. McGuire’s advice to Benjamin in the<br />
movie The Graduate, whether people like it or not, “the<br />
future is plastic.” ■<br />
Ping Wang is a Communications Officer in the IMF’s<br />
Communications Department.<br />
Environmentally costly<br />
The life cycle—production,<br />
transportation, and eventual<br />
disposal—of the 3 billion<br />
paper euro banknotes<br />
produced in 2003 alone<br />
has the environmental effect<br />
of driving a car around the<br />
globe 9,235 times<br />
Environmental impact of<br />
3 billion paper euro banknotes<br />
=<br />
Environmental impact of driving<br />
around the earth 9,235 times<br />
Finance & Development June 2016 43
The Internet<br />
Attendee enters Inside Bitcoins<br />
conference, New York City,<br />
United States.<br />
of Trust<br />
Andreas Adriano and Hunter Monroe<br />
Created to<br />
avoid banks,<br />
bitcoin’s<br />
blockchain<br />
technology<br />
may end up<br />
helping them<br />
THE greatest thing about cash is the<br />
simplicity of transactions. You just<br />
hand it over and receive something.<br />
Nobody asks your name, address,<br />
phone number, date of birth, social security<br />
number, salary, how long you’ve been in your<br />
current job … Cash produces instant trust<br />
between buyer and seller.<br />
Because it’s impractical to move large<br />
amounts of hard cash around, paper-based<br />
and later electronic payment systems were<br />
created. However, establishing this trust without<br />
cash is complex and expensive. Acquiring<br />
a credit or debit card requires the applicant to<br />
answer numerous questions—and the issuing<br />
bank to verify the answers and the applicant’s<br />
credit. Using the card demands a complex<br />
infrastructure to ensure that transactions are<br />
fast, reliable, and safe—and costs the merchant<br />
a percentage of each sale.<br />
Domestic transfers between banks depend<br />
on payment systems operated by central banks,<br />
while international transfers may involve<br />
other commercial banks between the sender’s<br />
and the receiver’s banks. Furthermore, these<br />
transactions can take several days. As another<br />
example, although we associate modern stock<br />
markets with nearly instantaneous electronic<br />
trades, settling transactions can take two to<br />
three days and requires additional players,<br />
including custodians, notaries, clearinghouses,<br />
and central securities depositories. Until the<br />
transactions have settled, financial institutions<br />
must set aside significant amounts of cash or<br />
other liquid assets to cover their positions if<br />
someone along the line does not pay.<br />
Simpler and cheaper<br />
Could technology make things simpler and<br />
cheaper again? Enter bitcoin, the digital currency<br />
that some claim will spell the end of<br />
banks but others view as a Ponzi scheme and<br />
a financial vehicle for criminals. Bitcoin—or<br />
more precisely, the underlying technology<br />
that allows it to function, called distributed<br />
ledgers, or blockchain—could allow what<br />
many see as radical rewiring of the financial<br />
sector (see Box 1).<br />
Bitcoin’s story is well known: it started<br />
when Satoshi Nakamoto—the name used<br />
by the inventor, whose actual identity is still<br />
uncertain—posted a paper and software on<br />
44 Finance & Development June 2016
an email discussion list of activists who believed that<br />
cryptography could bring about social and political<br />
change (“cypherpunks”). Others became interested<br />
and soon started to develop the idea online.<br />
Bitcoin started trading in 2009, with an exchange<br />
rate against the U.S. dollar of $0.0007 per bitcoin.<br />
In February 2011, it reached parity with the dollar.<br />
In November 2013, the value of bitcoin peaked at<br />
$1,242, and it has been trading above $400 for most<br />
of 2016. The value of bitcoin in circulation is about<br />
$6 billion (compared with about 1.5 trillion U.S. dollars<br />
in circulation worldwide).<br />
In the beginning, bitcoin grabbed the imagination<br />
of libertarians who wanted to get rid of, or at least<br />
have an alternative to, banks and central banks. While<br />
the exchange rate surge triggered something of a gold<br />
rush, bitcoin’s relative anonymity and ease of trading<br />
attracted drug dealers and other criminals, leading to<br />
a heavy law enforcement crackdown during 2013 and<br />
2014 that landed some early entrepreneurs in jail and<br />
gave the whole initiative a bad reputation.<br />
Tech entrepreneurs and the financial industry<br />
soon realized that the real news was under the<br />
hood—bitcoin’s underlying distributed ledger technology.<br />
Essentially, this is a technology for verifying<br />
and recording transactions on a peer-to-peer basis<br />
without a central authority. It upends a very basic<br />
tenet of payment systems: having one central, independent,<br />
and trusted bookkeeper that stores and<br />
validates all transactions—a role often played by<br />
central banks (see Centralized chart). payment systems<br />
With bitcoin, everyone on the Internet can validate<br />
and record transactions in their own copy of the<br />
Anriano, 4/15/16<br />
ledger. They group the transactions during a given<br />
period into a block, which is followed by a tamperproof<br />
stamp. Each transaction block links to a block<br />
for the previous period—hence the term “blockchain.”<br />
Completing the block for a period requires<br />
Box 1<br />
You got money<br />
Several start-ups are already delivering small payments and remittance<br />
services at low cost using bitcoin as a payment system, not a currency.<br />
Rather than charging 8 percent to send remittances, the start-up Circle<br />
Internet Financial, for example, performs the service free. Its sleek mobile<br />
app incorporates social media features like sending pictures and emojis<br />
together with a payment notification—appealing to a younger demographic<br />
accustomed to expressing itself in smileys.<br />
Users link their profile to a bank account or card on each end of the<br />
transaction and simply “text” money to each other anywhere in the world.<br />
Transactions are conducted via bitcoin, but the user doesn’t need to know<br />
how it happens. If the receiver is not in the bitcoin system, the money can<br />
still be retrieved with other “digital wallets” (apps that allow the storage of<br />
bitcoin or other currency on a smartphone) or at the counters of remittance<br />
companies for a small fee, provided they also deal in bitcoin.<br />
“It’s like with sending an email,” says the Circle CEO, Jeremy Allaire.<br />
“You don’t care about how the message is routed through the Web.”<br />
He explains how his Filipino nanny in California used to spend about<br />
$50 for each remittance home and now pays $0.75, and that much only<br />
because her family at the other end of the transaction doesn’t use Circle.<br />
Because transactions happen very quickly, bitcoin’s well-known volatility<br />
is not really an issue.<br />
Circle combines the digital appeal with some good old “real” features. It<br />
is registered as a money service business, which allows it to provide many<br />
banking services, except lending and investing clients’ money, and enjoys<br />
deposit protection from the U.S. government. It recently became licensed<br />
in the United Kingdom and formed a partnership with Barclays Bank.<br />
Like many start-up honchos in the Internet’s early days, Allaire, whose<br />
coffers are well funded by venture capitalists, is not concerned with<br />
short-term profitability. “Our business is entering a market that generates<br />
trillions of dollars of revenue a year for retail banks. There’s absolutely<br />
huge amounts of market share to be disrupted or to be accessed<br />
with digital banking products,” he says. Didn’t many companies fail in<br />
the early 2000s by focusing too much on acquiring customers and too<br />
little on monetizing them? “The most significant Internet companies,<br />
they all started by focusing relentlessly on providing a free consumer<br />
utility that really delivered a lot of value for consumers. And they did it<br />
for several years until it got to a meaningful scale,” he adds.<br />
Spreading the burden<br />
In traditional banking, the central bank tracks payments between clients; in blockchain banking, transactions are recorded on<br />
multiple network computers and settled by many individuals.<br />
Centralized payment system<br />
Blockchain (distributed ledger) system<br />
Ledger<br />
Ledger<br />
Bank<br />
Bank<br />
Ledger Ledger Ledger Ledger<br />
Bank<br />
Central Bank<br />
Bank<br />
Ledger<br />
Ledger<br />
Finance & Development June 2016 45
some computational work, with a reward in bitcoin—so the<br />
people competing to complete blocks are called “miners.” Thus<br />
bitcoin, by combining a peer-to-peer approach with cryptographic<br />
security, became the first successful digital currency,<br />
after several decades of failures.<br />
So how big a deal is that? U.S. entrepreneur Marc<br />
Andreessen explained it this way: “Bitcoin gives us, for the<br />
first time, a way for one Internet user to transfer a unique<br />
piece of digital property to another Internet user, such that<br />
the transfer is guaranteed to be safe and secure, everyone<br />
knows that the transfer has taken place, and nobody can<br />
challenge the legitimacy of the transfer. The consequences<br />
of this breakthrough are hard to overstate,” he said in a New<br />
York Times article in January 2014.<br />
Andreessen was an Internet pioneer, who while still in<br />
college in 1993 founded Netscape, the first widely used Web<br />
browser. He now runs Andreessen Horowitz, one of Silicon<br />
Valley’s most influential venture capital funds. Venture capitalists<br />
make money by finding the next big thing before it’s<br />
even a thing. Andreessen and many other venture capitalists<br />
who funded the creators of the Internet as we know it<br />
are now betting on bitcoin and the underlying blockchain<br />
technology. They see this technology as a breakthrough that<br />
can establish, between unknown and physically separated<br />
participants, the same trust as a cash transaction. Some<br />
predict that this capability to disintermediate any trusted<br />
third party will be the most disruptive technology since<br />
the Internet. The (overused) word “disruptive” refers to<br />
new technologies that shake up, or even destroy, traditional<br />
business models. Think Amazon and bookstores, or Uber<br />
and taxis. Disrupting the financial industry, the most regulated<br />
business in the world, is a whole different game. It is<br />
possible and even desirable, as the Financial Times’ Martin<br />
Wolf wrote recently, given the industry’s many shortcomings,<br />
but very complicated in all aspects: legal, fiscal, financial,<br />
and operational.<br />
Box 2<br />
Bitcoin FAQs<br />
Q: Is bitcoin the only digital currency?<br />
A: No, there are over 700 so-called cryptocurrencies out there.<br />
Bitcoin is the best known, with the highest market value,<br />
liquidity, and acceptance. Ethereum is a distant second.<br />
Q: Are cryptocurrencies safe?<br />
A: Episodes of hacking, stealing of bitcoin, and even bankruptcy<br />
of exchanges and wallet providers have occurred, but<br />
less frequently over time.<br />
Q: How volatile are they?<br />
A: Cryptocurrencies can be very volatile. Bitcoin has hovered<br />
just above $400 during 2016; it was trading below $300 in May<br />
2015, but was above $1,200 in 2013.<br />
Q: If it’s so volatile, is it a good investment?<br />
A: It is a very speculative investment. And it’s not guaranteed<br />
by a central bank or backed by a government. Investors are<br />
totally on their own.<br />
Q: Is it a good payment system?<br />
A: It’s cheaper than many conventional options for remittances<br />
Traditionally, the financial industry has tried to solve the<br />
problem of creating trust by acting as a trusted intermediary<br />
between individuals and companies who do not know<br />
each other, with central banks and regulators backing up<br />
this trust by supervising banks and through deposit insurance.<br />
Individuals and companies pay banks to conduct their<br />
transactions, for example through credit cards and wire<br />
transfers, because other banks and the central bank recognize<br />
each other as trustworthy counterparts. It’s great business<br />
for them: according to a McKinsey&Company report,<br />
banks extract an astonishing $1.7 trillion a year, 40 percent<br />
of their revenue, from global payment services. Even more<br />
surprising, despite all technological innovation, the cost<br />
of financial intermediation in the United States has not<br />
changed significantly since the beginning of the 20th century,<br />
according to research cited by the Bank of England’s<br />
chief economist, Andrew Haldane, in a recent speech. In a<br />
2012 report, the European Central Bank (ECB) estimated<br />
that, aside from the fees everybody pays, the indirect costs<br />
are as high as 1 percent of GDP, which in the European<br />
Union alone translates to about €130 billion a year. And<br />
the cost of sending remittances to another country is even<br />
higher—nearly 8 percent according to the World Bank.<br />
However, a number of start-ups, many using bitcoin, make<br />
sending payments as simple and inexpensive as sending an<br />
email (see Box 2).<br />
Transforming the financial sector<br />
According to its proponents, bitcoin’s blockchain technology<br />
can be used to transform the financial sector fundamentally,<br />
for example by reducing the settlement time for securities<br />
transactions. With faster settlement, less money needs to be<br />
set aside to cover credit and settlement risks—just as collateral<br />
is not needed for a cash transaction.<br />
The list of potential uses is even longer. Think property<br />
titles, for example—home buyers in the United States usu-<br />
or money transfers and can be very convenient for instance<br />
for smartphone payments. To the extent that transactions are<br />
settled quickly, volatility is less of a problem.<br />
Q: How can I buy bitcoin or other cryptocurrency?<br />
A: There are many exchanges that sell and buy bitcoin, such as<br />
Coinbase, Localbitcoins, and CoinDesk. There are also a growing<br />
number of physical automated teller machines, or ATMs,<br />
that will convert hard currency into bitcoin.<br />
Q: How do I store them?<br />
A: The most practical way is to download a digital wallet to<br />
a smartphone. As with a real wallet, these are good for small<br />
purchases. Storing large amounts is more complex. Some users<br />
have a dedicated offline computer (one not connected to the<br />
Internet all the time) and use encryption and very strong passwords<br />
to protect their funds.<br />
Q: Where can I use them?<br />
A: Acceptance is still limited but is increasing. A few online<br />
retailers accept bitcoin, as do some brick-and-mortar stores.<br />
46 Finance & Development June 2016
“There’s nothing in the current<br />
technologies preventing instant<br />
settlement.”<br />
ally buy insurance to protect against liability originating from<br />
an unexpected claim on the property they are buying—or<br />
the process for buying, registering, and paying taxes for a<br />
car. A blockchain could provide digital, unforgeable proof<br />
of ownership along with a complete record of the chain of<br />
possession. There is also substantial excitement about smart,<br />
self-executing contracts—for instance, travel insurance that<br />
pays automatically if a flight is cancelled, or a car loan that<br />
disables the ignition if payments are missed. Blockchain technology<br />
also powers an alternative to bitcoin called Ethereum<br />
(with a currency worth about $800 million), which has lately<br />
been attracting some mainstream attention. Unlike bitcoin,its<br />
paternity is known: Vitalik Buterin, a 22-year-old Russian-<br />
Canadian college dropout.<br />
Jerry Cuomo, IBM’s vice president for blockchain technologies,<br />
also sees potential applications of purpose-built private<br />
blockchains to improve transparency through compliance and<br />
auditing, in sharp contrast to bitcoin’s reputation as secretive<br />
and anonymous. “Bitcoin decided to be anonymous by design,”<br />
he says. However, “it’s perfectly possible to have a blockchain<br />
with different levels of access, in which participants don’t see<br />
what others are doing, but auditors and regulators come in at a<br />
higher level and see everything,” he explains.<br />
Although much of the experimentation with blockchain<br />
technology is occurring in the start-up world, IBM is one of<br />
a number of big businesses dipping a toe into this water. Last<br />
December, it joined the Linux Foundation to disseminate<br />
blockchain technology with open source software (meaning<br />
any programmer can work on it, as opposed to proprietary<br />
systems like Windows). Large banks such as JPMorgan<br />
Chase & Co. and technology companies like Cisco and Intel<br />
are collaborating on the initiative. In February, the Tokyo<br />
Stock Exchange joined IBM to test blockchain use in recording<br />
trades in low-transaction markets, and the Australian<br />
Stock Exchange has asked Digital Asset Holdings, a start-up,<br />
to develop distributed ledger technology for clearing and<br />
settlement. A consortium of 42 global banks is working with<br />
a new company called R3 to develop distributed ledger standardized<br />
technologies for the financial industry.<br />
Setting standards will be crucial here. It is typical of a new<br />
innovation cycle that different companies come up with<br />
different ways to do something, leading to a patchwork of<br />
technological approaches. Some worry that this could undo<br />
years of effort to integrate the financial industry globally. For<br />
example, under the Single Euro Payments Area (SEPA) initiative,<br />
it took European authorities 12 years from the launch<br />
of euro notes and coins in 2002 to integrate technological<br />
platforms and business procedures to make cross-border<br />
payments among the 35 participating countries as simple and<br />
inexpensive as a domestic transfer.<br />
As the ECB’s director general of market infrastructure and<br />
payments, Marc Bayle oversees SEPA and other continental<br />
integration initiatives, such as TARGET2, the euro area cash<br />
payment settlement system, and T2S, its equivalent for securities.<br />
He follows blockchain developments with interest, but<br />
is not impressed by some of the promises, like shorter settlement<br />
times. “There’s nothing in the current technologies<br />
preventing instant settlement. The problem is the structure<br />
of markets. If a fund manager in Miami wants to invest in<br />
Frankfurt, there will be many legal, operational, tax, and<br />
financial considerations to be taken into account, and they<br />
might prefer to work with intermediaries providing such<br />
expertise in a cross-border context between the United States<br />
and the EU/Germany,” Bayle says.<br />
Useful in central banks?<br />
He does not rule out the possibility that blockchain or similar<br />
distributed ledger technologies might evolve to become useful<br />
in central banks, despite their current limitations and the conceptual<br />
tension between distributed and central ledgers. While<br />
the use of blockchain to replace the ECB’s main settlement<br />
systems is not really envisioned now, it is being considered in<br />
certain niches to foster secondary markets for more exotic securities.<br />
“We have to see whether this technology can be useful<br />
for us, if it can help lowering costs and having more resilient<br />
systems. But also, we have to think how it affects financial intermediation,<br />
the role of banks and other market participants,<br />
as well as our capacity as regulators,” Bayle adds. Some are asking<br />
whether bitcoin and other blockchain applications could<br />
eventually undermine monetary policy and financial stability—but<br />
the consensus is that there is no immediate risk.<br />
It is probably too early to say whether blockchain is “the<br />
next Internet” or just an incremental evolution. Silicon Valley<br />
is paved with overhyped ideas that later proved unviable<br />
and with revolutionary companies that disappeared in a few<br />
years, but still in some cases had some impact. Andreessen’s<br />
Netscape Web browser was acquired by AOL in 1999 for over<br />
$4 billion. AOL itself, today a ghost of its lavish previous self,<br />
was acquired for about the same amount in 2015 by Verizon.<br />
It’s not impossible to think that bitcoin or other blockchain<br />
technology could implode because of a still unknown design<br />
flaw or the work of a, well, disruptive hacker.<br />
The blockchain game is only beginning. As Bill Gates once<br />
put it: “We always overestimate the change that will occur in<br />
the next two years and underestimate the change that will<br />
occur in the next ten.” ■<br />
Andreas Adriano is a Senior Communications Officer in the<br />
IMF’s Communications Department, and Hunter Monroe<br />
is a Senior Economist in the IMF’s Monetary and Capital<br />
Markets Department.<br />
Finance & Development June 2016 47
GUILT<br />
by Association<br />
Atish Rex Ghosh and Mahvash Saeed Qureshi<br />
“I have only eight seconds left to talk about capital controls. But that’s OK. I don’t need more<br />
time than that to tell you: they don’t work, I wouldn’t use them, I wouldn’t recommend them . . . ”<br />
—Governor Agustín Carstens, Bank of Mexico<br />
<br />
(Remarks made at Rethinking Macro Policy III<br />
Conference, Washington D.C., April 15, 2015)<br />
Prejudices sway<br />
the debate<br />
on using capital<br />
controls to<br />
tame the risks<br />
of fickle inflows<br />
CAPITAL controls have a bad name.<br />
While their usefulness as a policy<br />
tool to manage the risks associated<br />
with capital inflows is increasingly<br />
acknowledged (IMF, 2012), as the quote above<br />
amply demonstrates, they are still viewed with<br />
considerable suspicion and misgiving.<br />
An oft-heard argument against capital<br />
controls is that they can be evaded and<br />
circumvented. Yet no one makes that case<br />
when it comes to other policies—for example,<br />
that taxes should be abolished because they<br />
are subject to evasion. Likewise, even though<br />
macroprudential measures have been much<br />
in vogue since the global financial crisis,<br />
evidence of their effectiveness is no more<br />
compelling than it is for capital controls.<br />
Moreover, even when countries do impose<br />
controls on capital inflows, it is telling that<br />
they usually refer to them with euphemisms<br />
such as “prudential measures.”<br />
Resentment toward outflow controls<br />
is understandable: residents may want to<br />
invest or safeguard their money abroad, and<br />
nonresidents want to be able to repatriate<br />
their funds on liquidation of their investments.<br />
More puzzling is the almost visceral<br />
opposition to emerging market economies’<br />
use of controls to manage capital inflows—<br />
especially since such measures were integral<br />
to advanced economies’ management of<br />
speculative (“hot money”) flows when they<br />
pursued their own financial liberalization in<br />
the latter half of the 20th century.<br />
So whence this bad name for inflow controls?<br />
The story begins<br />
Capital controls have a long history, with<br />
evidence of their use stretching back to<br />
ancient times. Even during the late 19th<br />
century—the so-called golden era of financial<br />
globalization—the leading capital exporters<br />
of the day (Britain, France, and Germany) at<br />
times restricted foreign lending, albeit mainly<br />
for political rather than for economic reasons.<br />
Boom-bust cycles in cross-border capital<br />
flows were already evident, but there were few<br />
restrictions on capital imports—and mostly<br />
for strategic purposes or out of concern about<br />
“foreign domination.” Much of the capital was<br />
long term, financing productive investments<br />
in infrastructure and utilities in the emerging<br />
market economies of the day.<br />
Capital flows, especially from Europe,<br />
came to an abrupt halt during World War<br />
I, and the cessation of hostilities revealed<br />
deep differences among nations. At one<br />
extreme was the Soviet Union, which under<br />
an authoritarian and state socialist model<br />
had imposed tight controls on capital<br />
movement by 1919. At the other extreme<br />
were the private and central bankers of the<br />
leading economies of the day, seeking to<br />
reestablish the previous liberal—and for<br />
48 Finance & Development June 2016
the great banking houses, highly profitable—international<br />
monetary order.<br />
Wartime dislocation and deficit financing of reparations<br />
and reconstruction costs delayed the removal of restrictions<br />
in Europe, but starting with the 1924 Dawes Plan—<br />
under which American banks made loans to Germany to<br />
help that country pay for reparations—U.S. banks entered<br />
a period of massive international lending ($1 billion a year<br />
during 1924–29). Half of that was destined for Europe,<br />
partly intermediated by British banks, and it spurred a huge<br />
economic and financial boom.<br />
But this resurrection of the liberal international order<br />
did not last long. When a speculative frenzy in the New<br />
York stock market drew capital to the United States, Europe<br />
suffered a sudden stop. In July 1931, unable to roll over<br />
maturing obligations, Germany declared a moratorium on<br />
foreign payments and imposed exchange restrictions, which<br />
triggered a run on the pound that forced Britain off the gold<br />
standard; numerous other countries followed suit.<br />
What ensued was a decade of almost dizzying capital flight,<br />
devaluations, exchange restrictions, and capital controls<br />
(nearly all on outflows), protectionism, and imploding global<br />
trade—contributing to the global Great Depression. Notably,<br />
however, it was mostly the autocratic and authoritarian<br />
regimes in Europe—such as Austria, Bulgaria, Germany,<br />
Hungary, Portugal, and Romania—that imposed exchange<br />
restrictions and outflow controls (democracies preferred<br />
tariffs). In Germany, the July 1931 restrictions were extended<br />
and broadened by the Nazis, under whom violations were<br />
potentially punishable by death; exchange controls thus<br />
became thoroughly associated with the excesses of that regime.<br />
By 1935, as the U.S. economy began to emerge from the<br />
Great Depression, and against a backdrop of worrisome<br />
political developments in Europe, capital began surging<br />
to the United States. The resulting speculative boom and<br />
swelling of U.S. banks’ excess reserves (which threatened to<br />
precipitate an inflationary spiral) prompted Federal Reserve<br />
Chairman Marriner Eccles to argue that there was “a clear<br />
case for adopting measures to deter the growth of foreign<br />
capital in our markets.”<br />
Yet the United States did not impose inflow controls.<br />
Extrapolating from the experience of European countries<br />
trying to prevent capital outflows, American officials<br />
concluded that to be effective, restrictions had to<br />
be broad-based, covering both capital and current<br />
account (that is, trade-related) transactions.<br />
Perhaps more important, the capital outflow<br />
restrictions imposed by undemocratic, dictatorial<br />
regimes engendered a general distrust and<br />
distaste for such measures. Henry Morgenthau,<br />
Jr., the U.S. secretary of the treasury, summed up<br />
the prevailing attitude when he wrote, “Frankly,<br />
I disapprove of exchange control.”<br />
White—took from the interwar experience was that a regime<br />
of unfettered capital flows was fundamentally inconsistent<br />
with the macroeconomic management increasingly expected<br />
of governments, and with a liberal international trade<br />
regime. (Capital outflows required governments to impose<br />
import restrictions to safeguard the balance of payments<br />
and gold reserves. On the inflow side, hot money flows<br />
could lead to speculative excess—in turn requiring monetary<br />
tightening that could damage the real economy.) Given the<br />
choice, Keynes and White preferred free trade to free capital<br />
flows—especially to short-term, speculative flows and flight<br />
capital. Hence the emphasis in the IMF’s founding charter<br />
(the Articles of Agreement) is on current, rather than capital<br />
account, convertibility and on the explicit recognition that<br />
countries may need to impose capital controls.<br />
Despite opposition by powerful New York banking interests,<br />
which succeeded in watering down key provisions in<br />
the IMF’s Articles regarding capital controls (Helleiner,<br />
1994), the Bretton Woods era was characterized by widespread<br />
use of controls (see chart). As in the interwar period,<br />
these were controls mainly on outflows rather than inflows;<br />
unlike during that period, however, they were typically not<br />
exchange restrictions but specifically capital controls.<br />
Although advanced economies were generally more<br />
restrictive than emerging markets in the early Bretton<br />
Woods years, by the 1960s, they were liberalizing—partly<br />
because the rising trade integration made it difficult to<br />
restrict capital transactions without also affecting current<br />
transactions. This trend was occasionally interrupted<br />
as countries such as Britain and France faced balance<br />
of payments pressures or crises. Even the United States<br />
imposed outflow restrictions in 1963 and broadened<br />
coverage through the decade as its<br />
balance of payments worsened.<br />
On the other end, countries<br />
that received increasingly large<br />
capital flows on speculation<br />
that the dollar<br />
Bretton Woods and beyond<br />
The lesson that the main architects of Bretton<br />
Woods—John Maynard Keynes and Harry Dexter<br />
Finance & Development June 2016 49
Tight control<br />
The use of capital controls was widespread during the Bretton Woods<br />
era.<br />
(index)<br />
1.0<br />
0.8<br />
0.6<br />
0.4<br />
0.2<br />
Advanced economies<br />
Inflow<br />
Outflow<br />
Emerging market economies<br />
(index)<br />
1.0<br />
0.8<br />
Inflow<br />
Outflow<br />
0.6<br />
0<br />
0<br />
1950 60 70 80 90 2000 10 1950 60 70 80 90 2000 10<br />
Source: Authors' estimates based on various issues of the IMF's Annual Report on Exchange<br />
Arrangements and Exchange Restrictions.<br />
Note: Advanced economies include the G7 countries (Canada, France, Germany, Italy, Japan, United<br />
Kingdom, United States). Emerging market economies include the major emerging markets that were<br />
IMF members in 1950 (Argentina, Brazil, Chile, Colombia, Ecuador, Egypt, India, Indonesia, Korea,<br />
Malaysia, Mexico, Pakistan, Peru, Philippines, South Africa, Thailand, Tunisia, Turkey, Uruguay, Venezuela).<br />
Index is average for the respective country groups (for each, 0 = no restrictions and 1 = highly<br />
restrictive, based on the authors' judgment).<br />
might be devalued imposed restrictions on short-term<br />
inflows. For example, Australia embargoed short-term<br />
borrowing and imposed deposit requirements on other<br />
borrowing; Japan tightened controls on portfolio inflows<br />
and imposed marginal reserve requirements on nonresident<br />
deposits; Germany imposed a cash deposit requirement on<br />
foreign loans and suspended interest payments on nonresident<br />
deposits; and Swiss banks agreed not to pay interest on<br />
foreign deposits or invest foreign capital in domestic securities<br />
and properties.<br />
By 1974, with the dollar floating, the United States abandoned<br />
its outflow controls. Confident that the United States<br />
would always be able to attract investors—and that capital<br />
flows would force surplus countries to adjust by appreciating<br />
their currencies—U.S. policymakers unreservedly embraced a<br />
liberal international regime for private capital flows. Reversing<br />
the thinking of Keynes and White at Bretton Woods, they also<br />
sought to put trade in financial assets on the same footing as<br />
trade in goods and services, inserting the phrase “the essential<br />
purpose of the international monetary system is to provide<br />
a framework that facilitates the exchange of goods, services,<br />
and capital among countries” when the IMF’s Articles were<br />
amended in 1978 to legitimize floating exchange rates.<br />
Financial openness in the Anglo-Saxon countries received a<br />
further boost in the early 1980s from the free market doctrine<br />
of U.S. President Ronald Reagan and U.K. Prime Minister<br />
Margaret Thatcher. In continental Europe, a major turning<br />
point came with French President François Mitterrand’s 1983<br />
anti-inflationary policies and the realization that controls on<br />
capital outflows disproportionately penalized middle-class<br />
investors less able than the rich to evade them (Abdelal, 2006).<br />
Most French outflow controls were thus lifted during 1984–86,<br />
with full capital account liberalization by 1990.<br />
This shift in attitude had major repercussions beyond<br />
France as three officials from the same Socialist administration<br />
went on to key positions in international institutions<br />
where they promoted capital account liberalization: Henri<br />
Chavranski, at the Organisation for Economic Co-operation<br />
0.4<br />
0.2<br />
and Development, where he broadened the Code of Liberalization<br />
to cover all cross-border capital movement, including<br />
short-term flows that had originally been excluded; Jacques<br />
Delors, at the European Commission, where he championed<br />
the Directive abolishing restrictions on capital movement;<br />
and Michel Camdessus, at the IMF, where he sought an<br />
amendment of the Articles to give the IMF jurisdiction over<br />
the capital account and the mandate to liberalize it.<br />
Emerging consensus<br />
As advanced economies began to liberalize during the 1960s<br />
and 1970s, the trend in emerging market and developing<br />
economies was the opposite—mainly restricting capital<br />
outflows to help keep down domestic sovereign borrowing<br />
costs. Even some measures that could be classified as inflow<br />
controls because they were likely to discourage inward investment<br />
(such as minimum investment periods or limits on the<br />
pace or amount of repatriation) were intended to prevent a<br />
sudden reversal of capital inflows and balance of payments<br />
deficits. By the early 1970s, however, inflow restrictions of a<br />
“prudential” nature began to appear. These more explicitly<br />
aimed to safeguard economic and financial stability from<br />
excessive foreign borrowing and inflow-fueled credit booms.<br />
Liberalization in emerging markets started about a decade<br />
later than in advanced economies, under a broader predisposition<br />
toward free markets and a desire to subject government<br />
policies to the discipline of the market (the so-called Washington<br />
Consensus). But as some emerging market economies<br />
liberalized their domestic financial markets and outflow<br />
controls in the late 1970s and early 1980s, they also swept away<br />
many of the existing prudential inflow measures. The result was<br />
massive inflow-fueled booms, followed by severe economic and<br />
financial busts.<br />
This experience helped shape policy responses when inflows<br />
to emerging markets resumed in the early 1990s, and led to a<br />
marked shift in the preference for longer-term, nondebt flows.<br />
Several countries—notably Brazil, Chile, Colombia, Malaysia,<br />
and Thailand—experimented with inflow controls in the<br />
1990s. Yet such measures were not viewed favorably, and the<br />
general trend during much of the 1990s was toward greater<br />
capital account openness, culminating in IMF Managing<br />
Director Camdessus’s 1995–97 initiative to give the IMF jurisdiction<br />
over, and the mandate to liberalize, the capital account.<br />
In the end, the amendment never passed, partly because of<br />
opposition from emerging market and developing economies<br />
alarmed by the unfolding east Asian crisis and concerned that<br />
the IMF would use its new mandate to force premature liberalization<br />
on reluctant countries. Regardless, the IMF’s policy<br />
advice—in contrast to the vision of Keynes and White—had<br />
moved away from viewing capital controls as an essential tool<br />
to manage destabilizing speculative flows. An IMF Independent<br />
Evaluation Office review in 2005 found that the IMF<br />
staff had recommended tightening inflow controls in just 2 of<br />
19 instances when emerging market economies experienced<br />
large capital inflows.<br />
Despite the general disapproval, several emerging market<br />
economies restricted inflows during the mid-2000s surge. In<br />
50 Finance & Development June 2016
some cases, the attempts backfired. In Thailand, for example,<br />
market reaction to the imposition of an unremunerated reserve<br />
requirement on foreign inflows in December 2006 was swift and<br />
brutal: the stock market plunged 15 percent in less than a day,<br />
forcing the central bank to reverse the measure. The perception<br />
was that the measure had evoked memories of the currency<br />
crisis and imposition of outflow controls during the east Asian<br />
crisis about a decade earlier. Financial markets thus sent a clear<br />
signal that they did not approve of capital controls—on outflows<br />
or inflows—making little distinction between the two.<br />
Pure prejudice?<br />
So why do controls on capital inflows evoke such apprehension<br />
today? The historical record offers certain clues. First, dating<br />
at least to the interwar period, when the United States resisted<br />
imposing inflow controls, it appears that controls on capital<br />
inflows became inextricably linked with outflow controls. The<br />
latter were often associated with autocratic regimes, financial<br />
repression, and desperate measures to avoid crises in mismanaged<br />
economies. Thus, more liberal economies shunned the<br />
use of inflow controls as a short-term policy tool out of fear<br />
of being viewed as market unfriendly and institutionally weak.<br />
That inflow controls are damned by guilt by association<br />
with outflow controls is also evident in most of the other<br />
criticism levied against them, which is more pertinent to<br />
outflow controls. For instance, the fear that measures, once<br />
As emerging markets liberalized<br />
outflow controls, they also<br />
swept away many prudential<br />
inflow measures.<br />
imposed, will persist and become pervasive is generally true<br />
for outflow controls. Governments often resort to heavyhanded,<br />
broad-based measures to prevent capital flight, and<br />
these are difficult to remove because of pent-up demand.<br />
Inflow restrictions, by contrast, are typically taxes or higher<br />
reserve requirements, which are easy to reverse and generally<br />
are removed when the tide turns.<br />
Capital controls are also often criticized for being ineffective—but<br />
again that applies more to outflow controls, which<br />
have at best a weak track record when it comes to preventing a<br />
crisis (Edwards, 1999). There is, however, ample evidence that<br />
inflow controls shift the composition of capital flows toward<br />
less risky and longer-maturity liabilities (Ostry, Ghosh, and<br />
Qureshi, 2015), which strengthens the case for their use as<br />
prudential instruments.<br />
A second plausible reason is that capital account restrictions<br />
are often associated with current account restrictions.<br />
This is because, historically, the most common form of capital<br />
controls was exchange restrictions that impeded the movement<br />
of both goods and capital. As countries embraced greater trade<br />
liberalization, in contrast to the Keynes-White thesis, they<br />
started to view capital controls as incompatible with free trade<br />
rather than as aiding free trade. Capital account restrictions<br />
were thus abolished along with current account restrictions.<br />
This trend was further accentuated by the rise of regional trade<br />
agreements and bilateral investment treaties (especially those<br />
with the United States) that increasingly incorporated clauses<br />
prohibiting the adoption of capital controls.<br />
Finally, with the rise of free market ideology, which<br />
considers all government intervention inherently bad, capital<br />
controls—traditionally viewed as instruments to fine-tune<br />
the economy—became discredited more generally. Emerging<br />
market economies did not become entirely oblivious to the<br />
vagaries of capital flows, but they attempted to rely on more<br />
benign-sounding—also viewed as more market-friendly—<br />
“macroprudential measures” to tackle the risks to financial<br />
stability posed by capital inflows. Yet the effect on capital<br />
flows of some of these measures, especially those related to<br />
foreign currency transactions, is economically largely indistinguishable<br />
from that of more direct capital controls. If<br />
the intent is indeed to limit inflows for prudential reasons,<br />
then calling such measures macroprudential is merely a<br />
rebranding of capital controls, confirming that the negative<br />
connotation associated with the word “controls” is the real<br />
problem.<br />
Like any other policy instrument, capital controls on inflows<br />
have pros and cons—yet, in our view, they seem to be judged<br />
not so much on their merits as by pure prejudice that is rooted<br />
in history: damned largely because of their association with<br />
outflow controls but also because of ideological battles that<br />
have little to do with their specific use. Correcting unfounded<br />
perceptions is important to ensure that policymakers respond<br />
optimally to manage the risks associated with fickle capital<br />
flows and do not shy away from using measures simply<br />
because of the connotations of their name. ■<br />
Atish Rex Ghosh is IMF Historian and a Deputy Director<br />
in the IMF’s Strategy, Policy, and Review Department, and<br />
Mahvash Saeed Qureshi is a Senior Economist in the IMF’s<br />
Research Department.<br />
This article is based on the authors’ IMF Working Paper, No. 16/25,<br />
“What’s in a Name? That Which We Call Capital Controls.”<br />
References:<br />
Abdelal, Rawi, 2006, “Writing the Rules of Global Finance: France,<br />
Europe, and Capital Liberalization,” Review of International Political<br />
Economy, Vol. 13, No. 1, pp. 1–27.<br />
Edwards, Sebastian, 1999, “How Effective Are Capital Controls?”<br />
Journal of Economic Perspectives, Vol. 13, No. 4, pp. 65–84.<br />
Helleiner, Eric, 1994, States and the Re-emergence of International<br />
Finance: From Bretton Woods to the 1990s (Ithaca, New York: Cornell<br />
University Press).<br />
International Monetary Fund (IMF), 2012, “The Liberalization<br />
and Management of Capital Flows: An Institutional View,” IMF Policy<br />
Paper (Washington).<br />
Ostry, Jonathan, Atish Ghosh, and Mahvash Qureshi, 2015, Capital<br />
Controls (London: Edward Elgar).<br />
Finance & Development June 2016 51
Stagnation Risk<br />
Ongoing<br />
economic<br />
problems<br />
make the euro<br />
area vulnerable<br />
to prolonged<br />
slow growth<br />
Huidan Lin<br />
SINCE the onset of the global financial<br />
crisis, real output in the euro area has<br />
failed to keep up with the population.<br />
As a result, output per person<br />
has stalled, and euro area output is now only<br />
$40,000 a person, about $16,000 below the U.S.<br />
level, after adjustment for price differences. This<br />
is the largest gap since 1991, when the Economic<br />
and Monetary Union began (see Chart 1).<br />
The euro area is not the only place the crisis<br />
has left scars. In advanced economies in<br />
general, the growth rate of potential output—<br />
the maximum amount of goods and services<br />
an economy can turn out at full capacity—is<br />
expected to increase only slightly and remain<br />
below the precrisis level over the next five<br />
years (IMF, 2015).<br />
These subdued medium-term prospects<br />
are particularly worrisome for the euro<br />
area, given the high level of unemployment<br />
and public and private debt in some member<br />
countries. Moreover, after several years<br />
of anemic growth, there is limited room for<br />
policy maneuvering. High unemployment<br />
and debt and constrained policymaking leave<br />
the euro area vulnerable to shocks that could<br />
lead to a prolonged period of low economic<br />
growth—often dubbed “stagnation.”<br />
Lower growth for longer<br />
Although potential output cannot be observed,<br />
it can be estimated using a production<br />
function—an economic model that calculates<br />
an economy’s output based on key inputs<br />
(labor and capital) and how efficiently they are<br />
used. When applied to the euro area, the results<br />
suggest that the prospects for larger labor<br />
and capital inputs, as well as their more efficient<br />
use, remain weak. As a result, the euro<br />
area’s growth rate at its full capacity is expected<br />
to rise only modestly from 0.7 percent during<br />
2008–14 to about 1.1 percent during 2015–20,<br />
which is significantly lower than the 1999–<br />
2007 average of 1.9 percent.<br />
Moreover, the share of older people in<br />
the population is growing, while the share<br />
of working-age (15–64) people is shrinking.<br />
Because the propensity to join the workforce<br />
typically begins to erode after age 50,<br />
the average labor force participation rate<br />
is declining. At the same time, the capital<br />
stock is expected to grow slowly. The capital<br />
stock expands when new investment outpaces<br />
the rate at which that stock wears out<br />
(depreciation). This hasn’t been the case in<br />
the euro area, where business investment<br />
has expanded moderately since 2013, and<br />
Graffiti on the walls of an<br />
abandoned hat factory,<br />
Porto, Portugal.<br />
52 Finance & Development June 2016
Lin, corrected 04/25/2016<br />
reached its 2008 level only in 2015 (see Chart 2). In other<br />
words, the euro area continues to suffer from too few workers<br />
and too little investment.<br />
The area also suffers from weak productivity growth (that<br />
is, output per worker hour). Empirical studies find that slow<br />
progress in improving the efficient use of labor and capital in<br />
the euro area, particularly in the service sector, bears most of<br />
the blame for a widening gap in productivity with the United<br />
Lower potential growth makes it<br />
harder to bring down debt.<br />
States. Slower efficiency improvements and lower productivity<br />
growth in services in turn reflect delayed adoption and<br />
diffusion of information and communications technology.<br />
Unlike in the United States, where output per service sector<br />
employee has surpassed its precrisis peak, growth in the euro<br />
area has been gradual, and productivity remains below its<br />
precrisis peak in countries such as Germany and Italy.<br />
Moreover, gains in the efficient use of labor and capital in<br />
the United States are likely to slow in the future, which will<br />
probably affect other advanced economies (IMF, 2015). In<br />
addition, adopting and promoting innovation call for flexibility<br />
and adaptability. Without swift action to address structural<br />
problems in the euro area—such as difficulties in firing workers<br />
or cutting wages and a business environment unfriendly to<br />
start-ups—diffusion of new technology may be delayed.<br />
Crisis legacies linger<br />
Some problems, such as high unemployment and high public<br />
and private debt, predate the crisis. While the return to<br />
modest growth should help address these problems to some<br />
extent, without decisive policies to improve growth prospects<br />
and reinvigorate investment, unemployment and debt will<br />
remain a drag on economic growth. High debt could hold<br />
back new investment, and high unemployment could arrest<br />
human capital development (by delaying investment in education<br />
and health, for example).<br />
The euro area unemployment rate remains high, especially<br />
for youth and the long-term jobless, raising the risk of skill<br />
erosion and entrenched high unemployment. Despite recent<br />
improvement, the unemployment rate remains above 10 percent<br />
in the euro area and much higher in some countries—<br />
for example, nearly 25 percent in Greece. Among those<br />
unemployed in the euro area, more than half have been out<br />
of a job for more than 12 months—a proportion of the unemployed<br />
ranging from a low of about one-quarter in Finland to<br />
nearly three-quarters in Greece. High youth unemployment<br />
could also give rise to a “lost generation” of workers.<br />
Over the medium term, the so-called natural rate of unemployment—the<br />
rate at which demand for and supply of<br />
workers are in equilibrium and employment and wage developments<br />
do not create inflation pressure—is projected to<br />
Chart 1<br />
Falling behind<br />
The gap between output per person in the euro area and in<br />
the United States is the biggest since Europe’s Economic<br />
and Monetary Union started in 1991.<br />
(real GDP per person, index, 1991 = 100)<br />
150<br />
140<br />
United States<br />
130<br />
Euro area<br />
120<br />
Lin, 110corrected 04/12/2016<br />
Japan<br />
100<br />
90<br />
1991 95 99 2003 07 11 15<br />
Sources: IMF, World Economic Outlook; and author’s calculations.<br />
Note: Real GDP is nominal GDP adjusted to account for inflation.<br />
Chart 2<br />
Slow recovery<br />
Nonresidential investment in the euro area did not return to<br />
the precrisis level until the end of 2015.<br />
(net nonresidential investment, 2015:Q4; index, 2008:Q1 = 100)<br />
120<br />
110<br />
100<br />
90<br />
80<br />
70<br />
60<br />
50<br />
40<br />
Sources: Eurostat; and author’s calculations.<br />
Greece<br />
Portugal<br />
Italy<br />
Japan<br />
Euro area<br />
Spain<br />
Germany<br />
France<br />
United Kingdom<br />
United States<br />
remain higher in Italy than during the crisis and decline very<br />
slowly in France. While the natural rate is expected to fall in<br />
Spain, it is still expected to remain above 15 percent over the<br />
next five years. In one scenario, for the euro area as a whole,<br />
based on historical relationships between output and unemployment,<br />
it could take about four years to reduce the unemployment<br />
rate to the average 2001–07 level without a persistent<br />
pickup in growth. It would take even longer for countries with<br />
higher unemployment and/or lower growth (such as Greece,<br />
Italy, Portugal, and Spain). Effective implementation of ongoing<br />
structural reforms could reduce that time by raising potential<br />
growth and/or making hiring more responsive to growth.<br />
In addition to high public debt, which makes it difficult<br />
for countries to use spending and tax policy to stimulate<br />
the economy, private sector debt must be further reduced<br />
to enable new investment. Nonfinancial corporate debt-toequity<br />
ratios have fallen in most euro area countries as firms<br />
have paid down borrowing. However, the debt reduction in<br />
many cases was accompanied by a cut in investment, a sharp<br />
increase in saving, and higher unemployment. In earlier episodes<br />
of significant corporate debt reduction, IMF research<br />
Finance & Development June 2016 53
Lin, 04/4/2016<br />
found, two-thirds of the increase in debt during credit booms<br />
is, on average, subsequently reduced (IMF, 2013). If debt<br />
reduction in the euro area follows a similar path, firms have<br />
a long way to go in paying off debt, which could significantly<br />
delay a recovery in investment. Households in some euro area<br />
countries also suffer from high debt. Although household<br />
debt-to-GDP ratios have fallen 10 to 20 percentage points<br />
in high-debt countries, they remain significantly above their<br />
preboom levels, raising the prospect that debt will continue<br />
to inhibit consumer spending for some time.<br />
Insuring against shocks<br />
The baseline projection for the euro area continues to foresee<br />
subdued growth and inflation over the medium term. This reflects<br />
the impact of high unemployment, heavy debt burdens,<br />
and weak balance sheets that suppress demand and of longstanding<br />
structural weaknesses—such as a rigid labor market<br />
and an overprotected product market—that depress potential<br />
growth. Moreover, these factors are intertwined: lower potential<br />
growth makes it harder to bring down debt, while high<br />
unemployment and low investment hurt capital accumulation<br />
and reduce potential growth.<br />
Subdued medium-term prospects leave the euro area susceptible<br />
to negative shocks—such as another global slowdown—that<br />
could push economies into stagnation because<br />
they are hamstrung by their inability to respond through<br />
macroeconomic policies (such as cutting taxes and/or<br />
increasing spending). Moreover, unaddressed problems from<br />
the crisis could amplify these shocks. For instance, markets<br />
could reassess the sustainability of countries with high debt;<br />
subsequent higher borrowing costs would in turn raise the<br />
risk of a debt-deflation spiral.<br />
An economic model used to simulate the effect of shocks<br />
on the euro area makes several assumptions: with interest<br />
rates at zero, monetary policy cannot do much more to<br />
stimulate the economy, and high debt limits the use of fiscal<br />
policy beyond the operation of automatic stabilizers such as<br />
unemployment benefits.<br />
In this scenario, several developments—such as an increase<br />
in geopolitical tension, a political crisis within the European<br />
Union, or lowered growth expectations—could trigger a sudden<br />
drop in investor confidence. Lower equity prices would<br />
follow, along with a 25 percent decrease in investment growth<br />
(from about 2 percent to 1.5 percent annually) relative to the<br />
baseline projection. This would raise public-debt-to-GDP<br />
ratios differently across the euro area, depending on a particular<br />
economy’s level of debt. Market concerns about debt<br />
sustainability would also increase more for indebted countries.<br />
Sovereign and corporate interest rates would rise by a<br />
full percentage point in Greece, Ireland, Italy, Portugal, and<br />
Spain—similar to the increase in the Spanish 10-year sovereign<br />
bond yields during late June and July 2012.<br />
These results highlight the vulnerability of the euro area<br />
to lower growth. By 2020 the euro area output level would<br />
be nearly 2 percent lower than the baseline projection. As<br />
a result, it would take three to four more years (relative to<br />
the baseline projection) for economic output to reach its<br />
Chart 3<br />
Behind the curve<br />
A shock to investment in the euro area makes the<br />
economies grow far more slowly than in baseline<br />
projections.<br />
(cumulative growth loss by 2020, percent)<br />
Euro area<br />
Germany<br />
France<br />
Italy<br />
Spain<br />
Portugal<br />
Greece<br />
Ireland<br />
–4 –3 –2 –1 0<br />
Source: Author’s estimates.<br />
Note: The results are based on an economic model used to simulate the effect of<br />
shocks—such as an increase in geopolitical tension, a political crisis, or lower<br />
expectations for growth—on the euro area. The model assumes fewer additional effects<br />
from monetary policy and constraints on fiscal policy beyond automatic stabilizers such<br />
as unemployment benefits. The baseline is the projected path of economic growth under<br />
current conditions.<br />
full potential. Borrowing costs would increase, especially<br />
in Greece, Ireland, Italy, Portugal, and Spain. The unemployment<br />
rate and public-debt-to-GDP ratios would also<br />
increase. Inflation rates would be lower, pushing the euro<br />
area closer to deflation in the near term (see Chart 3).<br />
Reducing vulnerability<br />
Weak medium-term prospects and limited potential to use<br />
economic policy to stimulate their economies leave the euro<br />
area vulnerable to shocks that could lead to a prolonged period<br />
of low growth and low inflation. Insuring against such<br />
risks would require a broad and balanced set of policies. Such<br />
policies should go beyond the easing of monetary policy that<br />
has been the main tool to stimulate euro area economies.<br />
Banks, the bulwark of the European financing system, need<br />
to be put under stricter supervision and must make faster<br />
progress in getting bad loans off their books so that they can<br />
lend more. Policymakers must facilitate the restructuring of<br />
unhealthy but viable firms to reduce debt and allow them<br />
to begin to invest again. Authorities also need to undertake<br />
structural reforms to improve productivity and raise potential<br />
growth and, when they are able, to increase spending to boost<br />
demand, which will promote economic growth. ■<br />
Huidan Lin is an Economist in the IMF’s European Department.<br />
This article is based on the author’s IMF working paper, No. 16/9, “Risks of<br />
Stagnation in the Euro Area.”<br />
References:<br />
International Monetary Fund (IMF), 2013, “Indebtedness and<br />
Deleveraging in the Euro Area,” Euro Area Policies, 2013 Article IV<br />
Consultation—Selected Issues Paper, IMF Country Report 13/232<br />
(Washington).<br />
———, 2015, “Where Are We Headed? Perspectives on Potential<br />
Output,” World Economic Outlook, Chapter 3 (Washington, April).<br />
54 Finance & Development June 2016
BOOK REVIEWS<br />
Money, It's a Hit<br />
William N. Goetzmann<br />
Money Changes Everything<br />
How Finance Made Civilization<br />
Possible<br />
Princeton University Press, Princeton, New<br />
Jersey, 2016, 600 pp., $35.00 (cloth).<br />
A<br />
five-year 3.78 percent loan<br />
between two businessmen<br />
in 1796 may not seem<br />
remarkable, but it turns out that’s<br />
1796 BCE, and the businessmen<br />
lived in the ancient Sumerian city<br />
of Ur. William N. Goetzmann’s<br />
sprawling Money Changes Everything<br />
spans ancient Mesopotamia to<br />
20th century America, China, and<br />
Europe, with excursions through<br />
classical Greece and Rome, ancient<br />
and imperial China, and centers of<br />
financial innovation in medieval and<br />
Renaissance Europe.<br />
Goetzmann aims to show the enabling<br />
role finance played in the development<br />
of human society, culture,<br />
and knowledge. His core thesis is that<br />
financial innovations through the<br />
ages have overridingly had a civilizing<br />
influence. Today, when financiers are<br />
so often seen as malign influences,<br />
such a view may seem contentious,<br />
but Goetzmann makes a strong case.<br />
His method of persuasion is to deluge<br />
the reader with a wealth of historical<br />
detail. The sheer density can<br />
overwhelm at times, but he leavens<br />
his account with fascinating historical<br />
episodes and characters and personal<br />
tales of discovery (for example, his<br />
role in unearthing the 1372 founding<br />
charter of the Honor del Bazacle in<br />
Toulouse, France—a corporation that<br />
survived into the 20th century).<br />
The book starts in the Mesopotamian<br />
city of Uruk, where markings<br />
on clay tokens that served as financial<br />
records evolved into cuneiform,<br />
one of the earliest forms of writing.<br />
Early financial innovations influenced<br />
humanity’s concept of time. A<br />
360-day Sumerian calendar did not<br />
correspond in any way to astronomical<br />
time, but 360 is a number divisible<br />
into many whole numbers, ideal<br />
for parceling time into even ratios<br />
convenient for financial contracts.<br />
(In fact, the 360-day year is still used<br />
in calculating modern-day bond<br />
interest accruals.)<br />
Conceptions of time in medieval<br />
financial contracts may have<br />
been a counterpoint to ecclesiastical<br />
notions, contributing to a clash<br />
between the church and commercial<br />
society. Arm’s-length financial transactions—and<br />
therefore a level of<br />
trust in a financial system that could<br />
substitute for the personal relationships<br />
that prevailed in traditional<br />
societies—were critical to increasing<br />
population densities.<br />
Finance fostered the<br />
capacity for abstract<br />
thought.<br />
Finance also fostered the capacity<br />
for abstract thought. Most students of<br />
finance recognize its role in the development<br />
of mathematics and probability<br />
theory, but Goetzmann also points<br />
out the degree of abstraction needed to<br />
understand, for example, the concept<br />
of financial claims as a form of nonphysical<br />
wealth that had to be tracked<br />
through accounting entries.<br />
Such an all-encompassing tableau<br />
frequently delivers the jolting shock<br />
of familiarity that is one of the great<br />
pleasures of reading history. For<br />
example, in the Mesopotamian city<br />
of Dilmun, ordinary citizens could<br />
participate passively in ventures by<br />
contributing capital of a bracelet,<br />
much as a modern household might<br />
buy a share or two of Google stock.<br />
Thirteenth century Venetians eagerly<br />
bought prestiti, the first true government<br />
bonds. Such financial inclusion<br />
gave people passive, liquid stakes in<br />
diversified income-generating activities<br />
that could provide a measure of<br />
economic security, as well as a stake<br />
in the state’s economic expansion.<br />
The book also explores how financial<br />
markets continually found ways<br />
to liquefy apparently illiquid assets.<br />
The records of a 7th century Chinese<br />
pawnshop reveal that just about<br />
anything with resale value could be<br />
used as security for a loan; in the<br />
15th century, a speculative futures<br />
market developed in the dividends<br />
of the Casa di San Giorgio, an entity<br />
formed to handle the finances of the<br />
city of Genoa.<br />
The development of corporate<br />
structures gets an in-depth look, in<br />
particular the importance of liquid,<br />
limited-liability claims in fostering<br />
necessary risk taking and of the<br />
development of public finance (the<br />
Genoese government was financed<br />
through equity-like instruments<br />
long before the development of<br />
modern-day GDP- and commodityprice-linked<br />
bonds). Coinage (for<br />
example, in Greece and Rome) and<br />
paper money (in China) are shown<br />
to be solutions to specific problems <br />
at specific times.<br />
Goetzmann does not ignore<br />
the dark side of finance, including<br />
financial crises in ancient Rome (33<br />
CE) and the more familiar tales of the<br />
South Sea and Mississippi bubbles<br />
of the 18th century. He attributes<br />
the bursting of financial bubbles as<br />
frequently to government intervention<br />
(for example, the Bubble Act of<br />
1720) as to irrational behavior among<br />
overleveraged investors.<br />
A remarkable work of synthesis<br />
and scholarship, the book affords a<br />
deep perspective to anyone trying to<br />
grapple with current problems in the<br />
role of finance and financial regulation<br />
in a civilized society.<br />
Elie Canetti<br />
Advisor,<br />
IMF Western Hemisphere Department<br />
Finance & Development June 2016 55
BOOK REVIEWS<br />
Robbing Hood<br />
Kenneth Scheve and David Stasavage<br />
Taxing the Rich<br />
A History of Fiscal Fairness in the<br />
United States and Europe<br />
Princeton University Press, Princeton, New<br />
Jersey, 2016, 288 pp., $29.95 (cloth).<br />
Visiting a depressed Welsh village<br />
in the 1930s, the future<br />
British King Edward VII<br />
famously remarked that “something<br />
must be done.” Current agonizing over<br />
rising inequality has a similarly plaintive<br />
feel. Will anything actually be done<br />
about it, in the form of much greater<br />
tax progressivity? This admirable book<br />
gives a clear answer: probably not.<br />
This is just one implication of the<br />
authors’ big idea: a distinctive theory<br />
of what drives strongly progressive<br />
taxation. To arrive at it, they first<br />
elegantly dispose of two alternative<br />
explanations. One is that progressive<br />
taxation comes about as an application<br />
of ability-to-pay arguments:<br />
the rich should pay a higher tax rate<br />
because it hurts them less. But the<br />
authors show that higher top tax<br />
rates have generally not resulted from<br />
higher pretax inequality. The other is<br />
that increased progressivity has come<br />
from extension of suffrage, with the<br />
numerically dominant poor voting to<br />
extract resources from the outnumbered<br />
rich. But the authors conclude<br />
that this story doesn’t work either.<br />
What remains is their “compensatory”<br />
theory—the idea that strongly<br />
progressive personal tax systems<br />
are most likely to emerge when, in<br />
democracies, there is some fundamental<br />
state-induced unfairness that<br />
cannot be removed by other means<br />
and when, in particular, “the deck is<br />
stacked in favor of the rich, and the<br />
government did the stacking.”<br />
Such unfairness can take several<br />
forms, such as broad-based commodity<br />
taxes needed for revenue reasons.<br />
But the most important source, at the<br />
center of their argument, is mass mobilization<br />
for war. The U.S. Civil War<br />
fits the bill, for example, with mass<br />
levies and widespread sentiment that<br />
this was a “rich man’s war and a poor<br />
man’s fight.” Sure enough, both sides<br />
introduced a progressive income tax.<br />
(That the federal income tax was soon<br />
removed is consistent with a further<br />
implication of the compensatory<br />
view: progressivity fades once the<br />
fundamental unfairness subsides.)<br />
The same broad narrative fits the two<br />
world wars, which the book examines<br />
in detail. But the world, and the technology<br />
of warfare in particular, has<br />
changed. It is the shift toward hightech<br />
warfare rather than fighting with<br />
mass armies that makes the authors<br />
believe that further bouts of steep<br />
progressivity comparable to those of<br />
the 20th century are unlikely.<br />
The book is a methodological<br />
model. The authors develop their<br />
arguments through a broad array<br />
of methods: econometrics, laboratory<br />
experiments, textual analysis,<br />
and historical narratives. Especially<br />
worth mentioning is the data set (at<br />
the heart of their analytics) they have<br />
assembled on top income tax and<br />
inheritance tax rates in 20 countries<br />
during 1800–2013.<br />
Kenneth Scheve and David Stasavage<br />
give us much to think about.<br />
There do, for instance, seem to be<br />
contradictory cases of mass mobilization<br />
that did not give rise to sharply<br />
more progressive income or inheritance<br />
taxation. One is the era of the<br />
French Revolution, when, the authors<br />
argue, other progressive taxes were<br />
levied instead. Another case may<br />
be Israel, where the top income tax<br />
rate (relating too to forced loans) increased<br />
by about 10 percentage points<br />
in the seven years around the 1967<br />
war—but the lowest rate increased by<br />
about 12. Conversely, progressivity<br />
sometimes increased without mobilization:<br />
the authors point to noncombatant<br />
democracies during World<br />
War I. Systematically identifying and<br />
analyzing apparent counterexamples<br />
could lead to a better understanding<br />
of both the power and possible limits<br />
of the compensatory view.<br />
High-tech warfare<br />
makes further<br />
bouts of steep<br />
progressivity<br />
unlikely.<br />
Perhaps the most fundamental<br />
task the book leaves us, however, is<br />
unpacking the underlying notion of<br />
state-induced unfairness. The case<br />
made for the importance and power<br />
of compensatory arguments in public<br />
discourse on these issues is wholly<br />
compelling. But what raises these arguments<br />
to a level at which they make<br />
a strong mark on policy? In World<br />
War I, for instance, the British officer<br />
class had a far higher death rate than<br />
did ordinary soldiers from poorer<br />
backgrounds. And might it be that the<br />
rich are willing to make unusual concessions<br />
in wartime because they have<br />
more at stake in not losing (the “rich<br />
man’s war”)? Why has resentment at<br />
the combination of bailouts and austerity<br />
over the past few years not (yet)<br />
led to much greater progressivity?<br />
The authors make the force of the<br />
compensatory view clear. Judging by<br />
the apparent success of the rhetoric<br />
during the 2016 U.S. presidential primaries<br />
that speaks of a system rigged<br />
to favor the rich, the compensatory<br />
theory has not gone unnoticed by<br />
political strategists.<br />
Michael Keen<br />
Deputy Director,<br />
IMF Fiscal Affairs Department<br />
56 Finance & Development June 2016
Yours and Mine<br />
Arun Sundararajan<br />
The Sharing Economy<br />
The End of Employment and the<br />
Rise of Crowd-Based Capitalism<br />
MIT Press, Cambridge, Massachusetts,<br />
2016, 256 pp., $26.95 (cloth).<br />
The sharing economy is<br />
transforming commerce right<br />
before our eyes. Thousands are<br />
skipping the hassle of standing on a<br />
corner in the rain to hail a cab and are<br />
simply summoning an Uber or Lyft to<br />
whisk them to the airport. Others are<br />
selling their knitting on Etsy, letting<br />
strangers stay in their home through<br />
Airbnb, or having their weeds pulled<br />
by a gardener hired via TaskRabbit.<br />
Countless “workers” are flocking to<br />
Amazon’s Mechanical Turk to complete<br />
“Human Intelligence Tasks” for<br />
just pennies.<br />
Sharing economy expert and New<br />
York University Stern School of<br />
Business professor Arun Sundararajan<br />
tackles the myriad issues these<br />
developments have spawned in his<br />
path-breaking book.<br />
Sundararajan knows his stuff. He’s<br />
an award-winning scholar who writes<br />
with a clarity that masks the complexity<br />
of his subject. Citing his own<br />
research and that of many others, he<br />
explains how organizations whose<br />
main purpose is to create the supply<br />
needed to meet consumer demand<br />
are driving today’s economy. He explores<br />
how these developments spell<br />
the end of employment as we know it<br />
and what society should do to shield<br />
the American worker from the worst<br />
Darwinian aspects of crowd-based<br />
capitalism.<br />
Sundararajan divides the book into<br />
two logical parts, cause and effect,<br />
with each of eight main chapters addressing<br />
a concrete topic. If you’re befuddled<br />
by the notion of blockchain<br />
technology and bitcoin or wonder<br />
exactly how a “platform” differs from<br />
a “hierarchy,” you’ll find the answers<br />
in this enormously helpful and comprehensive<br />
book.<br />
Sundararajan identifies five core<br />
characteristics of the sharing economy.<br />
It’s largely market based, puts<br />
underutilized capital to use, relies on<br />
crowd-based networks, and blurs the<br />
lines not just between the personal<br />
and the professional, but also between<br />
employment and casual work.<br />
What generated this crowd-based<br />
capitalism? Apple’s Steve Jobs and the<br />
iPod, says Sundararajan. The iPod<br />
was the first successful mass-market<br />
product developed primarily for consumers,<br />
rather than for business or<br />
government, and ever since, the most<br />
important innovations—think the<br />
iPhone, iPad, and Facebook—have<br />
centered on the consumer.<br />
Trust is essential to this economy.<br />
Our 20th century relatives would<br />
have been reluctant to allow strangers<br />
to drive their cars or stay in their<br />
homes while they were on vacation<br />
on a mere promise to pay. Yet thousands<br />
of people do these things every<br />
day because the digital economy has<br />
created a network we can trust.<br />
It has generated positive spillover<br />
effects by putting underused assets<br />
to work and expanding economic<br />
opportunity. Yet it has also spawned<br />
negative externalities—your neighbor<br />
might not like the comings and<br />
goings of your Airbnb “guests”—and<br />
weak regulation has certainly helped<br />
the sharing economy grow. For<br />
example, Airbnb might struggle to<br />
survive if its casual hosts had to meet<br />
the same fire, safety, and other regulations<br />
that govern conventional hotels.<br />
Sundararajan advocates giving<br />
regulatory responsibility to the peerto-peer<br />
marketplace and allowing<br />
new self-regulatory organizations to<br />
fill the gap. But he may be overestimating<br />
the private sector’s ability to<br />
provide sufficient consumer protection.<br />
Although keeping government<br />
regulators at bay may seem<br />
necessary to incubate the sharing<br />
economy, consumers may have to<br />
suffer through lots of dangerous rides,<br />
filthy apartments, and ruined gardens<br />
before the “collaborative” market<br />
sorts things out.<br />
Trust is essential<br />
to the sharing<br />
economy.<br />
I would have liked to see additional<br />
data on compensation. For example,<br />
Sundararajan asserts that workers can<br />
generally expect to earn a higher hourly<br />
wage through freelance assignments<br />
than through traditional channels,<br />
citing plumbers in San Francisco as<br />
evidence. But this assertion is misleading<br />
for two reasons. First, hourly wage<br />
data don’t include benefits, which<br />
typically account for 20 to 30 percent<br />
of total compensation. Second, it’s<br />
one thing to earn a wage premium<br />
for an hour or so of freelancing, but<br />
it’s another to find a year’s worth of<br />
freelance work at that rate. Many freelancers<br />
would love to make the kind<br />
of money—about $66,500 a year—San<br />
Francisco’s plumbers earn.<br />
This point doesn’t detract from the<br />
high quality of Sundararajan’s book,<br />
which is essential to understanding<br />
how today’s crowd-based capitalism<br />
beats yesterday’s industrial revolution.<br />
In Adam Smith’s world, the market’s<br />
invisible hand led supply and demand<br />
to intersect. In Sundararajan’s world,<br />
the invisible hand is still at work. It’s<br />
just that it now has help from peer-topeer<br />
funding, impersonal platforms,<br />
blockchain technology, and those<br />
ubiquitous apps.<br />
Joann M. Weiner<br />
Director, MA in Applied Economics,<br />
The George Washington University<br />
Author, Company Tax Reform<br />
in the European Union<br />
Finance & Development June 2016 57
I N T E R N A T I O N A L M O N E T A R Y F U N D<br />
Highlights from IMF Publications<br />
Inequality and Fiscal Policy<br />
978-1-51356-775-4. $50. Hardback. 442pgs.<br />
Africa on the Move: Unlocking the Potential of<br />
Small Middle-Income States<br />
978-1-51358-860-5. $30. Paper. 182pgs.<br />
Breaking the Oil Spell:<br />
The Gulf Falcons’ Path to Diversification<br />
978-1-51353-786-3. $40. Paper. 212pgs.<br />
Collapse and Revival: Understanding<br />
Global Recessions and Recoveries<br />
978-1-51357-002-0. $65. Hardback. 292pgs.<br />
Visit bookstore.imf.org/fd616<br />
Finance & Development, June 2016