

Q2 2016 Industrial Research Market Report - Final

Create successful ePaper yourself
Turn your PDF publications into a flip-book with our unique Google optimized e-Paper software.
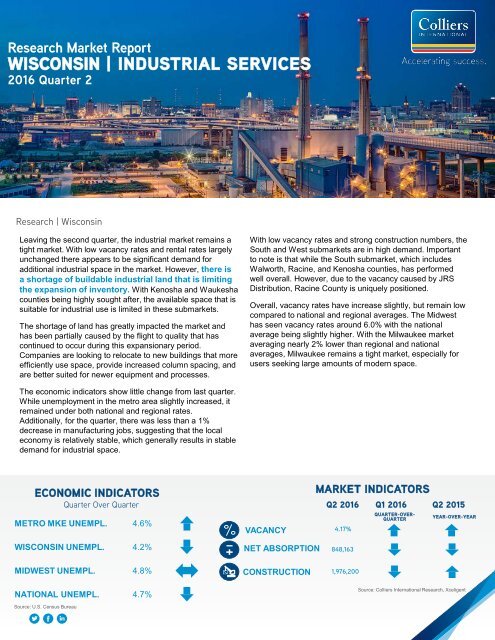
<strong>Research</strong> <strong>Market</strong> <strong>Report</strong><br />
WISCONSIN | INDUSTRIAL SERVICES<br />
<strong>2016</strong> Quarter 2<br />
<strong>Research</strong> | Wisconsin<br />
Leaving the second quarter, the industrial market remains a<br />
tight market. With low vacancy rates and rental rates largely<br />
unchanged there appears to be significant demand for<br />
additional industrial space in the market. However, there is<br />
a shortage of buildable industrial land that is limiting<br />
the expansion of inventory. With Kenosha and Waukesha<br />
counties being highly sought after, the available space that is<br />
suitable for industrial use is limited in these submarkets.<br />
The shortage of land has greatly impacted the market and<br />
has been partially caused by the flight to quality that has<br />
continued to occur during this expansionary period.<br />
Companies are looking to relocate to new buildings that more<br />
efficiently use space, provide increased column spacing, and<br />
are better suited for newer equipment and processes.<br />
With low vacancy rates and strong construction numbers, the<br />
South and West submarkets are in high demand. Important<br />
to note is that while the South submarket, which includes<br />
Walworth, Racine, and Kenosha counties, has performed<br />
well overall. However, due to the vacancy caused by JRS<br />
Distribution, Racine County is uniquely positioned.<br />
Overall, vacancy rates have increase slightly, but remain low<br />
compared to national and regional averages. The Midwest<br />
has seen vacancy rates around 6.0% with the national<br />
average being slightly higher. With the Milwaukee market<br />
averaging nearly 2% lower than regional and national<br />
averages, Milwaukee remains a tight market, especially for<br />
users seeking large amounts of modern space.<br />
The economic indicators show little change from last quarter.<br />
While unemployment in the metro area slightly increased, it<br />
remained under both national and regional rates.<br />
Additionally, for the quarter, there was less than a 1%<br />
decrease in manufacturing jobs, suggesting that the local<br />
economy is relatively stable, which generally results in stable<br />
demand for industrial space.<br />
ECONOMIC INDICATORS<br />
Quarter Over Quarter<br />
METRO MKE UNEMPL. 4.6%<br />
WISCONSIN UNEMPL. 4.2%<br />
MIDWEST UNEMPL. 4.8%<br />
NATIONAL UNEMPL. 4.7%<br />
VACANCY 4.17%<br />
NET ABSORPTION 848,163<br />
CONSTRUCTION 1,976,200<br />
MARKET INDICATORS<br />
<strong>Q2</strong> <strong>2016</strong><br />
Q1 <strong>2016</strong><br />
QUARTER-OVER-<br />
QUARTER<br />
<strong>Q2</strong> 2015<br />
YEAR-OVER-YEAR<br />
Source: Colliers International <strong>Research</strong>, Xceligent<br />
Source: U.S. Census Bureau
Vacancy<br />
Vacancy rates have remained relatively constant across all submarkets<br />
in the past year with the one exception being the South submarket.<br />
Previous vacancy rates signaled that the market was under supplied.<br />
The increase in vacancy rates over the past year account for the market<br />
demand matching with the market supply. YTD the South submarket has<br />
seen an additional 600,000 SF of inventory. Of the delivered inventory,<br />
Enterprise Business Park in Racine delivered 375,900 SF.<br />
The West market has a vacancy rate of 2.72%. Because the market is in<br />
high demand, the available inventory in the market is limited. Further<br />
exacerbating the problem, there are few sites appropriate for industrial<br />
development. With low inventory, flat rents and limited opportunity to<br />
bring new inventory to market, vacancy rates in the west submarket are<br />
likely to remain low.<br />
For the Milwaukee market, the average vacancy rate across all<br />
submarkets is 4.07%. However, once the West and South submarkets<br />
are excluded, the average vacancy rate stabilizes to 4.67%. While the<br />
South and West submarkets have the lowest rates, the vacancy rates of<br />
all submarkets and the overall Milwaukee market remain low, especially<br />
when compared to regional and national averages.<br />
Construction<br />
Below, the historical construction numbers by submarket are depicted.<br />
Over the past five quarters, the South and West submarkets have seen<br />
the majority of new construction in terms of SF. New construction is<br />
trending towards additional space between columns, higher clear<br />
heights, and larger loading docks to accommodate changing<br />
technologies and equipment. Additionally, construction has seen an<br />
increase in speculative construction whereas, a few years ago, the<br />
market was dominated by build-to-suit. This shift, indicates a shift in<br />
market sentiment as developers are confident in the market and<br />
therefore, are willing to develop industrial space prior to having all<br />
tenants secured.<br />
NORTHWEST<br />
NORTH<br />
SHEBOYGAN<br />
WASHINGTON OZAUKEE<br />
WEST<br />
CENTRAL<br />
MILWAUKEE<br />
WAUKESHA<br />
RACINE<br />
WALWORTH KENOSHA<br />
SOUTH<br />
Vacancy by Submarket<br />
6.00%<br />
5.01%<br />
5.00% 4.43% 4.30%<br />
4.40%<br />
4.00%<br />
3.00%<br />
2.72%<br />
2.00%<br />
1.00%<br />
0.00%<br />
<strong>Q2</strong> '15 Q3 '15 Q4 '15 Q1 '16 <strong>Q2</strong> '16<br />
South Submarket Construction<br />
Breakdown<br />
Source: Xceligent<br />
Square Feet<br />
For this quarter, Kenosha County has seen the most construction with<br />
approximately 1.5 million SF under construction, outweighing the other<br />
submarkets. Of the total SF under construction in Kenosha County,<br />
approximately two-thirds comes from the additional distribution center<br />
being built for Uline. With historically low vacancy rates, and an ideal<br />
location for distribution and manufacturing due to the close proximity to<br />
the Chicago market, speculation and build to suit construction is<br />
expected to continue in the area.<br />
Historical New Construction by Submarket<br />
Uline Midwest Distribution<br />
7801 Fond Du Lac Rd<br />
LakeView Corporate Park<br />
Majestic Corporate Center<br />
1 Globe Dr<br />
61,000<br />
200,696<br />
424,164<br />
120,000<br />
880,000<br />
Source: Xceligent<br />
2,500,000<br />
2,157,880<br />
Square Feet<br />
2,000,000<br />
1,500,000<br />
1,000,000<br />
500,000<br />
1,338,621<br />
1,542,907<br />
1,411,494 1,488,902<br />
0<br />
<strong>Q2</strong> '15 Q3 '15 Q4 '15 Q1 '16 <strong>Q2</strong> '16<br />
Source: Xceligent<br />
North Northwest West Central South Total<br />
2<br />
<strong>Industrial</strong> <strong>Research</strong> & Forecast <strong>Report</strong> | <strong>2016</strong> Quarter 2 | Wisconsin | Colliers International
Trends<br />
• Newer / quality buildings are<br />
receiving lots of attention and<br />
these deals are getting done<br />
quickly.<br />
• <strong>Market</strong> wide, sales price PSF<br />
have increased ±10%.<br />
Highlights<br />
• Froedtert has taken<br />
occupancy of an <strong>Industrial</strong><br />
Spec Building located in<br />
Northeast Menomonee Falls.<br />
• JRS Distribution lost a major<br />
contract resulting in them<br />
vacating 300,000 SF of space<br />
in Racine County. As a result,<br />
the Racine County submarket<br />
remains soft.<br />
• Sharp Packaging moved to a<br />
new building with 152,000 SF,<br />
making it one of the top lease<br />
deals of the quarter. Their old<br />
space (approximately 20,000<br />
SF) was leased within 30 days.<br />
Both spaces are located in the<br />
West submarket.<br />
Absorption and Leasing Activity<br />
While new construction activity has been strongest in the West and South, both<br />
submarkets registered quarter over quarter decreases in absorption. Additionally,<br />
the South has failed to absorb as much space as the West and experienced<br />
substantial decreases in absorption this quarter.<br />
Over the past year, absorption for the North and Northwest submarkets have<br />
remained relatively low, with little growth activity occurring in these areas. The<br />
Central submarket had strong absorption a year ago, but has since fallen to levels<br />
that are not as strong as the West and South but stronger than the North and<br />
Northwest markets.<br />
Among the different submarkets, average absorption per quarter over the past<br />
year has fluctuated substantially, with the South averaging the strongest with<br />
477,668 SF followed by the Central at 384,638 SF. Due to negative absorption in<br />
2015 Q4 and near zero absorption in 2015 <strong>Q2</strong>, the West averages only 231,967<br />
SF over the past five quarters. The North and Northwest average 29,745 SF and<br />
60,200 SF respectively. As construction continues in the West and South it is<br />
expected that absorption in both submarkets will continue to increase in the<br />
coming quarters.<br />
Rates<br />
Overall, rental rates have not responded to changing product type. In the industrial<br />
market, regardless of the submarket, there has been little change in the average<br />
asking rates. In four quarters, there has been on average $0.03 raise in asking<br />
rents, which translates to a 0.57% increase, substantially less than average<br />
inflation of 1.54% over the same period.<br />
Rental rates across the submarkets are relatively similar with the West submarket<br />
having the highest average asking rent. With new construction occurring in the<br />
West and South submarkets, it should be expected that the average rental rates in<br />
these markets will change in the coming quarters as these buildings are delivered<br />
to market. However, seeing as historically the market has not increased rates in<br />
response to new product, it is unlikely that there will be any sudden spikes in rental<br />
rates in the near future.<br />
As opposed to rental rates, sale price on a per square foot basis has increased in<br />
recent quarters. The magnitude of the increase is dependent on the submarket,<br />
but most submarkets are experiencing at least a 10% increase in price PSF, with<br />
some markets experiencing 15-20%.<br />
1,250,000<br />
1,000,000<br />
750,000<br />
500,000<br />
250,000<br />
-<br />
(250,000)<br />
Absorption by Submarket<br />
Average Asking Rate by Submarket<br />
$6.50<br />
$6.00<br />
$5.50<br />
$5.00<br />
$4.50<br />
$4.00<br />
$3.50<br />
$3.00<br />
$5.90<br />
$5.38<br />
$5.69<br />
$4.82<br />
$5.35<br />
(500,000)<br />
<strong>Q2</strong> '15 Q3 '15 Q4 '15 Q1 '16 <strong>Q2</strong> '16<br />
Source: Xceligent<br />
Source: Xceligent<br />
3<br />
<strong>Industrial</strong> <strong>Research</strong> & Forecast <strong>Report</strong> | <strong>2016</strong> Quarter 2 | Wisconsin | Colliers International
Leasing Activity by Number of Deals<br />
1<br />
>100,000<br />
3<br />
3<br />
4<br />
55,000-99,999<br />
45,000-54,999<br />
1<br />
3<br />
7<br />
2<br />
Square Feet<br />
35,000-44,999<br />
25,000-34,999<br />
15,000-24,999<br />
10,000-14,999<br />
2<br />
4<br />
6<br />
6<br />
6<br />
5,000-9,999<br />
10<br />
8<br />
2,500-4,999<br />
6<br />
< 2500<br />
9<br />
Source: Xceligent<br />
Top <strong>Q2</strong> <strong>2016</strong> Leases<br />
BUILDING MARKET TENANT SF LEASED<br />
1<br />
Old Orchard Road<br />
(Hwy 145)<br />
Waukesha Froedert 158,525<br />
2 4143 N 27 th St Milwaukee<br />
Briggs and<br />
Stratton<br />
155,856<br />
5<br />
3<br />
N62 W22632 Village<br />
Dr.<br />
Waukesha<br />
Sharp<br />
Packaging<br />
151,970<br />
Source: Colliers International | Wisconsin <strong>Research</strong>, Xceligent<br />
Top <strong>Q2</strong> <strong>2016</strong> Transactions<br />
4 Zilber <strong>Industrial</strong> I Waukesha<br />
Kreiser &<br />
Staples<br />
63,665<br />
30,000<br />
BUILDING MARKET BUYER SELLER SF SOLD PRICE PSF SALE PRICE<br />
5 Lake View IX Kenosha Exeter Property Group<br />
Centerpoint<br />
Properties Trust<br />
890,972 $52.86 $47,100,000<br />
6<br />
Airport<br />
International<br />
Center<br />
Milwaukee<br />
MLG Capital<br />
First <strong>Industrial</strong><br />
Realty Trust Inc.<br />
340,272 $24.98 $8,500,000<br />
7<br />
RidgeView<br />
Business Center IV<br />
Waukesha<br />
Noble Management,<br />
Inc.<br />
Federal<br />
Manufacturing<br />
77,500 $106.19 $8,229,829<br />
8<br />
CrossLake Airport<br />
<strong>Industrial</strong> Park<br />
Bldg.<br />
Milwaukee<br />
Steiner Group<br />
Colliers<br />
International<br />
172,201 $36.29 $6,250,000<br />
4<br />
<strong>Industrial</strong> <strong>Research</strong> & Forecast <strong>Report</strong> | <strong>2016</strong> Quarter 2 | Wisconsin | Colliers International
Southeastern Wisconsin <strong>Industrial</strong> <strong>Market</strong><br />
<strong>2016</strong> Quarter 2<br />
EXISTING PROPERTIES TOTAL VACANCY NET ABSORPTION - SF NEW SUPPLY - SF UNDER AVG. NNN<br />
BLDG TYPE BLDGS TOTAL SF SF <strong>Q2</strong>-16 <strong>Q2</strong>-15<br />
CURRENT<br />
QUARTER<br />
YTD<br />
CURRENT<br />
QUARTER<br />
YTD<br />
CONST. SF<br />
ASKING<br />
RATE<br />
NORTH MARKET: Ozaukee County and Sheboygan County<br />
FX 83 5,222,191 472,547 9.05% 8.47% -26,000 -26,000 - - - $7.29<br />
LI 207 17,600,298 700,511 3.98% 4.39% - -16,940 - - - $4.51<br />
WH&D 31 3,746,768 5,000 0.13% 1.27% - 40,522 - - - -<br />
Total 321 26,569,257 1,178,058 4.43% 4.75% -26,000 -2,418 - - - $5.90<br />
NORTHWEST MARKET: Washington County<br />
FX 156 6,731,748 271,133 4.03% 5.68% 2,253 152,327 - - - $5.34<br />
LI 130 9,375,158 113,881 1.21% 0.38% -72,200 -72,200 - - - $5.29<br />
WH&D 43 3,602,358 461,632 12.81% 17.35% -10,097 -10,097 - - - $5.50<br />
Total 329 19,709,264 846,646 4.30% 5.30% -80,044 70,030 - - - $5.38<br />
WEST MARKET: Waukesha County<br />
FX 465 16,978,361 500,981 2.95% 3.57% 38,680 304,573 - 159,000 389,700 $6.33<br />
LI 840 37,460,551 771,904 2.06% 2.28% 304,959 451,379 - - - $5.39<br />
WH&D 200 17,252,719 675,734 3.92% 2.78% 194,725 436,382 158,525 373,058 - $5.35<br />
Total 1,505 71,691,631 1,948,619 2.72% 2.70% 538,364 1,192,334 158,525 532,058 389,700 $5.69<br />
CENTRAL MARKET: Milwaukee County<br />
FX 254 12,166,326 610,085 5.01% 4.38% 68,916 95,019 - - 82,500 $5.70<br />
LI 851 52,906,886 2,014,199 3.81% 4.56% 222,518 270,690 - 60,000 - $4.59<br />
WH&D 343 28,955,468 2,086,614 7.21% 8.09% 19,586 -5,914 - - - $4.17<br />
Total 1,448 94,028,680 4,710,898 5.01% 5.63% 311,020 359,795 - 60,000 82,500 $4.82<br />
SOUTH MARKET: Racine County, Kenosha County and Walworth County<br />
FX 69 4,517,092 187,386 4.15% 2.89% 11,323 41,844 - - - $6.38<br />
LI 611 40,533,576 1,411,102 3.48% 2.60% 18,500 -115,585 - - - $5.29<br />
WH&D 86 19,037,914 1,219,215 6.40% 2.69% 75,000 1,271,309 - 600,000 1,504,000 $4.39<br />
Total 766 64,088,582 2,817,703 4.40% 2.65% 104,823 1,197,568 - 600,000 1,504,000 $5.35<br />
GRAND TOTAL<br />
FX 1,027 45,615,718 2,042,132 4.48% 4.60% 95,172 567,763 - 159,000 472,200 $6.09<br />
LI 2,639 157,876,469 5,011,597 3.17% 3.26% 473,777 517,344 - 60,000 - $4.97<br />
WH&D 703 72,595,227 4,448,195 6.13% 5.63% 279,214 1,732,202 158,525 973,058 1,504,000 $4.65<br />
Total 4,369 276,087,414 11,501,924 4.17% 4.09% 848,163 2,817,309 158,525 1,976,200 $5.27<br />
QUARTERLY COMPARISON TOTALS<br />
<strong>2016</strong> <strong>Q2</strong> 4,369 276,087,414 11,501,924 4.17% 848,163 2,817,309 158,525 1,976,200 $5.27<br />
<strong>2016</strong> Q1 4,363 274,620,799 11,261,334 4.10% 2,027,746 2,027,746 520,000 5,221,019 2,217,783 $5.27<br />
2015 Q4 4,354 272,409,762 11,002,427 4.04% 747,268 6,546,248 1,142,400 4,701,019 1,325,862 $5.23<br />
2015 Q3 4,347 271,396,557 10,736,490 3.96% 1,114,406 5,746,628 2,944,557 3,558,619 1,638,843 $5.18<br />
2015 <strong>Q2</strong> 4,342 270,614,737 11,069,076 4.09% 1,183,564 4,632,222 614,062 614,062 1,685,189 $5.23<br />
Source: Colliers International | Wisconsin <strong>Research</strong>, Xceligent<br />
5<br />
<strong>Industrial</strong> <strong>Research</strong> & Forecast <strong>Report</strong> | <strong>2016</strong> Quarter 2 | Wisconsin | Colliers International
554 offices in<br />
66 countries on<br />
6 continents<br />
United States: 153<br />
Canada: 34<br />
Latin America: 24<br />
Asia Pacific: 231<br />
EMEA: 112<br />
<strong>Industrial</strong> Services<br />
Mike Fardy<br />
President<br />
Direct +1 414 278 6806<br />
mike.fardy@colliers.com<br />
Mark Schnoll<br />
Partner<br />
Direct +1 414 278 6833<br />
mark.schnoll@colliers.com<br />
Steve Sewart<br />
Senior Vice President<br />
Direct +1 414 278 6823<br />
steve.sewart@colliers.com<br />
Jim Larkin<br />
Vice President<br />
Direct +1 414 278 6837<br />
jim.larkin@colliers.com<br />
$2.5 billion in annual revenue<br />
2.0 billion sf under management<br />
16,000 professionals and staff<br />
Bill Quinlivan<br />
Partner<br />
Direct +1 414 278 6878<br />
bill.quinlivan@colliers.com<br />
Pat Hake<br />
Associate Broker<br />
Direct +1 414 278 6871<br />
pat.hake@colliers.com<br />
Bill Langhoff, CCIM, SIOR<br />
Senior Vice President<br />
Direct +1 414 278 6863<br />
bill.langhoff@colliers.com<br />
Caitlin Fitzpatrick<br />
Client Services Coordinator<br />
Direct +1 414 278 6868<br />
caitlin.fitzpatrick@colliers.com<br />
<strong>Research</strong><br />
Colliers International | Wisconsin<br />
833 East Michigan Street<br />
Suite 500<br />
Milwaukee, WI 53202<br />
TEL: 414 276 9500<br />
FAX: 414 276 9501<br />
Tyler Jauquet<br />
<strong>Market</strong> Intelligence Analyst<br />
Direct +1 414 278 6811<br />
tyler.jauquet@colliers.com<br />
Margaret Bruckner<br />
<strong>Research</strong> Analyst<br />
Direct +1 414 278 6801<br />
margaret.bruckner@colliers.com<br />
Copyright © <strong>2016</strong> Colliers International.<br />
The information contained herein has been obtained from sources deemed reliable. While<br />
every reasonable effort has been made to ensure its accuracy, we cannot guarantee it. No<br />
responsibility is assumed for any inaccuracies. Readers are encouraged to consult their<br />
professional advisors prior to acting on any of the material contained in this report.