You also want an ePaper? Increase the reach of your titles
YUMPU automatically turns print PDFs into web optimized ePapers that Google loves.
Short Term Outlook for EU arable crops, dairy and meat markets – Summer <strong>2016</strong><br />
February <strong>2016</strong>, still paying the MFN rate but not the<br />
anti-dumping duties.<br />
Over the same period, Brazilian meat exports to the<br />
world market increased by 27% year-on-year, and<br />
therefore continues putting downward pressure on<br />
world prices and increasing competition on the<br />
international poultry market. US poultry exports are<br />
lagging behind (-4%) also due to the strong US dollar.<br />
EU poultry meat imports increased by 6% in the first<br />
four months of <strong>2016</strong>, mainly due to an increase in<br />
imports from Brazil. Thailand, Chile, China and<br />
Ukraine complete the poultry import picture.<br />
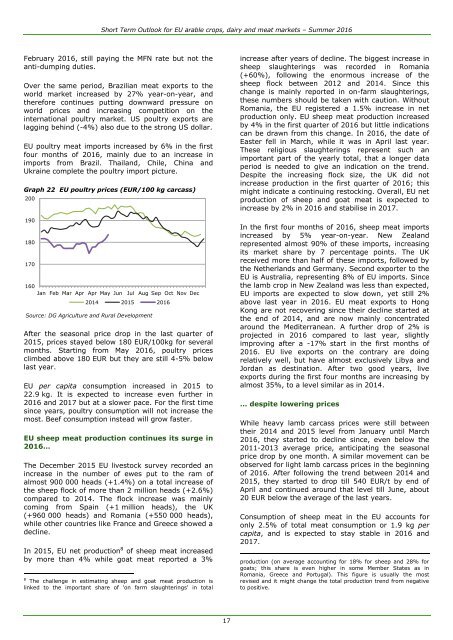
Graph 22 EU poultry prices (EUR/100 kg carcass)<br />
200<br />
190<br />
180<br />
170<br />
160<br />
Jan Feb Mar Apr Apr May Jun Jul Aug Sep Oct Nov Dec<br />
2014 2015 <strong>2016</strong><br />
Source: DG Agriculture and Rural Developm<strong>en</strong>t<br />
After the seasonal price drop in the last quarter of<br />
2015, prices stayed below 180 EUR/100kg for several<br />
months. Starting from May <strong>2016</strong>, poultry prices<br />
climbed above 180 EUR but they are still 4-5% below<br />
last year.<br />
EU per capita consumption increased in 2015 to<br />
22.9 kg. It is expected to increase ev<strong>en</strong> further in<br />
<strong>2016</strong> and 2017 but at a slower pace. For the first time<br />
since years, poultry consumption will not increase the<br />
most. Beef consumption instead will grow faster.<br />
EU sheep meat production continues its surge in<br />
<strong>2016</strong>…<br />
The December 2015 EU livestock survey recorded an<br />
increase in the number of ewes put to the ram of<br />
almost 900 000 heads (+1.4%) on a total increase of<br />
the sheep flock of more than 2 million heads (+2.6%)<br />
compared to 2014. The flock increase was mainly<br />
coming from Spain (+1 million heads), the UK<br />
(+960 000 heads) and Romania (+550 000 heads),<br />
while other countries like France and Greece showed a<br />
decline.<br />
In 2015, EU net production 8 of sheep meat increased<br />
by more than 4% while goat meat reported a 3%<br />
8 The chall<strong>en</strong>ge in estimating sheep and goat meat production is<br />
linked to the important share of 'on farm slaughterings' in total<br />
increase after years of decline. The biggest increase in<br />
sheep slaughterings was recorded in Romania<br />
(+60%), following the <strong>en</strong>ormous increase of the<br />
sheep flock betwe<strong>en</strong> 2012 and 2014. Since this<br />
change is mainly reported in on-farm slaughterings,<br />
these numbers should be tak<strong>en</strong> with caution. Without<br />
Romania, the EU registered a 1.5% increase in net<br />
production only. EU sheep meat production increased<br />
by 4% in the first quarter of <strong>2016</strong> but little indications<br />
can be drawn from this change. In <strong>2016</strong>, the date of<br />
Easter fell in March, while it was in April last year.<br />
These religious slaughterings repres<strong>en</strong>t such an<br />
important part of the yearly total, that a longer data<br />
period is needed to give an indication on the tr<strong>en</strong>d.<br />
Despite the increasing flock size, the UK did not<br />
increase production in the first quarter of <strong>2016</strong>; this<br />
might indicate a continuing restocking. Overall, EU net<br />
production of sheep and goat meat is expected to<br />
increase by 2% in <strong>2016</strong> and stabilise in 2017.<br />
In the first four months of <strong>2016</strong>, sheep meat imports<br />
increased by 5% year-on-year. New Zealand<br />
repres<strong>en</strong>ted almost 90% of these imports, increasing<br />
its market share by 7 perc<strong>en</strong>tage points. The UK<br />
received more than half of these imports, followed by<br />
the Netherlands and Germany. Second exporter to the<br />
EU is Australia, repres<strong>en</strong>ting 8% of EU imports. Since<br />
the lamb crop in New Zealand was less than expected,<br />
EU imports are expected to slow down, yet still 2%<br />
above last year in <strong>2016</strong>. EU meat exports to Hong<br />
Kong are not recovering since their decline started at<br />
the <strong>en</strong>d of 2014, and are now mainly conc<strong>en</strong>trated<br />
around the Mediterranean. A further drop of 2% is<br />
projected in <strong>2016</strong> compared to last year, slightly<br />
improving after a -17% start in the first months of<br />
<strong>2016</strong>. EU live exports on the contrary are doing<br />
relatively well, but have almost exclusively Libya and<br />
Jordan as destination. After two good years, live<br />
exports during the first four months are increasing by<br />
almost 35%, to a level similar as in 2014.<br />
… despite lowering prices<br />
While heavy lamb carcass prices were still betwe<strong>en</strong><br />
their 2014 and 2015 level from January until March<br />
<strong>2016</strong>, they started to decline since, ev<strong>en</strong> below the<br />
2011-2013 average price, anticipating the seasonal<br />
price drop by one month. A similar movem<strong>en</strong>t can be<br />
observed for light lamb carcass prices in the beginning<br />
of <strong>2016</strong>. After following the tr<strong>en</strong>d betwe<strong>en</strong> 2014 and<br />
2015, they started to drop till 540 EUR/t by <strong>en</strong>d of<br />
April and continued around that level till June, about<br />
20 EUR below the average of the last years.<br />
Consumption of sheep meat in the EU accounts for<br />
only 2.5% of total meat consumption or 1.9 kg per<br />
capita, and is expected to stay stable in <strong>2016</strong> and<br />
2017.<br />
production (on average accounting for 18% for sheep and 28% for<br />
goats; this share is ev<strong>en</strong> higher in some Member States as in<br />
Romania, Greece and Portugal). This figure is usually the most<br />
revised and it might change the total production tr<strong>en</strong>d from negative<br />
to positive.<br />
17


