COVER PHOTOGRAPH BY WAYNE PERRYMAN FOTOGRAFÍA EN LA PORTADA POR WAYNE PERRYMAN
FisheryStatusReport14
FisheryStatusReport14

You also want an ePaper? Increase the reach of your titles
YUMPU automatically turns print PDFs into web optimized ePapers that Google loves.
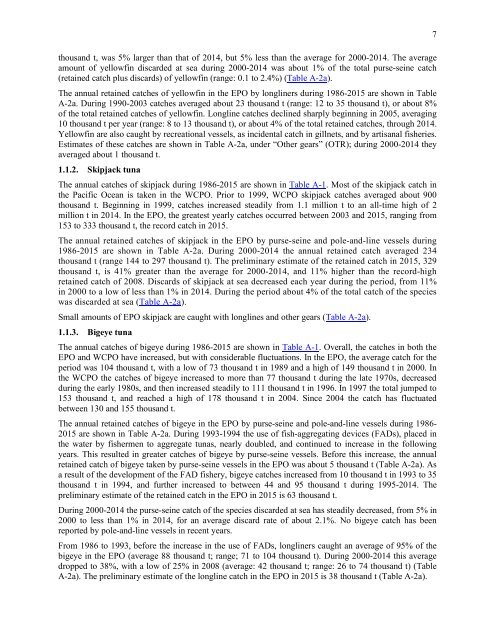
thousand t, was 5% larger than that of 2014, but 5% less than the average for 2000-2014. The average<br />
amount of yellowfin discarded at sea during 2000-2014 was about 1% of the total purse-seine catch<br />
(retained catch plus discards) of yellowfin (range: 0.1 to 2.4%) (Table A-2a).<br />
The annual retained catches of yellowfin in the EPO by longliners during 1986-2015 are shown in Table<br />
A-2a. During 1990-2003 catches averaged about 23 thousand t (range: 12 to 35 thousand t), or about 8%<br />
of the total retained catches of yellowfin. Longline catches declined sharply beginning in 2005, averaging<br />
10 thousand t per year (range: 8 to 13 thousand t), or about 4% of the total retained catches, through 2014.<br />
Yellowfin are also caught by recreational vessels, as incidental catch in gillnets, and by artisanal fisheries.<br />
Estimates of these catches are shown in Table A-2a, under “Other gears” (OTR); during 2000-2014 they<br />
averaged about 1 thousand t.<br />
1.1.2. Skipjack tuna<br />
The annual catches of skipjack during 1986-2015 are shown in Table A-1. Most of the skipjack catch in<br />
the Pacific Ocean is taken in the WCPO. Prior to 1999, WCPO skipjack catches averaged about 900<br />
thousand t. Beginning in 1999, catches increased steadily from 1.1 million t to an all-time high of 2<br />
million t in 2014. In the EPO, the greatest yearly catches occurred between 2003 and 2015, ranging from<br />
153 to 333 thousand t, the record catch in 2015.<br />
The annual retained catches of skipjack in the EPO by purse-seine and pole-and-line vessels during<br />
1986-2015 are shown in Table A-2a. During 2000-2014 the annual retained catch averaged 234<br />
thousand t (range 144 to 297 thousand t). The preliminary estimate of the retained catch in 2015, 329<br />
thousand t, is 41% greater than the average for 2000-2014, and 11% higher than the record-high<br />
retained catch of 2008. Discards of skipjack at sea decreased each year during the period, from 11%<br />
in 2000 to a low of less than 1% in 2014. During the period about 4% of the total catch of the species<br />
was discarded at sea (Table A-2a).<br />
Small amounts of EPO skipjack are caught with longlines and other gears (Table A-2a).<br />
1.1.3. Bigeye tuna<br />
The annual catches of bigeye during 1986-2015 are shown in Table A-1. Overall, the catches in both the<br />
EPO and WCPO have increased, but with considerable fluctuations. In the EPO, the average catch for the<br />
period was 104 thousand t, with a low of 73 thousand t in 1989 and a high of 149 thousand t in 2000. In<br />
the WCPO the catches of bigeye increased to more than 77 thousand t during the late 1970s, decreased<br />
during the early 1980s, and then increased steadily to 111 thousand t in 1996. In 1997 the total jumped to<br />
153 thousand t, and reached a high of 178 thousand t in 2004. Since 2004 the catch has fluctuated<br />
between 130 and 155 thousand t.<br />
The annual retained catches of bigeye in the EPO by purse-seine and pole-and-line vessels during 1986-<br />
2015 are shown in Table A-2a. During 1993-1994 the use of fish-aggregating devices (FADs), placed in<br />
the water by fishermen to aggregate tunas, nearly doubled, and continued to increase in the following<br />
years. This resulted in greater catches of bigeye by purse-seine vessels. Before this increase, the annual<br />
retained catch of bigeye taken by purse-seine vessels in the EPO was about 5 thousand t (Table A-2a). As<br />
a result of the development of the FAD fishery, bigeye catches increased from 10 thousand t in 1993 to 35<br />
thousand t in 1994, and further increased to between 44 and 95 thousand t during 1995-2014. The<br />
preliminary estimate of the retained catch in the EPO in 2015 is 63 thousand t.<br />
During 2000-2014 the purse-seine catch of the species discarded at sea has steadily decreased, from 5% in<br />
2000 to less than 1% in 2014, for an average discard rate of about 2.1%. No bigeye catch has been<br />
reported by pole-and-line vessels in recent years.<br />
From 1986 to 1993, before the increase in the use of FADs, longliners caught an average of 95% of the<br />
bigeye in the EPO (average 88 thousand t; range; 71 to 104 thousand t). During 2000-2014 this average<br />
dropped to 38%, with a low of 25% in 2008 (average: 42 thousand t; range: 26 to 74 thousand t) (Table<br />
A-2a). The preliminary estimate of the longline catch in the EPO in 2015 is 38 thousand t (Table A-2a).<br />
7