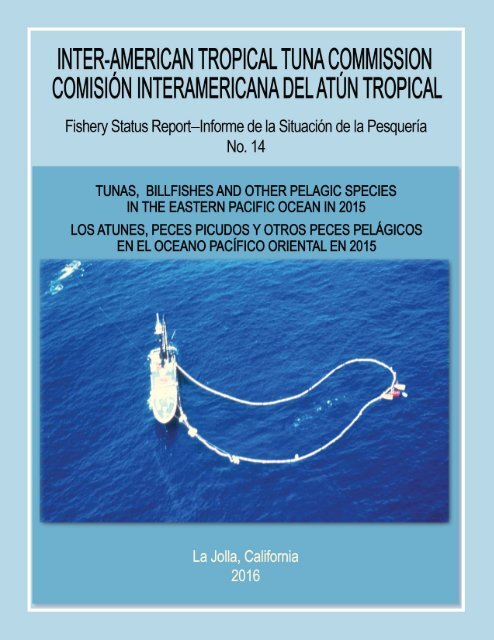
COVER PHOTOGRAPH BY WAYNE PERRYMAN FOTOGRAFÍA EN LA PORTADA POR WAYNE PERRYMAN
FisheryStatusReport14
FisheryStatusReport14

Create successful ePaper yourself
Turn your PDF publications into a flip-book with our unique Google optimized e-Paper software.
<strong>COVER</strong> <strong>PHOTOGRAPH</strong> <strong>BY</strong> <strong>WAYNE</strong> <strong>PERRYMAN</strong><br />
<strong>FOTOGRAFÍA</strong> <strong>EN</strong> <strong>LA</strong> <strong><strong>POR</strong>TADA</strong> <strong>POR</strong> <strong>WAYNE</strong> <strong>PERRYMAN</strong>
INTER-AMERICAN TROPICAL TUNA COMMISSION<br />
COMISIÓN INTERAMERICANA DEL ATÚN TROPICAL<br />
Fishery Status Report—Informe de la Situación de la Pesquería<br />
No. 14<br />
TUNAS, BILLFISHES AND OTHER PE<strong>LA</strong>GIC SPECIES<br />
IN THE EASTERN PACIFIC OCEAN IN 2015<br />
LOS ATUNES, PECES PICUDOS Y OTROS PECES PELÁGICOS<br />
<strong>EN</strong> EL OCÉANO PACÍFICO ORI<strong>EN</strong>TAL <strong>EN</strong> 2015<br />
La Jolla, California<br />
2016
3<br />
TUNAS, BILLFISHES AND OTHER PE<strong>LA</strong>GIC SPECIES IN THE<br />
EASTERN PACIFIC OCEAN IN, 2015<br />
A. The fishery for tunas and billfishes in the eastern Pacific Ocean........................................................ 5<br />
B. Yellowfin tuna .................................................................................................................................. 66<br />
C. Skipjack tuna .................................................................................................................................... 75<br />
D. Bigeye tuna ...................................................................................................................................... 79<br />
E. Pacific bluefin tuna .......................................................................................................................... 89<br />
F. Albacore tuna ................................................................................................................................... 96<br />
G. Swordfish ....................................................................................................................................... 105<br />
H. Blue marlin ..................................................................................................................................... 109<br />
I. Striped marlin ................................................................................................................................. 111<br />
J. Sailfish ........................................................................................................................................... 115<br />
K. Updated stock status indicators for silky sharks in the eastern Pacific Ocean (1994-2015)............ 120<br />
L. Ecosystem Considerations .............................................................................................................. 124<br />
INTRODUCTION<br />
This report provides a summary of the fishery for tunas in the eastern Pacific Ocean (EPO), summary<br />
assessments of the major stocks of tunas and billfishes that are exploited in the fishery, and an evaluation<br />
of the pelagic ecosystem in the EPO, in 2015.<br />
The report is based on data available to the IATTC staff in March 2016. As a result, some of the data<br />
tables for 2015 are incomplete, and all data for 2014 and 2015 should be considered preliminary.<br />
All weights of catches and discards are in metric tons (t). In the tables, 0 means no effort, or a catch of<br />
less than 0.5 t; - means no data collected; * means data missing or not available. The following acronyms<br />
are used:<br />
Species:<br />
ALB Albacore tuna (Thunnus alalunga)<br />
BET Bigeye tuna (Thunnus obesus)<br />
BIL Unidentified istiophorid billfishes<br />
BKJ Black skipjack (Euthynnus lineatus)<br />
BLM Black marlin (Makaira indica)<br />
BUM Blue marlin (Makaira nigricans)<br />
BZX Bonito (Sarda spp.)<br />
CAR Chondrichthyes, cartilaginous fishes nei 1<br />
CGX Carangids (Carangidae)<br />
DOX Dorado (Coryphaena spp.)<br />
MLS Striped marlin (Kajikia audax)<br />
MZZ Osteichthyes, marine fishes nei<br />
PBF Pacific bluefin tuna (Thunnus orientalis)<br />
SFA Indo-Pacific sailfish (Istiophorus<br />
platypterus)<br />
SKJ Skipjack tuna (Katsuwonus pelamis)<br />
SKX Unidentified elasmobranchs<br />
SSP Shortbill spearfish (Tetrapturus<br />
angustirostris)<br />
SWO Swordfish (Xiphias gladius)<br />
TUN Unidentified tunas<br />
YFT Yellowfin tuna (Thunnus albacares)<br />
Fishing gears:<br />
FPN Trap<br />
GN<br />
Gillnet<br />
HAR Harpoon<br />
LL<br />
Longline<br />
LP<br />
Pole and line<br />
LTL Troll<br />
LX<br />
Hook and line<br />
OTR Other 2<br />
NK<br />
Unknown<br />
PS<br />
Purse seine<br />
RG<br />
Recreational<br />
TX<br />
Trawl<br />
1 not elsewhere included<br />
2 Used to group known gear types
4<br />
Ocean areas:<br />
EPO Eastern Pacific Ocean<br />
WCPO Western and Central Pacific<br />
Ocean<br />
Set types:<br />
DEL Dolphin<br />
NOA Unassociated school<br />
OBJ Floating object<br />
LOG: Flotsam<br />
FAD: Fish-aggregating device<br />
Flags:<br />
IATTC Members & cooperating non-Members<br />
BLZ Belize<br />
BOL Bolivia<br />
CAN Canada<br />
CHN China<br />
COL Colombia<br />
CRI<br />
Costa Rica<br />
ECU Ecuador<br />
EU<br />
European Union<br />
EU (CYP) Cyprus<br />
EU (ESP) Spain<br />
EU (PRT) Portugal<br />
FRA France<br />
GTM Guatemala<br />
HND Honduras<br />
IDN<br />
Indonesia<br />
JPN<br />
Japan<br />
KIR<br />
Kiribati<br />
KOR Republic of Korea<br />
LBR Liberia<br />
MEX Mexico<br />
NIC<br />
Nicaragua<br />
PAN Panama<br />
PER<br />
Peru<br />
SLV<br />
El Salvador<br />
TWN Chinese Taipei<br />
USA United States of America<br />
V<strong>EN</strong> Venezuela<br />
VUT Vanuatu<br />
Other flags<br />
CHL Chile<br />
COK Cook Islands<br />
CYM Cayman Islands<br />
NZL New Zealand<br />
RUS Russia<br />
VCT<br />
UNK<br />
St. Vincent and the Grenadines<br />
Unknown<br />
Stock assessment:<br />
B<br />
Biomass<br />
C<br />
Catch<br />
CPUE Catch per unit of effort<br />
F<br />
Rate of fishing mortality<br />
MSY Maximum sustainable yield<br />
S<br />
Index of spawning biomass<br />
SBR Spawning biomass ratio<br />
SSB<br />
Spawning stock biomass
5<br />
A. THE FISHERY FOR TUNAS AND BILLFISHES IN THE EASTERN PACIFIC OCEAN<br />
1. Catches and landings of tunas, billfishes, and associated species ....................................................... 5<br />
1.1. Catches by species .............................................................................................................................. 6<br />
1.2. Distributions of the catches of tunas ................................................................................................... 9<br />
1.3. Size compositions of the catches of tunas .......................................................................................... 9<br />
1.4. Catches of tunas and bonitos, by flag and gear ................................................................................. 11<br />
2. Fishing effort .................................................................................................................................... 12<br />
2.1. Purse seine ....................................................................................................................................... 12<br />
2.2. Longline ........................................................................................................................................... 12<br />
3. The fleets .......................................................................................................................................... 12<br />
3.1. The purse-seine and pole-and-line fleets .......................................................................................... 12<br />
3.2. Other fleets of the EPO .................................................................................................................... 14<br />
This document summarizes the fisheries for species covered by the IATTC Convention (tunas and other<br />
fishes caught by tuna-fishing vessels) in the eastern Pacific Ocean (EPO). The most important of these<br />
are the scombrids (Family Scombridae), which include tunas, bonitos, seerfishes, and mackerels. The<br />
principal species of tunas caught are yellowfin, skipjack, bigeye, and albacore, with lesser catches of<br />
Pacific bluefin, black skipjack, and frigate and bullet tunas; other scombrids, such as bonitos and<br />
wahoo, are also caught.<br />
This document also covers other species caught by tuna-fishing vessels in the EPO: billfishes<br />
(swordfish, marlins, shortbill spearfish, and sailfish) carangids (yellowtail, rainbow runner, and jack<br />
mackerel), dorado, elasmobranchs (sharks, rays, and skates), and other fishes.<br />
Most of the catches are made by the purse-seine and longline fleets; the pole-and-line fleet and various<br />
artisanal and recreational fisheries account for a small percentage of the total catches.<br />
Detailed data are available for the purse-seine and pole-and-line fisheries; the data for the longline,<br />
artisanal, and recreational fisheries are incomplete.<br />
The IATTC Regional Vessel Register contains details of vessels authorized to fish for tunas in the EPO.<br />
The IATTC has detailed records of most of the purse-seine and pole-and-line vessels that fish for<br />
yellowfin, skipjack, bigeye, and/or Pacific bluefin tuna in the EPO. The Register is incomplete for small<br />
vessels. It contains records for most large (overall length >24 m) longline vessels that fish in the EPO and<br />
in other areas.<br />
The data in this report are derived from various sources, including vessel logbooks, observer data, unloading<br />
records provided by canners and other processors, export and import records, reports from governments and<br />
other entities, and estimates derived from the species and size composition sampling program.<br />
1. CATCHES AND <strong>LA</strong>NDINGS OF TUNAS, BILLFISHES, AND ASSOCIATED SPECIES<br />
Estimating the total catch of a species of fish is difficult, for various reasons. Some fish are discarded at<br />
sea, and the data for some gear types are incomplete. Data for fish discarded at sea by purse-seine vessels<br />
with carrying capacities greater than 363 metric tons (t) have been collected by observers since 1993,<br />
which allows for better estimation of the total amounts of fish caught by the purse-seine fleet. Estimates<br />
of the total amount of the catch that is landed (hereafter referred to as the retained catch) are based<br />
principally on data from unloadings. Beginning with Fishery Status Report 3, which reports on the fishery<br />
in 2004, the unloading data for purse-seine and pole-and-line vessels have been adjusted, based on the<br />
species composition estimates for yellowfin, skipjack, and bigeye tunas. The current species composition<br />
sampling program, described in Section 1.3.1, began in 2000, so the catch data for 2000-2015 are<br />
adjusted, based on estimates by flag for each year. The catch data for the previous years were adjusted by<br />
applying the average ratio by species from the 2000-2004 estimates, by flag, and summing over all flags.<br />
This has tended to increase the estimated catches of bigeye and decrease those of yellowfin and/or
6<br />
skipjack. These adjustments are all preliminary, and may be improved in the future. All of the purse-seine<br />
and pole-and-line data for 2014 and 2015 are preliminary.<br />
Data on the retained catches of most of the larger longline vessels are obtained from the governments of<br />
the nations that fish for tunas in the EPO. Longline vessels, particularly the larger ones, direct their effort<br />
primarily at bigeye, yellowfin, albacore, or swordfish. Data from smaller longliners, artisanal vessels, and<br />
other vessels that fish for tunas, billfishes, dorado, and sharks in the EPO were gathered either directly<br />
from the governments, from logbooks, or from reports published by the governments. Data for the<br />
western and central Pacific Ocean (WCPO) were provided by the Ocean Fisheries Programme of the<br />
Secretariat of the Pacific Community (SPC). All data for catches in the EPO by longlines and other gears<br />
for 2014 and 2015 are preliminary.<br />
The data from all of the above sources are compiled in a database by the IATTC staff and summarized<br />
in this report. In recent years, the IATTC staff has increased its effort toward compiling data on the<br />
catches of tunas, billfishes, and other species caught by other gear types, such as trollers, harpooners,<br />
gillnetters, and recreational vessels. The estimated total catches from all sources mentioned above of<br />
yellowfin, skipjack, and bigeye in the entire Pacific Ocean are shown in Table A-1, and are discussed<br />
further in the sections below.<br />
Estimates of the annual retained and discarded catches of tunas and other species taken by tuna-fishing<br />
vessels in the EPO during 1986-2015 are shown in Tables A-2a-c. The catches of yellowfin, skipjack, and<br />
bigeye tunas by flag, during 1986-2015, are shown in Tables A-3a-e, and the purse-seine and pole-andline<br />
catches of tunas and bonitos during 2014-2015 are summarized by flag in Table A-4a. Purse-seine<br />
tuna by country of landing for 2014 and 2015 are summarized in Table A-4b. The country of landing is<br />
that in which the fish were unloaded or, in the case of transshipments, the country that received the<br />
transshipped fish. It is important to note that, when final information is available, the landings currently<br />
assigned to various countries may change due to exports from storage facilities to processors in other<br />
nations. There were no restrictions on fishing for tunas in the EPO during 1988-1997, but the catches of<br />
most species have been affected by restrictions on fishing during some or all of the last six months of<br />
1998-2015. Furthermore, regulations placed on purse-seine vessels directing their effort at tunas<br />
associated with dolphins have affected the way these vessels operate, especially since the late 1980s, as<br />
discussed in Section 3.<br />
The catches have also been affected by climate perturbations, such as the major El Niño events that<br />
occurred during 1982-1983 and 1997-1998. These events made the fish less vulnerable to capture by<br />
purse seiners due to the greater depth of the thermocline, but had no apparent effect on the longline<br />
catches. Yellowfin recruitment tends to be greater after an El Niño event.<br />
1.1. Catches by species<br />
1.1.1. Yellowfin tuna<br />
The annual catches of yellowfin during 1986-2015 are shown in Table A-1. The EPO totals for 1993-<br />
2015 include discards from purse-seine vessels with carrying capacities greater than 363 t. The El Niño<br />
event of 1982-1983 led to a reduction in the catches in those years, whereas the catches in the WCPO<br />
were apparently not affected. Although the El Niño episode of 1997-1998 was greater in scope, it did not<br />
have the same effect on the yellowfin catches in the EPO. In the EPO, catches increased steadily to a high<br />
of 443 thousand t in 2002; they decreased substantially in 2004, reaching their lowest level during 2006-<br />
2008, at only 44% of the highest catches of the 2001-2003 period. The 2015 catch of 246 thousand t is<br />
greater than the average for the previous 5-year period (234 thousand t). In the WCPO, the catches of<br />
yellowfin reached a new high of 611 thousand t in 2014, surpassing the previous record of 600 thousand t<br />
in 2008.<br />
The annual retained catches of yellowfin in the EPO by purse-seine and pole-and-line vessels during<br />
1986-2015 are shown in Table A-2a. The average annual retained catch during 2000-2014 was 257<br />
thousand t (range: 167 to 413 thousand t). The preliminary estimate of the retained catch in 2015, 245
thousand t, was 5% larger than that of 2014, but 5% less than the average for 2000-2014. The average<br />
amount of yellowfin discarded at sea during 2000-2014 was about 1% of the total purse-seine catch<br />
(retained catch plus discards) of yellowfin (range: 0.1 to 2.4%) (Table A-2a).<br />
The annual retained catches of yellowfin in the EPO by longliners during 1986-2015 are shown in Table<br />
A-2a. During 1990-2003 catches averaged about 23 thousand t (range: 12 to 35 thousand t), or about 8%<br />
of the total retained catches of yellowfin. Longline catches declined sharply beginning in 2005, averaging<br />
10 thousand t per year (range: 8 to 13 thousand t), or about 4% of the total retained catches, through 2014.<br />
Yellowfin are also caught by recreational vessels, as incidental catch in gillnets, and by artisanal fisheries.<br />
Estimates of these catches are shown in Table A-2a, under “Other gears” (OTR); during 2000-2014 they<br />
averaged about 1 thousand t.<br />
1.1.2. Skipjack tuna<br />
The annual catches of skipjack during 1986-2015 are shown in Table A-1. Most of the skipjack catch in<br />
the Pacific Ocean is taken in the WCPO. Prior to 1999, WCPO skipjack catches averaged about 900<br />
thousand t. Beginning in 1999, catches increased steadily from 1.1 million t to an all-time high of 2<br />
million t in 2014. In the EPO, the greatest yearly catches occurred between 2003 and 2015, ranging from<br />
153 to 333 thousand t, the record catch in 2015.<br />
The annual retained catches of skipjack in the EPO by purse-seine and pole-and-line vessels during<br />
1986-2015 are shown in Table A-2a. During 2000-2014 the annual retained catch averaged 234<br />
thousand t (range 144 to 297 thousand t). The preliminary estimate of the retained catch in 2015, 329<br />
thousand t, is 41% greater than the average for 2000-2014, and 11% higher than the record-high<br />
retained catch of 2008. Discards of skipjack at sea decreased each year during the period, from 11%<br />
in 2000 to a low of less than 1% in 2014. During the period about 4% of the total catch of the species<br />
was discarded at sea (Table A-2a).<br />
Small amounts of EPO skipjack are caught with longlines and other gears (Table A-2a).<br />
1.1.3. Bigeye tuna<br />
The annual catches of bigeye during 1986-2015 are shown in Table A-1. Overall, the catches in both the<br />
EPO and WCPO have increased, but with considerable fluctuations. In the EPO, the average catch for the<br />
period was 104 thousand t, with a low of 73 thousand t in 1989 and a high of 149 thousand t in 2000. In<br />
the WCPO the catches of bigeye increased to more than 77 thousand t during the late 1970s, decreased<br />
during the early 1980s, and then increased steadily to 111 thousand t in 1996. In 1997 the total jumped to<br />
153 thousand t, and reached a high of 178 thousand t in 2004. Since 2004 the catch has fluctuated<br />
between 130 and 155 thousand t.<br />
The annual retained catches of bigeye in the EPO by purse-seine and pole-and-line vessels during 1986-<br />
2015 are shown in Table A-2a. During 1993-1994 the use of fish-aggregating devices (FADs), placed in<br />
the water by fishermen to aggregate tunas, nearly doubled, and continued to increase in the following<br />
years. This resulted in greater catches of bigeye by purse-seine vessels. Before this increase, the annual<br />
retained catch of bigeye taken by purse-seine vessels in the EPO was about 5 thousand t (Table A-2a). As<br />
a result of the development of the FAD fishery, bigeye catches increased from 10 thousand t in 1993 to 35<br />
thousand t in 1994, and further increased to between 44 and 95 thousand t during 1995-2014. The<br />
preliminary estimate of the retained catch in the EPO in 2015 is 63 thousand t.<br />
During 2000-2014 the purse-seine catch of the species discarded at sea has steadily decreased, from 5% in<br />
2000 to less than 1% in 2014, for an average discard rate of about 2.1%. No bigeye catch has been<br />
reported by pole-and-line vessels in recent years.<br />
From 1986 to 1993, before the increase in the use of FADs, longliners caught an average of 95% of the<br />
bigeye in the EPO (average 88 thousand t; range; 71 to 104 thousand t). During 2000-2014 this average<br />
dropped to 38%, with a low of 25% in 2008 (average: 42 thousand t; range: 26 to 74 thousand t) (Table<br />
A-2a). The preliminary estimate of the longline catch in the EPO in 2015 is 38 thousand t (Table A-2a).<br />
7
8<br />
Small amounts of bigeye are caught in the EPO by other gears, as shown in Table A-2a.<br />
1.1.4. Bluefin tuna<br />
The catches of Pacific bluefin in the EPO during 1986-2015, by gear, are shown in Table A-2a. Purseseine<br />
and pole-and-line vessels accounted for over 94% of the total EPO retained catch during 2000-2014.<br />
During this period the annual retained catch of bluefin in the EPO by purse-seine vessels averaged 4.7<br />
thousand t (range 1.2 to 9.9 thousand t). The preliminary estimate of the retained purse-seine catch of<br />
bluefin in 2015, 3.2 thousand t, is less than the average for 2000-2014 (Table A-2a).<br />
The catches of Pacific bluefin in the entire Pacific Ocean, by flag and gear, are shown in Table A-5a. The<br />
data, which were obtained from the International Scientific Committee for Tuna and Tuna-like Species in<br />
the North Pacific Ocean (ISC), are reported by fishing nation or entity, regardless of the area of the<br />
Pacific Ocean in which the fish were caught.<br />
Catches of Pacific bluefin by recreational gear in the EPO are reported in numbers of individual tuna<br />
caught, whereas all other gears report catch in weight (metric tons). These numbers are then converted to<br />
metric tons for inclusion in the EPO catch totals for all gears. The original catch data for 1986-2015, in<br />
numbers of fish, are presented in Table A-5b.<br />
1.1.5. Albacore tuna<br />
The catches of albacore in the EPO, by gear and area (north and south of the equator) are shown in Tables<br />
A-6. The catches of albacore in the EPO, by gear, are shown in Table A-2a. A significant portion of the<br />
albacore catch is taken by troll gear, included under “Other gears” (OTR) in Table A-2a.<br />
1.1.6. Other tunas and tuna-like species<br />
While yellowfin, skipjack, and bigeye tunas comprise the most significant portion of the retained catches<br />
of the purse-seine and pole-and-line fleets in the EPO, other tunas and tuna-like species, such as black<br />
skipjack, bonito, wahoo, and frigate and bullet tunas, contribute to the overall harvest in this area. The<br />
estimated annual retained and discarded catches of these species during 1986-2015 are presented in Table<br />
A-2a. The catches reported in the “unidentified tunas” category (TUN) in Table A-2a contain some<br />
catches reported by species (frigate or bullet tunas) along with the unidentified tunas. The total retained<br />
catch of these other species by these fisheries was 4.7 thousand t in 2015, which is less than the 2000-<br />
2014 average retained catch of 6.8 thousand t (range: 500 to 19 thousand t).<br />
Black skipjack are also caught by other gears in the EPO, mostly by coastal artisanal fisheries. Bonitos<br />
are also caught by artisanal fisheries, and have been reported as catch by longline vessels in some years.<br />
1.1.7. Billfishes<br />
Catch data for billfishes (swordfish, blue marlin, black marlin, striped marlin, shortbill spearfish, and<br />
sailfish) are shown in Table A-2b.<br />
In general, dolphins, sea turtles, whale sharks, and small fish are the only animals captured in the purseseine<br />
fishery that are released alive. In previous versions of this report, all billfishes caught in that fishery<br />
were classified as discarded dead. When most of the individuals of species caught incidentally are<br />
discarded, the difference between catches and discards is not significant for those species, but as the rate<br />
of retention of species formerly discarded increases, part of the bycatch becomes catch, and the<br />
distinction becomes important. As a result of a review in 2010, this has been clarified in Table A-2b with<br />
the addition of a column for retained catch next to the column for discards.<br />
Swordfish are caught in the EPO with large-scale and artisanal longline gear, gillnets, harpoons, and<br />
occasionally with recreational gear. During 1999-2008 the longline catch of swordfish averaged 12<br />
thousand t, but during 2012-2014 the average almost doubled to over 22 thousand t. It is not clear whether<br />
this is due to increased abundance of swordfish or increased effort directed toward that species.<br />
Other billfishes are caught with large-scale and artisanal longline gear and recreational gear. The average
annual longline catches of blue marlin and striped marlin during 2000-2014 were about 3.2 thousand and<br />
1.9 thousand t, respectively. Smaller amounts of other billfishes are taken by longline.<br />
Unfortunately, little information is available on the recreational catches of billfishes, but they are believed<br />
to be substantially less than the commercial catches for all species.<br />
Small amounts of billfishes are caught by purse seiners, some are retained, and others are considered to be<br />
discarded although some may be landed but not reported. These data are also included in Table A-2b.<br />
During 2000-2014 purse seiners accounted about 1% of the total catch of billfishes in the EPO.<br />
1.1.8. Other species<br />
Data on the catches and discards of carangids (yellowtail, rainbow runner, and jack mackerel), dorado,<br />
elasmobranchs (sharks, rays, and skates), and other fishes caught in the EPO are shown in Table A-2c.<br />
Bycatches in the purse-seine fishery are reported in Table A-2c as either retained or discarded. A revision was<br />
made to the allocation of catches into those categories as a result of a review in 2010.<br />
Dorado are unloaded mainly in ports in Central and South America. Although the reported catches have<br />
been as high as 71 thousand t in recent years, the fishing gears used are often not reported.<br />
1.2. Distributions of the catches of tunas<br />
1.2.1. Purse-seine catches<br />
The average annual distributions of the purse-seine catches of yellowfin, skipjack, and bigeye, by set<br />
type, in the EPO during 2010-2014, are shown in Figures A-1a, A-2a, and A-3a, and preliminary<br />
estimates for 2015 are shown in Figures A-1b, A-2b, and A-3b.<br />
The majority of the yellowfin catches in 2015 were taken north of the 5°N latitude in sets associated with<br />
dolphins, and in the area between Galapagos and the coast of the Americas in all three types of sets.<br />
Though yellowfin in unassociated schools is typically found closer to shore, moderate catches were found<br />
far offshore around the 135°W longitude south of the equator. As in previous years, most of the yellowfin<br />
south of the 5°N latitude was caught in sets on floating objects.<br />
Most of the skipjack catches in 2015 occurred south of the 5°N latitude, in sets on floating objects and<br />
inshore unassociated school sets. The area off the coast of Peru produced the greatest 2015 skipjack<br />
catches, which were higher than that of previous years. A larger than normal offshore catch of skipjack<br />
was found around the 135°W longitude south of the equator in unassociated tuna sets.<br />
Bigeye are not often caught north of about 7°N, and the catches of bigeye have decreased in the inshore<br />
areas off South America for several years. With the development of the fishery for tunas associated<br />
with FADs, the relative importance of the inshore areas has decreased, while that of the offshore areas<br />
has increased. Most of the bigeye catches are taken in sets on FADs between 5°N and 5°S.<br />
1.2.2. Longline catches<br />
Data on the spatial and temporal distributions of the catches in the EPO by the distant-water longline<br />
fleets of China, French Polynesia, Japan, the Republic of Korea, Spain, Chinese Taipei, the United<br />
States, and Vanuatu are maintained in databases of the IATTC. Bigeye and yellowfin tunas make up the<br />
majority of the catches by most of these vessels. The distributions of the catches of bigeye and<br />
yellowfin tunas in the Pacific Ocean by Chinese, Japanese, Korean, and Chinese Taipei longline vessels<br />
during 2010-2014 are shown in Figure A-4. Data for the Japanese longline fishery in the EPO during<br />
1956-2007 are available in IATTC Bulletins describing that fishery.<br />
1.3. Size compositions of the catches of tunas<br />
1.3.1. Purse-seine, pole-and-line, and recreational fisheries<br />
Length-frequency samples are the basic source of data used for estimating the size and age compositions<br />
9
10<br />
of the various species of fish in the landings. This information is necessary to obtain age-structured<br />
estimates of the populations for various purposes, including the integrated modeling that the staff has<br />
employed during the last several years. The results of such studies have been described in several IATTC<br />
Bulletins, in its Annual Reports for 1954-2002, and in its Stock Assessment Reports.<br />
Length-frequency samples of yellowfin, skipjack, bigeye, Pacific bluefin, and, occasionally, black<br />
skipjack from the catches of purse-seine, pole-and-line, and recreational vessels in the EPO are collected<br />
by IATTC personnel at ports of landing in Ecuador, Mexico, Panama, the USA, and Venezuela. The<br />
catches of yellowfin and skipjack were first sampled in 1954, bluefin in 1973, and bigeye in 1975.<br />
Sampling has continued to the present.<br />
The methods for sampling the catches of tunas are described in the IATTC Annual Report for 2000 and<br />
in IATTC Stock Assessment Reports 2 and 4. Briefly, the fish in a well of a purse-seine or pole-and-line<br />
vessel are selected for sampling only if all the fish in the well were caught during the same calendar<br />
month, in the same type of set (floating-object, unassociated school, or dolphin), and in the same<br />
sampling area. These data are then categorized by fishery (Figure A-5), based on the staff’s most recent<br />
stock assessments.<br />
Data for fish caught during the 2010-2015 period are presented in this report. Two sets of lengthfrequency<br />
histograms are presented for each species, except bluefin and black skipjack; the first shows the<br />
data by stratum (gear type, set type, and area) for 2015, and the second shows the combined data for each<br />
year of the 2010-2015 period. For bluefin, the histograms show the 2007-2012 catches by commercial and<br />
recreational gear combined. For black skipjack, the histograms show the 2010-2015 catches by<br />
commercial gear. Only a small amount of catch was taken by pole-and-line vessels in 2013, 2014 and<br />
2015, and no samples were obtained from these vessels.<br />
For stock assessments of yellowfin, nine purse-seine fisheries (four associated with floating objects, three<br />
associated with dolphins, and two unassociated) and one pole-and-line fishery are defined (Figure A-5).<br />
The last fishery includes all 13 sampling areas. Of the 958 wells sampled during 2015, 686 contained<br />
yellowfin. The estimated size compositions of the fish caught are shown in Figure A-6a. The majority of<br />
the yellowfin catch was taken in sets associated with dolphins in the Northern and Inshore dolphin<br />
fisheries, primarily in the second quarter. Most of the larger yellowfin (>110 cm) were caught in the<br />
Northern and Inshore dolphin fisheries in the second and third quarters, and in the Southern unassociated<br />
fishery in the fourth quarter. Smaller yellowfin (
last three fisheries include all 13 sampling areas. Of the<br />
958 wells sampled, 209 contained bigeye. The<br />
estimated size compositions of the fish caught during<br />
2015 are shown in Figure A-8a. Smaller bigeye in the<br />
40- to 80-cm size range was taken primarily in the<br />
Northern floating-object fishery during the second<br />
quarter, and in the Southern floating-object fishery in<br />
the fourth quarter. Larger bigeye (>100 cm) were<br />
caught primarily in the Southern floating-object fishery<br />
in the fourth quarter.<br />
The estimated size compositions of bigeye caught by all<br />
fisheries combined during 2010-2015 are shown<br />
in Figure A-8b. The average weight of bigeye in 2015<br />
(4.7 kg) was the lowest for the 6 year period, much less<br />
than the high of 8.0 kg in 2011.<br />
Pacific bluefin are caught by purse-seine and<br />
recreational gear off California and Baja California<br />
from about 23°N to 35°N, with most of the catch being<br />
taken during May through October. During 2012<br />
bluefin were caught between 28°N and 32°N from June<br />
through August. The majority of the catches of bluefin<br />
by both commercial and recreational vessels were taken<br />
during July and August. Prior to 2004, the sizes of the<br />
fish in the commercial and recreational catches have<br />
been reported separately. During 2004-2012, however,<br />
small sample sizes made it infeasible to estimate the<br />
Figure 1. Purse-seine catches of tunas, by<br />
species and set type, 2000-2015<br />
size compositions separately. Therefore, the sizes of the fish in the commercial and recreational catches of<br />
bluefin were combined for each year of the 2004-2012 period. The average weight of the fish caught<br />
during 2012 (14.2 kg) was less than that of 2011 (15.4 kg), but very close to the average weights in 2009<br />
and 2010. The estimated size compositions are shown in Figure A-9. Prior to 2013, IATTC staff collected<br />
length-frequency samples from recreational vessels with landings in San Diego and from purse seiners.<br />
Beginning in 2013, sampling of recreational vessels was taken over by the U.S. National Marine Fisheries<br />
Service (NMFS). Very few samples were collected from commercial purse-seiners in 2013, 2014 and<br />
2015. The size composition estimates for bluefin will be updated after development of a methodology that<br />
will incorporate the changes in sampling.<br />
Black skipjack are caught incidentally by fishermen who direct their effort toward yellowfin, skipjack,<br />
and bigeye tuna. The demand for this species is low, so most of the catches are discarded at sea, but small<br />
amounts, mixed with the more desirable species, are sometimes retained. The estimated size compositions<br />
for each year of the 2010-2015 period are shown in Figure A-10.<br />
1.3.2. Longline fishery<br />
The estimated size compositions of the catches of yellowfin and bigeye by the Japanese longline fishery<br />
in the EPO during 2010-2014 are shown in Figures A-11 and A-12. The average weight of yellowfin in<br />
2014 (62.7 kg) was greater than the previous 4 years (44.7 to 62.1 kg). The average weight of bigeye in<br />
2014 was consistent with the previous four years at 56.3 kg. Information on the size compositions of fish<br />
caught by the Japanese longline fishery in the EPO during 1958-2008 is available in IATTC Bulletins<br />
describing that fishery.<br />
1.4. Catches of tunas and bonitos, by flag and gear<br />
The annual retained catches of tunas and bonitos in the EPO during 1986-2015 by flag and gear, are<br />
11
12<br />
shown in Tables A-3a-e. These tables include all of the known catches of tunas and bonitos compiled<br />
from various sources, including vessel logbooks, observer data, unloading records provided by canners<br />
and other processors, export and import records, estimates derived from the species and size composition<br />
sampling program, reports from governments and other entities, and estimates derived from the speciesand<br />
size-composition sampling program. Similar information on tunas and bonitos prior to 2001, and<br />
historical data for tunas, billfishes, sharks, carangids, dorado, and miscellaneous fishes are available on<br />
the IATTC website. The purse-seine catches of tunas and bonitos in 2014 and 2015, by flag, are<br />
summarized in Table A-4. Of the 646 thousand t of tunas and bonitos caught in 2015, 47% were caught<br />
by Ecuadorian vessels, and 21% by Mexican vessels. Other countries with significant catches of tunas and<br />
bonitos in the EPO included Panama (10 %), Venezuela (6%), Colombia (6%) and United States (4%).<br />
2. FISHING EFFORT<br />
2.1. Purse seine<br />
Estimates of the numbers of purse-seine sets of each type (associated with dolphins, associated with<br />
floating objects, and unassociated) in the EPO during the 2000-2015 period, and the retained catches of<br />
these sets, are shown in Table A-7 and in Figure 1. The estimates for vessels ≤363 t carrying capacity<br />
were calculated from logbook data in the IATTC statistical data base, and those for vessels >363 t<br />
carrying capacity were calculated from the observer data bases of the IATTC, Colombia, Ecuador, the<br />
European Union, Mexico, Nicaragua, Panama, the United States, and Venezuela. The greatest numbers of<br />
sets associated with floating objects and unassociated sets were made from the mid-1970s to the early<br />
1980s. Despite opposition to fishing for tunas associated with dolphins and the refusal of U.S. canners to<br />
accept tunas caught during trips during which sets were made on dolphin-associated fish, the numbers of<br />
sets associated with dolphins decreased only moderately during the mid-1990s, and in 2003 were the<br />
greatest recorded.<br />
There are two types of floating objects, flotsam and fish-aggregating devices (FADs). The occurrence of<br />
the former is unplanned from the point of view of the fishermen, whereas the latter are constructed by<br />
fishermen specifically for the purpose of attracting fish. The use of FADs increased sharply in 1994, with<br />
the percentage of FADs almost doubling from the previous year, to almost 69% of all floating-object sets.<br />
Their relative importance has continued to increase since then, reaching 97% of all floating-object sets by<br />
vessels with >363 t carrying capacity in recent years, as shown in Table A-8.<br />
2.2. Longline<br />
The reported nominal fishing effort (in thousands of hooks) by longline vessels in the EPO, and their<br />
catches of the predominant tuna species, are shown in Table A-9.<br />
3. THE FLEETS<br />
3.1. The purse-seine and pole-and-line fleets<br />
The IATTC staff maintains detailed records of gear, flag, and fish-carrying capacity for most of the<br />
vessels that fish with purse-seine or pole-and-line gear for yellowfin, skipjack, bigeye, and/or Pacific<br />
bluefin tuna in the EPO. The fleet described here includes purse-seine and pole-and-line vessels that have<br />
fished all or part of the year in the EPO for any of these four species.<br />
Historically, the owner's or builder's estimates of carrying capacities of individual vessels, in tons of fish,<br />
were used until landing records indicated that revision of these estimates was required.<br />
Since 2000, the IATTC has used well volume, in cubic meters (m 3 ), instead of weight, in metric tons (t),<br />
to measure the carrying capacities of the vessels. Since a well can be loaded with different densities of<br />
fish, measuring carrying capacity in weight is subjective, as a load of fish packed into a well at a higher<br />
density weighs more than a load of fish packed at a lower density. Using volume as a measure of capacity<br />
eliminates this problem.<br />
The IATTC staff began collecting capacity data by volume in 1999, but has not yet obtained this
information for all vessels. For<br />
vessels for which reliable<br />
information on well volume is not<br />
available, the estimated capacity in<br />
metric tons was converted to cubic<br />
meters.<br />
Until about 1960, fishing for<br />
tunas in the EPO was dominated<br />
by pole-and-line vessels operating<br />
in coastal regions and in the<br />
vicinity of offshore islands and<br />
banks. During the late 1950s and<br />
early 1960s most of the larger<br />
pole-and-line vessels were<br />
converted to purse seiners, and by<br />
1961 the EPO fishery was<br />
dominated by these vessels. From<br />
1961 to 2015 the number of poleand-line<br />
vessels decreased from<br />
Figure 2. Carrying capacity, in cubic meters of well volume, of the<br />
purse-seine and pole-and-line fleets in the EPO, 1961-2015<br />
93 to 1, and their total well volume from about 11 thousand to about 125 m 3 . During the same period the<br />
number of purse-seine vessels increased from 125 to 243, and their total well volume from about 32<br />
thousand to about 248 thousand m 3 , an average of about 1,021 m 3 per vessel. An earlier peak in numbers<br />
and total well volume of purse seiners occurred from the mid-1970s to the early 1980s, when the number<br />
of vessels reached 282 and the total<br />
well volume about 195 thousand m 3 ,<br />
an average of about 700 m 3 per vessel<br />
(Table A-10; Figure 2).<br />
The catch rates in the EPO were low<br />
during 1978-1981, due to<br />
concentration of fishing effort on<br />
small fish, and the situation was<br />
exacerbated by a major El Niño event,<br />
which began in mid-1982 and<br />
persisted until late 1983 and made the<br />
fish less vulnerable to capture. The<br />
total well volume of purse-seine and<br />
pole-and-line vessels then declined as<br />
vessels were deactivated or left the<br />
EPO to fish in other areas, primarily<br />
Figure 3. Cumulative capacity of the purse-seine and poleand-line<br />
fleet at sea, by month, 2010-2015<br />
the western Pacific Ocean, and in 1984 it reached its lowest level since 1971, about 119 thousand m 3 . In<br />
early 1990 the U.S. tuna-canning industry adopted a policy of not purchasing tunas caught during trips<br />
during which sets on tunas associated with dolphins were made. This caused many U.S.-flag vessels to<br />
leave the EPO, with a consequent reduction in the fleet to about 117 thousand m 3 in 1992. With increases<br />
in participation of vessels of other nations in the fishery, the total well volume has increased steadily since<br />
1992, and in 2015 was 248 thousand m 3 .<br />
The 2014 and preliminary 2015 data for numbers and total well volumes of purse-seine and pole-and-line<br />
vessels that fished for tunas in the EPO are shown in Tables A-11a and A-11b. During 2015, the fleet was<br />
dominated by vessels operating under the Ecuadorian and Mexican flags, with about 37% and 23%,<br />
respectively, of the total well volume; they were followed by Venezuela (8%), Panama (8%), United<br />
States (7%), Colombia (6%), European Union (Spain) (4%), Nicaragua (3% ), El Salvador (2%), and<br />
13
14<br />
Guatemala and Peru (1% each). The sum of the percentages may not add up to 100% due to rounding.<br />
The cumulative capacity at sea during 2015 is compared to those of the previous five years in Figure 3.<br />
The monthly average, minimum, and maximum total well volumes at sea (VAS), in thousands of cubic<br />
meters, of purse-seine and pole-and-line vessels that fished for tunas in the EPO during 2005-2014, and<br />
the 2015 values, are shown in Table A-12. The monthly values are averages of the VAS estimated at<br />
weekly intervals by the IATTC staff. The fishery was regulated during some or all of the last four months<br />
of 2000-2015, so the VAS values for September-December 2015 are not comparable to the average VAS<br />
values for those months of 2000-2015. The average VAS values for 2005-2014 and 2015 were 136<br />
thousand m 3 (62% of total capacity) and 145 thousand m 3 (58% of total capacity), respectively.<br />
3.2. Other fleets of the EPO<br />
Information on other types of vessels that fish for tunas in the EPO is available in the IATTC’s Regional<br />
Vessel Register, on the IATTC website. The Register is incomplete for small vessels. In some cases,<br />
particularly for large longline vessels, the Register contains information for vessels authorized to fish<br />
not only in the EPO, but also in other oceans, and which may not have fished in the EPO during<br />
2015, or ever.
15<br />
FIGURE A-1a. Average annual distributions of the purse-seine catches of yellowfin, by set type, 2010-<br />
2014. The sizes of the circles are proportional to the amounts of yellowfin caught in those 5° by 5° areas.<br />
FIGURA A-1a. Distribución media anual de las capturas cerqueras de aleta amarilla, por tipo de lance,<br />
2010-2014. El tamaño de cada círculo es proporcional a la cantidad de aleta amarilla capturado en la<br />
cuadrícula de 5° x 5° correspondiente.<br />
FIGURE A-1b. Annual distributions of the purse-seine catches of yellowfin, by set type, 2015. The sizes<br />
of the circles are proportional to the amounts of yellowfin caught in those 5° by 5° areas.<br />
FIGURA A-1b. Distribución anual de las capturas cerqueras de aleta amarilla, por tipo de lance, 2015. El<br />
tamaño de cada círculo es proporcional a la cantidad de aleta amarilla capturado en la cuadrícula de 5° x<br />
5° correspondiente.
16<br />
FIGURE A-2a. Average annual distributions of the purse-seine catches of skipjack, by set type, 2010-<br />
2014. The sizes of the circles are proportional to the amounts of skipjack caught in those 5° by 5° areas.<br />
FIGURA A-2a. Distribución media anual de las capturas cerqueras de barrilete, por tipo de lance, 2010-<br />
2014. El tamaño de cada círculo es proporcional a la cantidad de barrilete capturado en la cuadrícula de 5°<br />
x 5° correspondiente.<br />
FIGURE A-2b. Annual distributions of the purse-seine catches of skipjack, by set type, 2015. The sizes<br />
of the circles are proportional to the amounts of skipjack caught in those 5° by 5° areas.<br />
FIGURA A-2b. Distribución anual de las capturas cerqueras de barrilete, por tipo de lance, 2015. El<br />
tamaño de cada círculo es proporcional a la cantidad de barrilete capturado en la cuadrícula de 5° x 5°<br />
correspondiente.
17<br />
FIGURE A-3a. Average annual distributions of the purse-seine catches of bigeye, by set type, 2010-<br />
2014. The sizes of the circles are proportional to the amounts of bigeye caught in those 5° by 5° areas.<br />
FIGURA A-3a. Distribución media anual de las capturas cerqueras de patudo, por tipo de lance, 2010-<br />
2014. El tamaño de cada círculo es proporcional a la cantidad de patudo capturado en la cuadrícula de 5°<br />
x 5° correspondiente.<br />
FIGURE A-3b. Annual distributions of the purse-seine catches of bigeye, by set type, 2015. The sizes of<br />
the circles are proportional to the amounts of bigeye caught in those 5° by 5° areas.<br />
FIGURA A-3b. Distribución anual de las capturas cerqueras de patudo, por tipo de lance, 2015. El<br />
tamaño de cada círculo es proporcional a la cantidad de patudo capturado en la cuadrícula de 5° x 5°<br />
correspondiente.
18<br />
FIGURE A-4. Distributions of the average annual catches of bigeye and yellowfin tunas in the<br />
Pacific Ocean, in metric tons, by Chinese, Japanese, Korean, and Chinese Taipei longline vessels,<br />
2010-2014. The sizes of the circles are proportional to the amounts of bigeye and yellowfin caught in<br />
those 5° by 5° areas.<br />
FIGURA A-4. Distribución de las capturas anuales medias de atunes patudo y aleta amarilla en el<br />
Océano Pacifico, en toneladas métricas, por buques palangreros de China, Corea, Japón, y Taipei Chino,<br />
2010-2014. El tamaño de cada círculo es proporcional a la cantidad de patudo y aleta amarilla capturado<br />
en la cuadrícula de 5° x 5° correspondiente.
FIGURE A-5. The fisheries defined by the IATTC staff for stock assessment of yellowfin, skipjack, and<br />
bigeye in the EPO. The thin lines indicate the boundaries of the 13 length-frequency sampling areas, and<br />
the bold lines the boundaries of the fisheries.<br />
FIGURA A-5. Las pesquerías definidas por el personal de la CIAT para la evaluación de las poblaciones<br />
de atún aleta amarilla, barrilete, y patudo en el OPO. Las líneas delgadas indican los límites de las 13<br />
zonas de muestreo de frecuencia de tallas, y las líneas gruesas los límites de las pesquerías.<br />
19
20<br />
FIGURE A-6a. Estimated size compositions of the yellowfin caught in the EPO during 2015 for each<br />
fishery designated in Figure A-5. The average weights of the fish in the samples are given at the tops of<br />
the panels.<br />
FIGURA A-6a. Composición por tallas estimada del aleta amarilla capturado en el OPO durante 2015 en<br />
cada pesquería ilustrada en la Figura A-5. En cada recuadro se detalla el peso promedio de los peces en<br />
las muestras.
FIGURE A-6b. Estimated size compositions of the yellowfin caught by purse-seine and pole-and-line<br />
vessels in the EPO during 2010-2015. The average weights of the fish in the samples are given at the tops<br />
of the panels.<br />
FIGURA A-6b. Composición por tallas estimada del aleta amarilla capturado por buques cerqueros y<br />
cañeros en el OPO durante 2010-2015. En cada recuadro se detalla el peso promedio de los peces en las<br />
muestras.<br />
21
22<br />
FIGURE A-7a. Estimated size compositions of the skipjack caught in the EPO during 2015 for each<br />
fishery designated in Figure A-5. The average weights of the fish in the samples are given at the tops of<br />
the panels.<br />
FIGURA A-7a. Composición por tallas estimada del barrilete capturado en el OPO durante 2015 en cada<br />
pesquería ilustrada en la Figura A-5. En cada recuadro se detalla el peso promedio de los peces en las<br />
muestras.
FIGURE A-7b. Estimated size compositions of the skipjack caught by purse-seine and pole-and-line<br />
vessels in the EPO during 2010-2015. The average weights of the fish in the samples are given at the tops<br />
of the panels.<br />
FIGURA A-7b. Composición por tallas estimada del barrilete capturado por buques cerqueros y cañeros<br />
en el OPO durante 2010-2015. En cada recuadro se detalla el peso promedio de los peces en las muestras.<br />
23
24<br />
FIGURE A-8a. Estimated size compositions of the bigeye caught in the EPO during 2015 for each<br />
fishery designated in Figure A-5. The average weights of the fish in the samples are given at the tops of<br />
the panels.<br />
FIGURA A-8a. Composición por tallas estimada del patudo capturado e en el OPO durante 2015 en cada<br />
pesquería ilustrada en la Figura A-5. En cada recuadro se detalla el peso promedio de los peces en las<br />
muestras.
FIGURE A-8b. Estimated size compositions of the bigeye caught by purse-seine vessels in the EPO<br />
during 2010-2015. The average weights of the fish in the samples are given at the tops of the panels.<br />
FIGURA A-8b. Composición por tallas estimada del patudo capturado por buques cerqueros en el OPO<br />
durante 2010-2015. En cada recuadro se detalla el peso promedio de los peces en las muestras.<br />
25
26<br />
FIGURE A-9. Estimated catches of Pacific bluefin by purse-seine and recreational gear in the EPO<br />
during 2007-2012. The values at the tops of the panels are the average weights.<br />
FIGURA A-9. Captura estimada de aleta azul del Pacífico con arte de cerco y deportiva en el OPO<br />
durante 2007-2012. El valor en cada recuadro representa el peso promedio.
FIGURE A-10. Preliminary size compositions of the catches of black skipjack by purse-seine vessels in<br />
the EPO during 2010-2015. The values at the tops of the panels are the average weights.<br />
FIGURA A-10. Composición por tallas preliminar del barrilete negro capturado por buques cerqueros en<br />
el OPO durante 2010-2015. El valor en cada recuadro representa el peso promedio.<br />
27
28<br />
FIGURE A-11. Estimated size compositions of the catches of yellowfin tuna by the Japanese longline<br />
fishery in the EPO, 2010-2014.<br />
FIGURA A-11. Composición por tallas estimada de las capturas de atún aleta amarilla por la pesquería<br />
palangrera japonesa en el OPO, 2010-2014.<br />
FIGURE A-12. Estimated size compositions of the catches of bigeye tuna by the Japanese longline<br />
fishery in the EPO, 2010-2014.<br />
FIGURA A-12. Composición por tallas estimada de las capturas de atún patudo por la pesquería palangrera<br />
japonesa en el OPO, 2010-2014.
29<br />
TABLE A-1. Annual catches of yellowfin, skipjack, and bigeye tunas, by all types of gear combined,<br />
in the Pacific Ocean. The EPO totals for 1993-2015 include discards from purse-seine vessels with<br />
carrying capacities greater than 363 t. *: data missing or not available; -: no data collected; C: data<br />
combined with those of other flags; this category is used to avoid revealing the operations of<br />
individual vessels or companies.<br />
TAB<strong>LA</strong> A-1. Capturas anuales de atunes aleta amarilla, barrilete, y patudo, por todas las artes<br />
combinadas, en el Océano Pacífico. Los totales del OPO de 1993-2015 incluyen los descartes de buques<br />
cerqueros de más de 363 t de capacidad de acarreo. *: datos faltantes o no disponibles; -: datos no tomados;<br />
C: datos combinados con aquéllos de otras banderas; se usa esta categoría para no revelar información sobre<br />
las actividades de buques o empresas individuales.<br />
YFT SKJ BET Total<br />
EPO WCPO Total EPO WCPO Total EPO WCPO Total EPO WCPO Total<br />
1986 286,071 261,924 547,995 67,745 724,313 792,058 105,185 84,521 189,706 459,001 1,070,758 1,529,759<br />
1987 286,164 309,133 595,297 66,466 668,025 734,491 101,347 100,805 202,152 453,977 1,077,963 1,531,940<br />
1988 296,428 305,338 601,766 92,127 805,563 897,690 74,313 92,590 166,903 462,868 1,203,491 1,666,359<br />
1989 299,436 353,660 653,096 98,921 781,360 880,281 72,994 99,281 172,275 471,351 1,234,301 1,705,652<br />
1990 301,522 393,720 695,242 77,107 854,147 931,254 104,851 115,998 220,849 483,480 1,363,865 1,847,345<br />
1991 265,970 420,683 686,653 65,890 1,073,169 1,139,059 109,121 99,510 208,631 440,981 1,593,362 2,034,343<br />
1992 252,514 428,646 681,160 87,294 968,767 1,056,061 92,000 118,445 210,445 431,808 1,515,858 1,947,666<br />
1993 256,199 369,497 625,696 100,434 923,772 1,024,206 82,843 102,713 185,556 439,476 1,395,982 1,835,458<br />
1994 248,071 409,241 657,312 84,661 987,223 1,071,884 109,331 116,890 226,221 442,063 1,513,354 1,955,417<br />
1995 244,639 405,168 649,807 150,661 1,019,647 1,170,308 108,210 105,853 214,063 503,510 1,530,668 2,034,178<br />
1996 266,928 408,246 675,174 132,335 1,017,270 1,149,605 114,706 110,547 225,253 513,969 1,536,063 2,050,032<br />
1997 277,575 495,043 772,618 188,285 909,915 1,098,200 122,274 152,836 275,110 588,134 1,557,794 2,145,928<br />
1998 280,606 596,550 877,156 165,489 1,174,372 1,339,861 93,954 165,622 259,576 540,049 1,936,544 2,476,593<br />
1999 304,638 509,888 814,526 291,249 1,053,848 1,345,097 93,078 147,512 240,590 688,965 1,711,248 2,400,213<br />
2000 286,865 557,523 844,388 230,480 1,164,767 1,395,247 148,557 132,005 280,562 665,902 1,854,295 2,520,197<br />
2001 425,008 522,700 947,708 157,676 1,089,463 1,247,139 130,546 133,607 264,153 713,230 1,745,770 2,459,000<br />
2002 443,458 478,462 921,920 167,048 1,265,455 1,432,503 132,806 155,888 288,694 743,312 1,899,805 2,643,117<br />
2003 415,933 534,295 950,228 300,470 1,260,323 1,560,793 115,175 127,306 242,481 831,578 1,921,924 2,753,502<br />
2004 296,847 571,444 868,291 217,249 1,357,963 1,575,212 110,722 177,973 288,695 624,818 2,107,380 2,732,198<br />
2005 286,492 542,796 829,288 283,453 1,404,304 1,687,757 110,514 140,907 251,421 680,459 2,088,007 2,768,466<br />
2006 180,519 473,940 654,459 309,090 1,502,445 1,811,535 117,328 151,544 268,872 606,937 2,127,929 2,734,866<br />
2007 182,141 506,961 689,102 216,324 1,654,655 1,870,979 94,260 137,070 231,330 492,725 2,298,686 2,791,411<br />
2008 197,328 599,881 797,209 307,699 1,627,984 1,935,683 103,350 145,279 248,629 608,377 2,373,144 2,981,521<br />
2009 250,413 534,257 784,670 239,408 1,792,632 2,032,040 109,255 144,552 253,807 599,076 2,471,441 3,070,517<br />
2010 261,871 552,896 814,767 153,092 1,694,169 1,847,261 95,408 130,110 225,518 510,371 2,377,175 2,887,546<br />
2011 216,720 515,378 732,098 283,509 1,539,530 1,823,039 89,460 153,329 242,789 589,689 2,208,237 2,797,926<br />
2012 213,310 585,831 799,141 273,519 1,771,848 2,045,367 102,687 154,391 257,078 589,516 2,512,070 3,101,586<br />
2013 231,803 547,990 779,793 284,043 1,830,821 2,114,864 86,063 142,492 228,555 601,909 2,521,303 3,123,212<br />
2014 246,512 611,307 857,819 265,644 1,972,512 2,238,156 95,809 155,370 251,179 607,965 2,739,189 3,347,154<br />
2015 246,380 * 246,380 333,456 * 333,456 101,652 * 101,652 681,488 * 681,488
30<br />
TABLE A-2a. Estimated retained catches (Ret.), by gear type, and estimated discards (Dis.), by purse-seine<br />
vessels with carrying capacities greater than 363 t only, of tunas and bonitos, in metric tons, in the EPO. The purseseine<br />
and pole-and-line data for yellowfin, skipjack, and bigeye tunas have been adjusted to the species<br />
composition estimate and are preliminary. The data for 2014-2015 are preliminary. *: data missing or not<br />
available; -: no data collected; C: data combined with those of other flags; this category is used to avoid<br />
revealing the operations of individual vessels or companies.<br />
TAB<strong>LA</strong> A-2a. Estimaciones de las capturas retenidas (Ret.), por arte de pesca, y de los descartes (Dis.), por buques<br />
cerqueros de más de 363 t de capacidad de acarreo únicamente, de atunes y bonitos, en toneladas métricas, en el<br />
OPO. Los datos de los atunes aleta amarilla, barrilete, y patudo de las pesquerías cerquera y cañera fueron ajustados a<br />
la estimación de composición por especie, y son preliminares. Los datos de 2014-2015 son preliminares. *: datos<br />
faltantes o no disponibles; -: datos no tomados; C: datos combinados con aquéllos de otras banderas; se usa esta<br />
categoría para no revelar información sobre las actividades de buques o empresas individuales.<br />
Yellowfin—Aleta amarilla Skipjack—Barrilete Bigeye—Patudo<br />
PS<br />
OTR<br />
PS<br />
OTR<br />
PS<br />
OTR<br />
Ret. Dis.<br />
LP LL + Total<br />
LP LL + Total<br />
LP LL + Total<br />
Ret. Dis. Ret. Dis.<br />
NK<br />
NK<br />
NK<br />
1986 260,512 - 2,537 22,808 214 286,071 65,634 - 1,921 58 132 67,745 2,686 - - 102,425 74 105,185<br />
1987 262,008 - 5,107 18,911 138 286,164 64,019 - 2,233 37 177 66,466 1,177 - - 100,121 49 101,347<br />
1988 277,293 - 3,723 14,660 752 296,428 87,113 - 4,325 26 663 92,127 1,535 - 5 72,758 15 74,313<br />
1989 277,996 - 4,145 17,032 263 299,436 94,934 - 2,940 28 1,019 98,921 2,030 - - 70,963 1 72,994<br />
1990 263,253 - 2,676 34,633 960 301,522 74,369 - 823 41 1,874 77,107 5,921 - - 98,871 59 104,851<br />
1991 231,257 - 2,856 30,899 958 265,970 62,228 - 1,717 36 1,909 65,890 4,870 - 31 104,195 25 109,121<br />
1992 228,121 - 3,789 18,646 1,958 252,514 84,283 - 1,957 24 1,030 87,294 7,179 - - 84,808 13 92,000<br />
1993 219,492 4,713 4,951 24,009 3,034 256,199 83,830 10,515 3,772 61 2,256 100,434 9,657 653 - 72,498 35 82,843<br />
1994 208,408 4,525 3,625 30,026 1,487 248,071 70,126 10,491 3,240 73 731 84,661 34,899 2,266 - 71,360 806 109,331<br />
1995 215,434 5,275 1,268 20,596 2,066 244,639 127,047 16,373 5,253 77 1,911 150,661 45,321 3,251 - 58,269 1,369 108,210<br />
1996 238,607 6,312 3,762 16,608 1,639 266,928 103,973 24,494 2,555 52 1,261 132,335 61,311 5,689 - 46,958 748 114,706<br />
1997 244,878 5,516 4,418 22,163 600 277,575 153,456 31,338 3,260 135 96 188,285 64,272 5,402 - 52,580 20 122,274<br />
1998 253,959 4,697 5,085 15,336 1,529 280,606 140,631 22,643 1,684 294 237 165,489 44,129 2,822 - 46,375 628 93,954<br />
1999 281,920 6,547 1,783 11,682 2,706 304,638 261,565 26,046 2,044 201 1,393 291,249 51,158 4,932 - 36,450 538 93,078<br />
2000 253,263 6,207 2,431 23,855 1,109 286,865 205,647 24,468 231 68 66 230,480 95,282 5,417 - 47,605 253 148,557<br />
2001 383,936 7,028 3,916 29,608 520 425,008 143,165 12,815 448 1,214 34 157,676 60,518 1,254 - 68,755 19 130,546<br />
2002 412,286 4,140 950 25,531 551 443,458 153,546 12,506 616 261 119 167,048 57,421 949 - 74,424 12 132,806<br />
2003 383,279 5,865 470 25,174 1,145 415,933 273,968 22,453 638 634 2,777 300,470 53,052 2,326 - 59,776 21 115,175<br />
2004 272,557 3,000 1,884 18,779 627 296,847 197,824 17,078 528 713 1,106 217,249 65,471 1,574 - 43,483 194 110,722<br />
2005 268,101 2,771 1,822 11,946 1,852 286,492 263,229 16,915 1,299 231 1,779 283,453 67,895 1,900 - 40,694 25 110,514<br />
2006 166,631 1,534 686 10,210 1,458 180,519 296,268 11,177 435 224 986 309,090 83,838 1,680 - 31,770 40 117,328<br />
2007 170,016 1,725 894 8,067 1,439 182,141 208,295 6,450 276 238 1,065 216,324 63,450 890 - 29,876 44 94,260<br />
2008 185,057 696 814 9,820 941 197,328 296,603 8,249 499 1,185 1,163 307,699 75,028 2,086 - 26,208 28 103,350<br />
2009 236,757 1,262 709 10,444 1,241 250,413 230,523 6,064 151 1,584 1,086 239,408 76,799 1,019 - 31,422 15 109,255<br />
2010 251,009 1,031 460 8,339 1,032 261,871 147,192 2,769 47 1,815 1,269 153,092 57,752 564 - 37,090 2 95,408<br />
2011 206,851 415 276 8,048 1,130 216,720 276,035 5,215 24 1,384 851 283,509 56,512 631 - 32,317 - 89,460<br />
2012 198,017 451 400 12,954 1,488 213,310 266,215 3,511 303 2,381 1,109 273,519 66,020 473 - 36,167 27 102,687<br />
2013 218,187 207 759 11,416 1,234 231,803 278,560 2,254 164 2,024 1,041 284,043 49,487 273 - 36,204 99 86,063<br />
2014 233,973 517 C 8,522 3,500 246,512 261,578 2,596 C 239 1,231 265,644 60,453 83 - 35,096 177 95,809<br />
2015 245,183 334 C * 863 246,380 329,280 3,699 C * 477 333,456 63,229 177 - 38,245 1 101,652
31<br />
TABLE A-2a. (continued)<br />
TAB<strong>LA</strong> A-2a. (continuación)<br />
Pacific bluefin—Aleta azul del Pacífico Albacore—Albacora Black skipjack—Barrilete negro<br />
PS<br />
OTR<br />
PS<br />
OTR<br />
PS<br />
LP LL + Total<br />
LP LL<br />
Total<br />
Ret. Dis. + NK<br />
NK<br />
Ret. Dis. Ret. Dis.<br />
1986 5,040 - - 1 64 5,105 47 - 86 6,450 4,701 11,284 569 - - - 18 587<br />
1987 980 - - 3 88 1,071 1 - 320 9,994 2,662 12,977 571 - - - 2 573<br />
1988 1,379 - - 2 52 1,433 17 - 271 9,934 5,549 15,771 956 - - - 311 1,267<br />
1989 1,103 - 5 4 91 1,203 1 - 21 6,784 2,695 9,501 803 - - - - 803<br />
1990 1,430 - 61 12 103 1,606 39 - 170 6,536 4,105 10,850 787 - - - 4 791<br />
1991 419 - - 5 55 479 - - 834 7,893 2,754 11,481 421 - - - 25 446<br />
1992 1,928 - - 21 147 2,096 - - 255 17,080 5,740 23,075 105 - - 3 - 108<br />
1993 580 - - 11 316 907 - - 1 11,194 4,410 15,605 104 3,925 - 31 - 4,060<br />
1994 969 - - 12 116 1,097 - - 85 10,390 10,154 20,629 188 857 - 40 - 1,085<br />
1995 659 - - 25 264 948 - - 465 6,185 7,427 14,077 202 1,448 - - - 1,650<br />
1996 8,333 - - 19 83 8,435 11 - 72 7,631 8,398 16,112 704 2,304 - 12 - 3,020<br />
1997 2,608 3 2 14 235 2,862 1 - 59 9,678 7,540 17,278 100 2,512 - 11 - 2,623<br />
1998 1,772 - - 95 516 2,383 42 - 81 12,635 13,158 25,916 489 1,876 39 - - 2,404<br />
1999 2,553 54 5 151 514 3,277 47 - 227 11,633 14,510 26,417 171 3,404 - - - 3,575<br />
2000 3,712 - 61 46 349 4,168 71 - 86 9,663 13,453 23,273 294 1,995 - - - 2,289<br />
2001 1,155 3 1 148 378 1,685 3 - 157 19,410 13,727 33,297 2,258 1,019 - - - 3,277<br />
2002 1,758 1 3 71 620 2,453 31 - 381 15,289 14,433 30,134 1,459 2,283 8 - - 3,750<br />
2003 3,233 - 3 87 369 3,692 34 - 59 24,901 20,397 45,391 433 1,535 6 13 117 2,104<br />
2004 8,880 19 - 15 59 8,973 105 - 126 18,444 22,011 40,686 884 387 - 27 862 2,160<br />
2005 4,743 15 - - 80 4,838 2 - 66 9,350 15,679 25,097 1,472 2,124 - - 22 3,618<br />
2006 9,928 - - - 93 10,021 109 - 1 13,831 18,980 32,921 1,999 1,972 - - - 3,971<br />
2007 4,189 - - - 14 4,203 187 - 21 11,107 19,261 30,576 2,307 1,625 - 2 54 3,988<br />
2008 4,392 14 15 - 63 4,484 49 - 1,050 9,218 16,553 26,870 3,624 2,251 - - 8 5,883<br />
2009 3,428 24 - - 161 3,613 50 2 C 12,072 19,090 31,214 4,256 1,020 - 2 - 5,278<br />
2010 7,746 - - 3 89 7,838 25 - C 14,256 19,333 33,614 3,425 1,079 - 8 184 4,696<br />
2011 2,829 4 - 1 244 3,078 10 - C 16,191 16,105 32,306 2,317 719 - 6 - 3,042<br />
2012 6,705 - - 1 405 7,111 - - C 24,198 18,100 42,298 4,504 440 - 5 7 4,956<br />
2013 3,154 - - 1 819 3,974 - - C 25,368 18,514 43,882 3,580 805 - 10 24 4,419<br />
2014 5,263 66 - - 403 5,732 - - C 28,874 19,556 48,430 4,153 486 - 11 81 4,731<br />
2015 3,168 - - - 14 3,182 - - * * * * 3,793 356 - - 36 4,185<br />
LP<br />
LL<br />
OTR<br />
+<br />
NK<br />
Total
32<br />
TABLE A-2a. (continued)<br />
TAB<strong>LA</strong> A-2a. (continuación)<br />
Unidentified tunas—<br />
Bonitos<br />
Atunes no identificados<br />
PS<br />
OTR<br />
LP LL<br />
+ NK Total PS<br />
OTR<br />
LP LL<br />
+ NK Total PS<br />
Ret. Dis. Ret. Dis. Ret. Dis.<br />
1986 232 - 258 - 1,889 2,379 177 - 4 - 986 1,167 334,897 - 4,806 131,742 8,078 479,523<br />
1987 3,195 - 121 - 1,782 5,098 481 - - - 2,043 2,524 332,432 - 7,781 129,066 6,941 476,220<br />
1988 8,811 - 739 - 947 10,497 79 - - - 2,939 3,018 377,183 - 9,063 97,380 11,228 494,854<br />
1989 11,278 - 818 - 465 12,561 36 - - - 626 662 388,181 - 7,929 94,811 5,160 496,081<br />
1990 13,641 - 215 - 371 14,227 200 - - 3 692 895 359,640 - 3,945 140,096 8,168 511,849<br />
1991 1,207 - 82 - 242 1,531 4 - - 29 192 225 300,406 - 5,520 143,057 6,160 455,143<br />
1992 977 - - - 318 1,295 24 - - 27 1,071 1,122 322,617 - 6,001 120,609 10,277 459,504<br />
1993 599 12 1 - 436 1,048 9 1,975 - 10 4,082 6,076 314,271 21,793 8,725 107,814 14,569 467,172<br />
1994 8,331 147 362 - 185 9,025 9 498 - 1 464 972 322,930 18,784 7,312 111,902 13,943 474,871<br />
1995 7,929 55 81 - 54 8,119 11 626 - - 1,004 1,641 396,603 27,028 7,067 85,152 14,095 529,945<br />
1996 647 1 7 - 16 671 37 1,028 - - 1,038 2,103 413,623 39,828 6,396 71,280 13,183 544,310<br />
1997 1,097 4 8 - 34 1,143 71 3,383 - 7 1,437 4,898 466,483 48,158 7,747 84,588 9,962 616,938<br />
1998 1,330 4 7 - 588 1,929 13 1,233 - 24 18,158 19,428 442,365 33,275 6,896 74,759 34,814 592,109<br />
1999 1,719 - - 24 369 2,112 27 3,092 - 2,113 4,279 9,511 599,160 44,075 4,059 62,254 24,309 733,857<br />
2000 636 - - 75 56 767 190 1,410 - 1,992 1,468 5,060 559,095 39,497 2,809 83,304 16,754 701,459<br />
2001 17 - - 34 19 70 191 679 - 2,448 55 3,373 591,243 22,798 4,522 121,617 14,752 754,932<br />
2002 - - - - 1 1 576 1,863 - 482 1,422 4,343 627,077 21,742 1,958 116,058 17,158 783,993<br />
2003 - - 1 - 25 26 80 1,238 - 215 750 2,283 714,079 33,417 1,177 110,800 25,601 885,074<br />
2004 15 35 1 8 3 62 256 973 - 349 258 1,836 545,992 23,066 2,539 81,818 25,120 678,535<br />
2005 313 18 - - 11 342 190 1,922 - 363 427 2,902 605,945 25,665 3,187 62,584 19,875 717,256<br />
2006 3,507 80 12 - 3 3,602 50 1,910 - 29 193 2,182 562,330 18,353 1,134 56,064 21,753 659,634<br />
2007 15,906 628 107 2 - 16,643 598 1,221 - 2,197 301 4,317 464,948 12,539 1,298 51,489 22,178 552,452<br />
2008 7,874 37 9 6 26 7,952 136 1,380 1 727 883 3,127 572,763 14,713 2,388 47,164 19,665 656,693<br />
2009 9,720 15 - 8 77 9,820 162 469 - 1,933 74 2,638 561,695 9,875 860 57,465 21,744 651,639<br />
2010 2,820 19 4 2 70 2,915 136 709 - 1,770 36 2,651 470,105 6,171 511 63,283 22,015 562,085<br />
2011 7,969 45 18 10 11 8,053 108 784 - 3,178 - 4,070 552,631 7,813 318 61,135 18,341 640,238<br />
2012 8,191 156 - 1 64 8,412 41 354 - 196 221 812 549,693 5,385 703 75,903 21,421 653,105<br />
2013 2,067 9 - 13 27 2,116 53 461 - - 529 1,043 555,088 4,009 923 75,036 22,287 657,343<br />
2014 2,821 38 - - 154 3,013 113 328 - 269 392 1,102 568,354 4,114 - 73,011 25,494 670,973<br />
2015 789 28 - * - 817 81 242 - * 1,073 1,396 645,523 4,836 - 38,245 2,464 691,068<br />
LP<br />
Total<br />
LL<br />
OTR<br />
+ NK<br />
Total
33<br />
TABLE A-2b. Estimated retained catches, by gear type, and estimated discards, by purse-seine vessels with<br />
carrying capacities greater than 363 t only, of billfishes, in metric tons, in the EPO. Data for 2014-2015 are<br />
preliminary. PS dis. = discards by purse-seine vessels. . *: data missing or not available; -: no data collected; C:<br />
data combined with those of other flags; this category is used to avoid revealing the operations of individual<br />
vessels or companies.<br />
TAB<strong>LA</strong> A-2b. Estimaciones de las capturas retenidas, por arte de pesca, y de los descartes, por buques<br />
cerqueros de más de 363 t de capacidad de acarreo únicamente, de peces picudos, en toneladas métricas, en el<br />
OPO. Los datos de 2014-2015 son preliminares. PS dis. = descartes por buques cerqueros. *: datos faltantes o no<br />
disponibles; -: datos no tomados; C: datos combinados con aquéllos de otras banderas; se usa esta categoría para<br />
no revelar información sobre las actividades de buques o empresas individuales.<br />
Swordfish—Pez espada Blue marlin—Marlín azul Black marlin—Marlín negro<br />
Striped marlin—<br />
Marlín rayado<br />
PS<br />
PS<br />
PS<br />
PS<br />
LL OTR Total<br />
LL OTR Total<br />
LL OTR Total<br />
Ret. Dis. Ret. Dis. Ret. Dis. Ret. Dis.<br />
LL OTR Total<br />
1986 - - 3,286 3,294 6,580 - - 5,278 - 5,278 - - 297 - 297 - - 3,540 - 3,540<br />
1987 - - 4,676 3,740 8,416 - - 7,282 - 7,282 - - 358 - 358 - - 7,647 - 7,647<br />
1988 - - 4,916 5,642 10,558 - - 5,663 - 5,663 - - 288 - 288 - - 5,283 - 5,283<br />
1989 - - 5,202 6,072 11,274 - - 5,392 - 5,392 - - 193 - 193 - - 3,473 - 3,473<br />
1990 - - 5,807 5,066 10,873 - - 5,540 - 5,540 - - 223 - 223 - - 3,260 333 3,593<br />
1991 - 17 10,671 4,307 14,995 - 69 6,719 - 6,788 - 58 246 - 304 - 76 2,993 409 3,478<br />
1992 - 4 9,820 4,267 14,091 - 52 6,626 - 6,678 - 95 228 - 323 - 69 3,054 239 3,362<br />
1993 3 1 6,187 4,414 10,605 84 20 6,571 - 6,675 57 31 218 - 306 47 20 3,575 259 3,901<br />
1994 1 - 4,990 3,822 8,813 69 15 9,027 - 9,111 39 23 256 - 318 20 9 3,396 257 3,682<br />
1995 3 - 4,495 2,974 7,472 70 16 7,288 - 7,374 43 23 158 - 224 18 8 3,249 296 3,571<br />
1996 1 - 7,071 2,486 9,558 62 15 3,596 - 3,673 46 24 100 - 170 20 9 3,218 430 3,677<br />
1997 2 1 10,580 1,781 12,364 126 15 5,915 - 6,056 71 22 154 - 247 28 3 4,473 329 4,833<br />
1998 3 - 9,800 3,246 13,049 130 20 4,856 - 5,006 72 28 168 - 268 20 3 3,558 509 4,090<br />
1999 2 - 7,569 1,965 9,536 181 38 3,691 - 3,910 83 42 94 - 219 26 11 2,621 376 3,034<br />
2000 3 - 8,930 2,383 11,316 120 23 3,634 - 3,777 67 21 105 - 193 17 3 1,889 404 2,313<br />
2001 3 1 16,007 1,964 17,975 119 40 4,196 - 4,355 67 48 123 - 238 13 8 1,961 342 2,324<br />
2002 1 - 17,598 2,119 19,718 188 33 3,480 - 3,701 86 30 78 - 194 69 5 2,158 412 2,644<br />
2003 3 1 18,161 354 18,519 185 21 4,015 - 4,221 121 26 73 - 220 31 4 1,904 417 2,356<br />
2004 2 - 15,372 309 15,683 140 21 3,783 - 3,944 62 5 41 - 108 23 1 1,547 390 1,961<br />
2005 2 - 8,935 4,304 13,241 209 14 3,350 - 3,573 95 9 39 - 143 37 4 1,531 553 2,125<br />
2006 7 - 9,890 3,800 13,697 164 21 2,934 105 3,224 124 21 77 - 222 54 3 1,735 490 2,282<br />
2007 4 - 9,639 4,390 14,033 124 13 2,393 106 2,636 74 8 47 - 129 32 4 1,656 1,024 2,716<br />
2008 6 - 12,248 3,071 15,325 125 8 1,705 114 1,952 76 9 100 - 185 33 2 1,291 1,045 2,371<br />
2009 4 - 15,539 3,905 19,448 159 15 2,102 131 2,407 76 8 94 - 178 23 2 1,333 7 1,365<br />
2010 4 - 18,396 4,480 22,880 176 12 2,920 126 3,234 62 9 160 - 231 21 2 2,129 9 2,161<br />
2011 3 - 20,400 5,101 25,504 150 6 2,025 144 2,325 59 7 187 - 253 28 1 2,640 16 2,685<br />
2012 5 - 23,587 7,148 30,740 178 15 3,723 177 4,093 71 4 444 - 519 28 - 2,703 20 2,751<br />
2013 2 - 22,989 5,560 28,551 172 15 4,202 168 4,557 99 4 138 - 241 21 1 2,439 19 2,480<br />
2014 4 - 20,519 6,368 26,891 209 12 4,061 186 4,468 71 4 153 - 228 23 1 1,926 2 1,952<br />
2015 5 - * 191 196 307 11 * * 318 117 14 * - 131 26 9 * * 35
34<br />
TABLE A-2b. (continued)<br />
TAB<strong>LA</strong> A-2b. (continuación)<br />
Shortbill spearfish—<br />
Marlín trompa corta<br />
Sailfish—<br />
Pez vela<br />
Unidentified istiophorid<br />
billfishes—Picudos<br />
istiofóridos no identificados<br />
PS<br />
Total billfishes—<br />
Total de peces picudos<br />
PS<br />
PS<br />
PS<br />
LL OTR Total<br />
LL OTR Total<br />
LL OTR Total<br />
LL OTR Total<br />
Ret. Dis. Ret. Dis. Ret. Dis. Ret. Dis.<br />
1986 - - 5 - 5 - - 583 - 583 - - 1 - 1 - - 12,990 3,294 16,284<br />
1987 - - 15 - 15 - - 649 - 649 - - 398 - 398 - - 21,025 3,740 24,765<br />
1988 - - 13 - 13 - - 649 - 649 - - 368 - 368 - - 17,180 5,642 22,822<br />
1989 - - - - - - - 192 - 192 - - 51 - 51 - - 14,503 6,072 20,575<br />
1990 - - - - - - - 6 - 6 - - 125 - 125 - - 14,961 5,399 20,360<br />
1991 - - 1 - 1 - - 717 - 717 - - 112 - 112 - 220 21,459 4,716 26,395<br />
1992 - 1 1 - 2 - - 1,351 - 1,351 - - 1,123 - 1,123 - 221 22,203 4,506 26,930<br />
1993 - - 1 - 1 26 32 2,266 - 2,324 29 68 1,650 - 1,747 246 172 20,468 4,673 25,559<br />
1994 - - 144 - 144 19 21 1,682 - 1,722 7 16 1,028 - 1,051 155 84 20,523 4,079 24,841<br />
1995 1 - 155 - 156 12 15 1,351 - 1,378 4 9 232 - 245 151 71 16,928 3,270 20,420<br />
1996 1 - 126 - 127 10 12 738 - 760 6 13 308 - 327 146 73 15,157 2,916 18,292<br />
1997 1 - 141 - 142 12 11 1,891 - 1,914 3 5 1,324 - 1,332 243 57 24,478 2,110 26,888<br />
1998 - - 200 - 200 28 31 1,382 - 1,441 5 7 575 55 642 258 89 20,539 3,810 24,696<br />
1999 1 - 278 - 279 33 8 1,216 - 1,257 6 12 1,136 - 1,154 332 111 16,605 2,341 19,389<br />
2000 1 - 285 - 286 33 17 1,380 - 1,430 3 6 880 136 1,025 244 70 17,103 2,923 20,340<br />
2001 - - 304 - 304 18 45 1,539 325 1,927 2 5 1,741 204 1,952 222 147 25,871 2,835 29,075<br />
2002 1 - 273 - 274 19 15 1,792 17 1,843 4 5 1,862 14 1,885 368 88 27,241 2,562 30,259<br />
2003 1 4 290 - 295 38 49 1,174 - 1,261 6 5 1,389 - 1,400 385 110 27,006 771 28,272<br />
2004 1 - 207 - 208 19 13 1,400 17 1,449 4 4 1,385 - 1,393 251 44 23,735 716 24,746<br />
2005 1 - 229 - 230 32 11 805 15 863 5 3 901 - 909 381 41 15,790 4,872 21,084<br />
2006 1 - 231 - 232 30 13 1,007 35 1,085 23 4 490 1 518 403 62 16,364 4,431 21,260<br />
2007 1 - 239 - 240 41 8 1,032 64 1,145 13 4 1,171 15 1,203 289 37 16,177 5,599 22,102<br />
2008 1 - 266 - 267 28 7 524 72 631 16 5 1,587 4 1,612 285 31 17,721 4,306 22,343<br />
2009 1 - 446 - 447 17 6 327 8 358 11 1 1,799 12 1,823 291 32 21,640 4,063 26,026<br />
2010 1 - 519 - 520 27 20 655 3 705 8 2 2,604 - 2,614 299 45 27,383 4,618 32,345<br />
2011 - - 462 - 462 18 5 658 28 709 15 1 2,377 3 2,396 273 20 28,749 5,292 34,334<br />
2012 1 - 551 - 552 14 2 685 15 716 10 1 2,178 - 2,189 307 22 33,871 7,360 41,560<br />
2013 1 - 913 - 914 16 2 613 9 640 15 3 2,702 1 2,721 326 25 33,996 5,757 40,104<br />
2014 - - 723 - 723 16 1 471 8 496 8 2 128 3 141 331 20 27,981 6,567 34,899<br />
2015 1 - * - 1 18 8 * * 26 19 1 * * 20 493 43 * 191 727
35<br />
TABLE A-2c. Estimated retained catches (Ret.), by gear type, and estimated discards (Dis.), by purse-seine<br />
vessels of more than 363 t carrying capacity only, of other species, in metric tons, in the EPO. The data for<br />
2014-2015 are preliminary. . *: data missing or not available; -: no data collected; C: data combined with those<br />
of other flags; this category is used to avoid revealing the operations of individual vessels or companies.<br />
TAB<strong>LA</strong> A-2c. Estimaciones de las capturas retenidas (Ret.), por arte de pesca, y de los descartes (Dis.), por<br />
buques cerqueros de más de 363 t de capacidad de acarreo únicamente, de otras especies, en toneladas métricas, en<br />
el OPO. Los datos de 2014-2015 son preliminares. *: datos faltantes o no disponibles; -: datos no tomados; C:<br />
datos combinados con aquéllos de otras banderas; se usa esta categoría para no revelar información sobre las<br />
actividades de buques o empresas individuales.<br />
Carangids—Carángidos Dorado (Coryphaena spp.)<br />
Elasmobranchs—<br />
Elasmobranquios<br />
Other fishes—Otros peces<br />
PS<br />
PS<br />
PS<br />
PS<br />
LL OTR Total<br />
LL OTR Total<br />
LL OTR Total<br />
Ret. Dis. Ret. Dis. Ret. Dis. Ret. Dis.<br />
LL OTR Total<br />
1986 188 - - 19 207 633 - - 1,828 2,461 29 - 1 1,979 2,009 93 - - - 93<br />
1987 566 - - 5 571 271 - - 4,272 4,543 95 - 87 1,020 1,202 210 - 535 - 745<br />
1988 825 - - 1 826 69 - - 1,560 1,629 1 - 23 1,041 1,065 321 - 361 - 682<br />
1989 60 - - 2 62 211 - - 1,680 1,891 29 - 66 1,025 1,120 670 - 152 - 822<br />
1990 234 - - 1 235 63 - - 1,491 1,554 - - 280 1,095 1,375 433 - 260 14 707<br />
1991 116 - - - 116 57 - 7 613 677 1 - 1,112 1,352 2,465 463 - 458 1 922<br />
1992 116 - - - 116 69 - 37 708 814 - - 2,294 1,190 3,484 555 - 183 - 738<br />
1993 31 43 - 2 76 266 476 17 724 1,483 253 1,154 1,028 916 3,351 142 554 185 2 883<br />
1994 19 28 - 16 63 687 826 46 3,459 5,018 372 1,029 1,234 1,314 3,949 243 567 250 - 1,060<br />
1995 27 32 - 9 68 465 729 39 2,127 3,360 278 1,093 922 1,075 3,368 174 760 211 - 1,145<br />
1996 137 135 - 57 329 548 885 43 183 1,659 239 1,001 1,120 2,151 4,511 152 467 457 - 1,076<br />
1997 38 111 - 39 188 569 703 6,866 3,109 11,247 413 1,232 956 2,328 4,929 261 654 848 - 1,763<br />
1998 83 149 - 4 236 424 426 2,528 9,167 12,545 279 1,404 2,099 4,393 8,175 300 1,133 1,340 - 2,773<br />
1999 108 136 - 1 245 568 751 6,284 1,160 8,763 260 843 5,997 2,088 9,188 242 748 976 - 1,966<br />
2000 97 66 4 4 171 813 785 3,537 1,041 6,176 263 772 8,418 405 9,858 146 408 1,490 - 2,044<br />
2001 15 145 18 26 204 1,028 1,275 15,942 2,825 21,070 183 641 12,540 107 13,471 391 1,130 1,727 - 3,248<br />
2002 20 111 15 20 166 932 938 9,464 4,137 15,471 137 758 12,398 99 13,392 355 722 1,913 - 2,990<br />
2003 12 141 54 - 207 583 346 5,301 288 6,518 118 833 14,498 372 15,821 279 406 4,682 - 5,367<br />
2004 41 103 1 - 145 811 317 3,986 4,645 9,759 157 622 11,273 173 12,225 339 1,031 670 - 2,040<br />
2005 82 79 - - 161 863 295 3,854 8,667 13,679 199 496 12,117 220 13,032 439 276 636 - 1,351<br />
2006 247 146 - - 393 1,002 385 3,408 13,127 17,922 235 674 5,869 14,943 21,721 496 381 590 100 1,567<br />
2007 174 183 6 17 380 1,266 350 6,907 7,827 16,350 343 395 8,348 16,892 25,978 828 675 2,321 120 3,944<br />
2008 85 55 5 17 162 933 327 15,845 5,458 22,563 540 357 14,984 15,360 31,241 522 429 1,526 85 2,562<br />
2009 65 42 10 16 133 1,923 476 17,136 51,328 70,863 279 339 14,423 16,721 31,762 1,034 374 2,435 378 4,221<br />
2010 82 15 8 23 128 1,243 253 9,484 47,881 58,861 335 463 26,342 14,433 41,573 881 192 2,341 384 3,798<br />
2011 71 24 8 - 103 1,291 386 12,438 20,935 35,050 280 316 28,978 16,566 46,140 507 219 1,972 507 3,205<br />
2012 53 23 1 - 77 1,805 401 17,254 26,627 46,087 230 278 16,446 15,871 32,825 873 230 2,695 381 4,179<br />
2013 17 17 1 3 38 1,448 489 11,261 22,673 35,871 216 321 17,724 116 18,377 1,389 370 2,931 267 4,957<br />
2014 20 11 - 35 66 1,762 369 3,282 20,916 26,329 247 474 12,790 16,417 29,928 1,450 438 2,644 486 5,018<br />
2015 28 15 - - 43 1,045 169 * 15,948 17,162 398 620 * * 1,018 696 208 * * 904
36<br />
TABLE A-3a. Catches of yellowfin tuna by purse-seine vessels in the EPO, by vessel flag. The data have been<br />
adjusted to the species composition estimate, and are preliminary. *: data missing or not available; -: no data<br />
collected; C: data combined with those of other flags; this category is used to avoid revealing the operations of<br />
individual vessels or companies.<br />
TAB<strong>LA</strong> A-3a. Capturas de atún aleta amarilla por buques de cerco en el OPO, por bandera del buque. Los datos<br />
están ajustados a la estimación de composición por especie, y son preliminares. *: datos faltantes o no disponibles;<br />
-: datos no tomados; C: datos combinados con aquéllos de otras banderas; se usa esta categoría para no revelar<br />
información sobre las actividades de buques o empresas individuales.<br />
COL CRI ECU EU(ESP) MEX NIC PAN PER SLV USA V<strong>EN</strong> VUT C + OTR 1 Total<br />
1986 - C 16,561 C 103,644 - 9,073 C C 88,617 28,462 C 14,155 260,512<br />
1987 - - 15,046 C 96,182 - C C C 95,506 34,237 C 21,037 262,008<br />
1988 - - 23,947 C 104,565 - 7,364 1,430 C 82,231 38,257 C 19,499 277,293<br />
1989 - C 17,588 C 116,928 - 10,557 1,724 C 73,688 42,944 C 14,567 277,996<br />
1990 C C 16,279 C 115,898 - 6,391 C - 50,790 47,490 22,208 4,197 263,253<br />
1991 C - 15,011 C 115,107 - 1,731 C - 18,751 45,345 29,687 5,625 231,257<br />
1992 C - 12,119 C 118,455 - 3,380 45 - 16,961 44,336 27,406 5,419 228,121<br />
1993 3,863 - 18,094 C 101,792 - 5,671 - - 14,055 43,522 24,936 7,559 219,492<br />
1994 7,533 - 18,365 C 99,618 - 3,259 - - 8,080 41,500 25,729 4,324 208,408<br />
1995 8,829 C 17,044 C 108,749 - 1,714 - - 5,069 47,804 22,220 4,005 215,434<br />
1996 9,855 C 17,125 C 119,878 - 3,084 - - 6,948 62,846 10,549 8,322 238,607<br />
1997 9,402 - 18,697 C 120,761 - 4,807 - - 5,826 57,881 20,701 6,803 244,878<br />
1998 15,592 - 36,201 5,449 106,840 - 3,330 - C 2,776 61,425 17,342 5,004 253,959<br />
1999 13,267 - 53,683 8,322 114,545 C 5,782 - C 3,400 55,443 16,476 11,002 281,920<br />
2000 6,138 - 35,492 10,318 101,662 C 5,796 - - 4,374 67,672 8,247 13,563 253,262<br />
2001 12,950 - 55,347 18,448 130,087 C 9,552 - C 5,670 108,974 10,729 32,180 383,937<br />
2002 17,574 - 32,512 16,990 152,864 C 15,719 C 7,412 7,382 123,264 7,502 31,068 412,287<br />
2003 9,770 - 34,271 12,281 172,807 - 16,591 C C 3,601 96,914 9,334 27,710 383,279<br />
2004 C - 40,886 13,622 91,442 C 33,563 - C C 39,094 7,371 46,577 272,555<br />
2005 C - 40,596 11,947 110,898 4,838 33,393 - 6,470 C 28,684 C 31,276 268,102<br />
2006 C - 26,049 8,409 69,449 4,236 22,521 - C C 13,286 C 22,679 166,629<br />
2007 C - 19,749 2,631 65,091 3,917 26,024 - C C 20,097 C 32,507 170,016<br />
2008 C - 18,463 3,023 84,462 4,374 26,993 C C C 17,692 C 30,050 185,057<br />
2009 C - 18,167 7,864 99,785 6,686 35,228 C C C 25,298 C 43,729 236,757<br />
2010 20,493 - 34,764 2,820 104,969 9,422 34,538 C C - 21,244 C 22,758 251,008<br />
2011 18,643 - 32,946 1,072 99,812 7,781 18,607 - C C 18,712 C 9,278 206,851<br />
2012 20,924 - 29,485 1,065 93,323 7,541 15,932 - C C 23,408 C 6,339 198,017<br />
2013 16,476 - 27,655 511 114,706 8,261 18,301 C C - 24,896 C 7,381 218,187<br />
2014 17,203 - 37,640 763 120,986 8,119 19,375 C C 1,106 23,040 - 5,741 233,973<br />
2015 17,422 - 49,039 525 106,522 6,788 26,491 764 C 3,151 30,266 - 4,215 245,183<br />
1<br />
Includes—Incluye: BLZ, BOL, CHN, GTM, HND, UNK
37<br />
TABLE A-3b. Annual catches of yellowfin tuna by longline vessels, and totals for all gears, in the EPO, by<br />
vessel flag. The data for 2013-2014 are preliminary. *: data missing or not available; -: no data collected; C:<br />
data combined with those of other flags; this category is used to avoid revealing the operations of individual<br />
vessels or companies.<br />
TAB<strong>LA</strong> A-3b. Capturas anuales de atún aleta amarilla por buques de palangre en el OPO, y totales de todas las<br />
artes, por bandera del buque. Los datos de 2013-2014 son preliminares. *: datos faltantes o no disponibles; -:<br />
datos no tomados; C: datos combinados con aquéllos de otras banderas; se usa esta categoría para no revelar<br />
información sobre las actividades de buques o empresas individuales.<br />
CHN<br />
CRI<br />
FRA<br />
(PYF)<br />
JPN KOR MEX PAN TWN USA VUT<br />
C +<br />
OTR 1<br />
Total<br />
LL<br />
Total<br />
PS+LL<br />
1986 - - - 17,770 4,850 68 - 120 - - * 22,808 283,320 2,751<br />
1987 - - - 13,484 5,048 272 - 107 - - * 18,911 280,919 5,245<br />
1988 - - - 12,481 1,893 232 - 54 - - * 14,660 291,953 4,475<br />
1989 - - - 15,335 1,162 9 - 526 - - * 17,032 295,028 4,408<br />
1990 - - - 29,255 4,844 - - 534 - - * 34,633 297,886 3,636<br />
1991 - 169 - 23,721 5,688 - - 1,319 2 - * 30,899 262,156 3,814<br />
1992 - 119 57 15,296 2,865 - - 306 3 - * 18,646 246,767 5,747<br />
1993 - 200 39 20,339 3,257 C - 155 17 - 2 24,009 243,501 7,985<br />
1994 - 481 214 25,983 3,069 41 - 236 2 - * 30,026 238,434 5,112<br />
1995 - 542 198 17,042 2,748 7 - 28 31 - * 20,596 236,030 3,334<br />
1996 - 183 253 12,631 3,491 0 - 37 13 - * 16,608 255,215 5,401<br />
1997 - 715 307 16,218 4,753 - - 131 11 - 28 22,163 267,041 5,018<br />
1998 - 1,124 388 10,048 3,624 16 - 113 15 - 8 15,336 269,295 6,614<br />
1999 - 1,031 206 7,186 3,030 10 - 186 7 - 26 11,682 293,602 4,489<br />
2000 - 1,084 1,052 15,265 5,134 153 359 742 10 5 51 23,855 277,118 3,540<br />
2001 942 1,133 846 14,808 5,230 29 732 3,928 29 13 1,918 29,608 413,544 4,436<br />
2002 1,457 1,563 278 8,513 3,626 4 907 7,360 5 290 1,528 25,531 437,817 1,501<br />
2003 2,739 1,418 462 9,125 4,911 365 C 3,477 5 699 1,973 25,174 408,453 1,615<br />
2004 798 1,701 767 7,338 2,997 32 2,802 1,824 6 171 343 18,779 291,336 2,511<br />
2005 682 1,791 530 3,966 532 0 1,782 2,422 7 51 183 11,946 280,047 3,674<br />
2006 246 1,402 537 2,968 928 0 2,164 1,671 21 164 109 10,210 176,841 2,144<br />
2007 224 1,204 408 4,582 353 8 - 745 11 154 378 8,067 178,083 2,333<br />
2008 469 1,248 335 5,383 83 5 - 247 33 175 1,842 9,820 194,877 1,755<br />
2009 629 1,003 590 4,268 780 10 - 636 84 244 2,200 10,444 247,201 1,950<br />
2010 459 3 301 3,639 737 6 - 872 54 269 1,999 8,339 259,348 1,492<br />
2011 1,807 - 349 2,373 754 6 - 647 55 150 1,907 8,048 214,899 1,406<br />
2012 2,591 1,482 538 3,600 631 7 519 749 39 155 2,643 12,954 210,971 1,888<br />
2013 1,874 1,424 410 3,117 928 2 959 572 43 101 1,986 11,416 229,603 1,993<br />
2014 2,120 1,072 567 2,652 704 1 108 896 60 323 19 8,522 242,495 3,500<br />
1<br />
Includes—Incluye: BLZ, CHL, ECU, EU(ESP), GTM, HND, NIC, SLV<br />
2<br />
Includes gillnets, pole-and-line, recreational, troll and unknown gears—Incluye red de transmalle, caña, artes deportivas, y desconocidas<br />
OTR 2
38<br />
TABLE A-3c. Catches of skipjack tuna by purse-seine and longline vessels in the EPO, by vessel flag. The data<br />
have been adjusted to the species composition estimate, and are preliminary. *: data missing or not available; -:<br />
no data collected; C: data combined with those of other flags; this category is used to avoid revealing the<br />
operations of individual vessels or companies.<br />
TAB<strong>LA</strong> A-3c. Capturas de atún barrilete por buques de cerco y de palangre en el OPO, por bandera del buque. Los<br />
datos están ajustados a la estimación de composición por especie, y son preliminares. *: datos faltantes o no<br />
disponibles; -: datos no tomados; C: datos combinados con aquéllos de otras banderas; se usa esta categoría para no<br />
revelar información sobre las actividades de buques o empresas individuales.<br />
PS<br />
COL CRI ECU EU(ESP) MEX NIC PAN PER SLV USA V<strong>EN</strong> VUT C+OTR 1 Total<br />
LL+<br />
OTR 2<br />
1986 - C 23,836 C 6,061 - 1,134 C C 12,978 11,797 C 9,828 65,634 2,111<br />
1987 - - 20,473 C 4,786 - C C C 13,578 11,761 C 13,421 64,019 2,447<br />
1988 - - 11,743 C 15,195 - 1,863 714 C 36,792 12,312 C 8,494 87,113 5,014<br />
1989 - C 22,922 C 14,960 - 4,361 276 - 21,115 16,847 C 14,453 94,934 3,987<br />
1990 C C 24,071 C 6,696 - 3,425 C - 13,188 11,362 11,920 3,707 74,369 2,738<br />
1991 C - 18,438 C 10,916 - 1,720 C - 13,162 5,217 9,051 3,724 62,228 3,662<br />
1992 C - 25,408 C 9,188 - 3,724 352 - 14,108 10,226 13,315 7,962 84,283 3,011<br />
1993 3,292 - 21,227 C 13,037 - 1,062 - - 17,853 7,270 10,908 9,181 83,830 6,089<br />
1994 7,348 - 15,083 C 11,783 - 2,197 - - 8,947 6,356 9,541 8,871 70,126 4,044<br />
1995 13,081 C 31,934 C 29,406 - 4,084 - - 14,032 5,508 13,910 15,092 127,047 7,241<br />
1996 13,230 C 32,433 C 14,501 - 3,619 - - 12,012 4,104 10,873 13,201 103,973 3,868<br />
1997 12,332 - 51,826 C 23,416 - 4,277 - - 13,687 8,617 14,246 25,055 153,456 3,491<br />
1998 4,698 - 67,074 20,012 15,969 - 1,136 - C 6,898 6,795 11,284 6,765 140,631 2,215<br />
1999 11,210 - 124,393 34,923 16,767 C 5,286 - C 13,491 16,344 21,287 17,864 261,565 3,638<br />
2000 10,138 - 104,849 17,041 14,080 C 9,573 - - 7,224 6,720 13,620 22,399 205,644 365<br />
2001 9,445 - 66,144 13,454 8,169 C 6,967 - C 4,135 3,215 7,824 23,813 143,166 1,696<br />
2002 10,908 - 80,378 10,546 6,612 C 9,757 C 4,601 4,582 2,222 4,657 19,283 153,546 996<br />
2003 14,771 - 139,804 18,567 8,147 - 25,084 C C 5,445 6,143 14,112 41,895 273,968 4,049<br />
2004 C - 89,621 8,138 24,429 C 20,051 - C C 23,356 4,404 27,825 197,824 2,349<br />
2005 C - 140,927 9,224 32,271 3,735 25,782 - 4,995 C 22,146 C 24,149 263,229 3,309<br />
2006 C - 138,490 16,668 16,790 8,396 44,639 - C C 26,334 C 44,952 296,269 1,645<br />
2007 C - 93,553 2,879 21,542 4,286 28,475 - C C 21,990 C 35,571 208,296 1,579<br />
2008 C - 143,431 4,841 21,638 7,005 43,230 C C C 28,333 C 48,125 296,603 2,847<br />
2009 C - 132,712 6,021 6,847 5,119 26,973 C C C 19,370 C 33,481 230,523 2,821<br />
2010 11,400 - 82,280 1,569 3,010 5,242 19,213 C C - 11,818 C 12,660 147,192 3,132<br />
2011 23,269 - 149,637 5,238 11,899 3,889 29,837 - C C 27,026 C 25,240 276,035 2,259<br />
2012 15,760 - 151,280 15,773 18,058 3,931 25,786 - C C 20,829 C 14,798 266,215 3,793<br />
2013 22,168 - 172,002 2,900 17,350 4,345 31,022 C C - 17,522 C 11,251 278,560 3,229<br />
2014 22,740 - 172,510 5,599 8,777 6,309 21,816 C C C 13,766 - 10,061 261,578 1,470<br />
2015 16,370 - 210,215 11,545 23,170 1,439 31,005 5,165 C 16,867 4,777 - 8,727 329,280 477<br />
1<br />
Includes—Incluye: BLZ, BOL, CHN, CYM, EU(CYP), GTM, HND, KOR, LBR, NZL, RUS, VCT, UNK<br />
2<br />
Includes gillnets, pole-and-line, recreational, and unknown gears—Incluye red de transmalle, caña, artes deportivas y desconocidas
39<br />
TABLE A-3d. Catches of bigeye tuna by purse-seine vessels in the EPO, by vessel flag. The data have been<br />
adjusted to the species composition estimate, and are preliminary. *: data missing or not available; -: no data<br />
collected; C: data combined with those of other flags; this category is used to avoid revealing the operations of<br />
individual vessels or companies.<br />
TAB<strong>LA</strong> A-3d. Capturas de atún patudo por buques de cerco en el OPO, por bandera del buque. Los datos están<br />
ajustados a la estimación de composición por especie, y son preliminares. *: datos faltantes o no disponibles; -:<br />
datos no tomados; C: datos combinados con aquéllos de otras banderas; se usa esta categoría para no revelar<br />
información sobre las actividades de buques o empresas individuales.<br />
COL CRI ECU EU(ESP) MEX NIC PAN PER SLV USA V<strong>EN</strong> VUT C + OTR 1 Total<br />
1986 - - 653 C 1 - - - - 266 1,466 C 300 2,686<br />
1987 - - 319 C 2 - * - C 224 453 C 179 1,177<br />
1988 - - 385 C - - 431 * C 256 202 C 261 1,535<br />
1989 - - 854 C - - - * - 172 294 C 710 2,030<br />
1990 - - 1,619 C 29 - 196 - - 209 1,405 2,082 381 5,921<br />
1991 - - 2,224 C 5 - - - - 50 591 1,839 161 4,870<br />
1992 - - 1,647 C 61 - 38 * - 3,002 184 1,397 850 7,179<br />
1993 686 - 2,166 C 120 - 10 * - 3,324 253 1,848 1,250 9,657<br />
1994 5,636 - 5,112 C 171 - - * - 7,042 637 8,829 7,472 34,899<br />
1995 5,815 C 8,304 C 91 - 839 * - 11,042 706 12,072 6,452 45,321<br />
1996 7,692 C 20,279 C 82 - 1,445 * - 8,380 619 12,374 10,440 61,311<br />
1997 3,506 - 30,092 C 38 - 1,811 * - 8,312 348 6,818 13,347 64,272<br />
1998 596 - 25,113 5,747 12 - 12 * C 5,309 348 4,746 2,246 44,129<br />
1999 1,511 - 24,355 11,703 33 C 1,220 * C 2,997 10 5,318 4,011 51,158<br />
2000 7,443 - 36,094 12,511 0 C 7,028 * - 5,304 457 10,000 16,446 95,283<br />
2001 5,230 - 24,424 7,450 0 C 3,858 * C 2,290 0 4,333 12,933 60,518<br />
2002 5,283 - 26,262 5,108 0 C 4,726 C 2,228 2,219 0 2,256 9,340 57,422<br />
2003 3,664 - 22,896 4,605 0 - 6,222 C C 1,350 424 3,500 10,390 53,051<br />
2004 C - 30,817 3,366 0 C 8,294 * C C 9,661 1,822 11,511 65,471<br />
2005 C - 30,507 3,831 0 1,551 10,707 * 2,074 C 9,197 C 10,028 67,895<br />
2006 C - 39,302 5,264 6 2,652 14,099 * C C 8,317 C 14,197 83,837<br />
2007 C - 40,445 711 0 1,058 7,029 * C C 5,428 C 8,780 63,451<br />
2008 C - 41,177 1,234 327 1,785 11,018 C C C 7,221 C 12,266 75,028<br />
2009 C - 35,646 2,636 1,334 2,241 11,807 C C C 8,479 C 14,657 76,800<br />
2010 4,206 - 34,902 579 11 1,934 7,089 C C - 4,360 C 4,672 57,753<br />
2011 3,210 - 31,282 4,111 133 2,256 7,953 * C C 301 C 7,266 56,512<br />
2012 1,873 - 45,633 3,866 225 1,250 7,238 * C C 848 C 5,087 66,020<br />
2013 1,405 - 32,444 1,672 124 2,749 6,118 - C - 963 C 4,012 49,487<br />
2014 2,453 - 38,749 2,790 40 3,039 8,107 - C C 1,170 - 4,105 60,453<br />
2015 2,379 - 43,709 754 149 962 10,596 - C 2,308 126 - 2,246 63,229<br />
1<br />
Includes—Incluye: BLZ, BOL, CHN, CYM, EU(CYP), GTM, HND, LBR, NZL, VCT, UNK
40<br />
TABLE A-3e. Annual catches of bigeye tuna by longline vessels, and totals for all gears, in the EPO, by vessel<br />
flag. The data for 2014-2015 are preliminary. *: data missing or not available; -: no data collected; C: data<br />
combined with those of other flags; this category is used to avoid revealing the operations of individual vessels<br />
or companies.<br />
TAB<strong>LA</strong> A-3e. Capturas anuales de atún patudo por buques de palangre en el OPO, y totales de todas las artes,<br />
por bandera del buque. Los datos de 2014-2015 son preliminares. *: datos faltantes o no disponibles; -: datos no<br />
tomados; C: datos combinados con aquéllos de otras banderas; se usa esta categoría para no revelar información<br />
sobre las actividades de buques o empresas individuales.<br />
CHN<br />
CRI<br />
FRA(<br />
PYF)<br />
JPN KOR MEX PAN TWN USA VUT<br />
C +<br />
OTR 1<br />
Total<br />
LL<br />
Total<br />
PS + LL<br />
1986 - - - 91,981 10,187 0 - 257 - - * 102,425 105,111 74<br />
1987 - - - 87,913 11,681 1 - 526 - - * 100,121 101,298 49<br />
1988 - - - 66,015 6,151 1 - 591 - - * 72,758 74,293 20<br />
1989 - - - 67,514 3,138 - - 311 - - * 70,963 72,993 1<br />
1990 - - - 86,148 12,127 - - 596 - - * 98,871 104,792 59<br />
1991 - 1 - 85,011 17,883 - - 1,291 9 - * 104,195 109,065 56<br />
1992 - 9 7 74,466 9,202 - - 1,032 92 - * 84,808 91,987 13<br />
1993 - 25 7 63,190 8,924 * - 297 55 - * 72,498 82,155 35<br />
1994 - 1 102 61,471 9,522 - - 255 9 - * 71,360 106,259 806<br />
1995 - 13 97 49,016 8,992 - - 77 74 - * 58,269 103,590 1,369<br />
1996 - 1 113 36,685 9,983 - - 95 81 - * 46,958 108,269 748<br />
1997 - 9 250 40,571 11,376 - - 256 118 - * 52,580 116,852 20<br />
1998 - 28 359 35,752 9,731 - - 314 191 - * 46,375 90,504 628<br />
1999 - 25 3,652 22,224 9,431 - - 890 228 - * 36,450 87,608 538<br />
2000 - 27 653 28,746 13,280 42 14 1,916 162 2,754 11 47,605 142,887 253<br />
2001 2,639 28 684 38,048 12,576 1 80 9,285 147 3,277 1,990 68,755 129,273 19<br />
2002 7,614 19 388 34,193 10,358 - 6 17,253 132 2,995 1,466 74,424 131,845 12<br />
2003 10,066 18 346 24,888 10,272 - C 12,016 232 1,258 680 59,776 112,828 21<br />
2004 2,645 21 405 21,236 10,729 - 48 7,384 149 407 459 43,483 108,954 194<br />
2005 2,104 23 398 19,113 11,580 - 30 6,441 536 318 151 40,694 108,589 25<br />
2006 709 18 388 16,235 6,732 - 37 6,412 85 960 195 31,771 115,608 40<br />
2007 2,324 15 361 13,977 5,611 - - 6,057 417 1,013 101 29,876 93,326 44<br />
2008 2,379 16 367 14,908 4,150 - - 1,852 1,277 790 468 26,207 101,236 28<br />
2009 2,481 13 484 15,490 6,758 - - 3,396 730 1,032 1,038 31,422 108,221 15<br />
2010 2,490 4 314 15,847 9,244 - - 5,276 1,356 1,496 1,063 37,090 94,842 2<br />
2011 5,450 - 445 13,399 6,617 - - 3,957 1,050 694 706 32,318 88,829 0<br />
2012 4,386 3 464 16,323 7,450 - - 4,999 875 1,063 604 36,167 102,187 27<br />
2013 5,199 - 527 14,258 8,822 - - 4,162 2,056 604 577 36,205 85,691 99<br />
2014 5,253 9 526 13,468 8,203 - C 4,511 2,100 897 129 35,096 95,549 177<br />
2015 8,486 * * 13,415 10,107 * * 5,538 666 * 33 38,245 101,474 1<br />
1<br />
Includes—Incluye: BLZ, CHL, ECU, EU(ESP), HND, SLV<br />
2<br />
Includes gillnets, pole-and-line, recreational, and unknown gears—Incluye red de transmalle, caña, artes deportivas, y desconocidas<br />
OTR 2
41<br />
TABLE A-4a. Preliminary estimates of the retained catches in metric tons, of tunas and bonitos caught by<br />
purse-seine vessels in the EPO in 2014 and 2015, by species and vessel flag. The data for yellowfin, skipjack,<br />
and bigeye tunas have been adjusted to the species composition estimates, and are preliminary.<br />
TAB<strong>LA</strong> A-4a. Estimaciones preliminares de las capturas retenidas, en toneladas métricas, de atunes y bonitos<br />
por buques cerqueros en el OPO en 2014 y 2015, por especie y bandera del buque. Los datos de los atunes aleta<br />
amarilla, barrilete, y patudo fueron ajustados a las estimaciones de composición por especie, y son preliminares.<br />
YFT SKJ BET PBF ALB BKJ BZX TUN Total %<br />
2014 Retained catches–Capturas retenidas<br />
COL 17,203 22,740 2,453 - - 10 - - 42,406 7.4<br />
ECU 37,640 172,510 38,749 - - 707 1,855 65 251,526 44.2<br />
EU(ESP) 763 5,599 2,790 - - - - - 9,152 1.6<br />
MEX 120,986 8,777 40 4,862 - 3,428 964 48 139,105 24.5<br />
NIC 8,119 6,309 3,039 - - 1 - - 17,468 3.1<br />
PAN 19,375 21,816 8,107 - - 5 2 - 49,305 8.7<br />
USA 1,106 521 128 401 - - - - 2,156 0.4<br />
V<strong>EN</strong> 23,040 13,766 1,170 - - 2 - - 37,978 6.7<br />
OTR 1 5,741 9,540 3,977 - - - - - 19,258 3.4<br />
Total 233,973 261,578 60,453 5,263 - 4,153 2,821 113 568,354<br />
2015 Retained catches–Capturas retenidas<br />
COL 17,422 16,370 2,379 - - 20 - - 36,191 5.6<br />
ECU 49,039 210,215 43,709 - - 1,032 37 47 304,079 47.1<br />
EU(ESP) 525 11,545 754 - - - - - 12,824 2.0<br />
MEX 106,522 23,170 149 3,082 - 2,719 626 23 136,291 21.1<br />
NIC 6,788 1,439 962 - - 1 - - 9,190 1.4<br />
PAN 26,491 31,005 10,596 - - - - 3 68,095 10.5<br />
PER 764 5,165 - - - - 9 5 5,943 0.9<br />
USA 3,151 16,867 2,308 86 - - 117 - 22,529 3.5<br />
V<strong>EN</strong> 30,266 4,777 126 - - 15 - 3 35,187 5.5<br />
OTR 2 4,215 8,727 2,246 - - 6 - - 15,194 2.4<br />
Total 245,183 329,280 63,229 3,168 - 3,793 789 81 645,523<br />
1 Includes El Salvador, Guatemala and Peru. This category is used to avoid revealing the operations of individual vessels or companies.<br />
1 Incluye El Salvador, Guatemala y Perú. Se usa esta categoría para no revelar información sobre las actividades de buques o empresas<br />
individuales.<br />
2 Includes El Salvador and Guatemala This category is used to avoid revealing the operations of individual vessels or companies.<br />
2 Incluye El Salvador y Guatemala Se usa esta categoría para no revelar información sobre las actividades de buques o empresas<br />
individuales.
42<br />
TABLE A-4b. Preliminary estimates of the retained landings in metric tons, of tunas and bonitos caught by<br />
purse-seine vessels in the EPO in 2014 and 2015, by species and country of landing. The data for yellowfin,<br />
skipjack, and bigeye tunas have not been adjusted to the species composition estimates, and are preliminary.<br />
TAB<strong>LA</strong> A-4b. Estimaciones preliminares de las descargas, en toneladas métricas, de atunes y bonitos por<br />
buques cerqueros en el OPO en 2014 y 2015, por especie y país de descarga. Los datos de los atunes aleta<br />
amarilla, barrilete, y patudo no fueron ajustados a las estimaciones de composición por especie, y son<br />
preliminares.<br />
1,2<br />
YFT SKJ BET PBF ALB BKJ BZX TUN Total %<br />
2014 Landings-Desccargas<br />
COL 11,696 6,946 907 - - 66 - - 19,615 3.5%<br />
ECU 78,194 221,675 41,061 - - 630 2,020 65 343,645 61.5%<br />
MEX 120,208 7,072 27 4,862 - 3,428 965 48 136,610 24.4%<br />
USA 1,177 486 92 402 - - - - 2,157 0.4%<br />
V<strong>EN</strong> 2,234 3,082 71 - - - - - 5,387 1.0%<br />
OTR 1 31,542 16,046 3,834 - - - - - 51,422 9.2%<br />
Total 245,051 255,307 45,992 5,264 - 4,124 2,985 113 558,836<br />
2015 Landings-Desccargas<br />
COL 8,578 5,101 921 - - 118 - - 14,718 2.2%<br />
ECU 97,710 279,105 53,338 - - 961 35 52 431,149 66.0%<br />
MEX 115,508 27,038 319 3,082 - 2,729 626 23 149,325 22.8%<br />
USA 990 5,328 210 86 - - 117 - 6,731 1.0%<br />
V<strong>EN</strong> 3,903 1,109 8 - - - - 3 5,023 0.8%<br />
OTR 2 25,054 17,867 3,808 - - 15 11 8 46,763 7.2%<br />
Total 251,743 335,548 58,604 3,168 - 3,823 789 86 653,709<br />
Includes Costa Rica, El Salvador, Guatemala and Peru. This category is used to avoid revealing the operations of individual vessels<br />
or companies.<br />
1,2<br />
Incluye Costa Rica, El Salvador, Guatemala y Perú. Se usa esta categoría para no revelar información sobre las actividades de buques<br />
o empresas individuales.
43<br />
TABLE A-5a. Annual retained catches of Pacific bluefin tuna, by gear type and flag, in metric tons. The data for<br />
2014 and 2015 are preliminary.<br />
TAB<strong>LA</strong> A-5a. Capturas retenidas anuales de atún aleta azul del Pacífico, por arte de pesca y bandera, en<br />
toneladas métricas. Los datos de 2014 y 2015 son preliminares.<br />
Western Pacific flags—Banderas del Pacífico occidental 1 Eastern Pacific flags—Banderas del<br />
Pacífico oriental<br />
PBF<br />
Total<br />
JPN KOR 1 TWN Subtotal<br />
PS OTR PS OTR total<br />
MEX USA Sub-<br />
OTR<br />
PS LP LL OTR PS OTR PS LL OTR<br />
1986 7,412 1,086 102 5,100 344 - 16 70 13 14,143 189 - 4,851 64 5,104 - 19,247<br />
1987 8,653 1,565 211 3,523 89 13 21 365 14 14,454 119 - 861 87 1,067 - 15,521<br />
1988 3,605 907 157 2,465 32 - 197 108 62 7,533 447 1 923 51 1,422 9 8,964<br />
1989 6,190 754 209 1,934 71 - 259 205 54 9,676 57 - 1,046 96 1,199 - 10,875<br />
1990 2,989 536 309 2,421 132 - 149 189 315 7,040 50 - 1,380 164 1,594 - 8,634<br />
1991 9,808 286 218 4,204 265 - - 342 119 15,242 9 - 410 55 474 - 15,716<br />
1992 7,162 166 513 3,204 288 - 73 464 8 11,878 - - 1,928 148 2,076 - 13,954<br />
1993 6,600 129 812 1,759 40 - 1 471 3 9,815 - - 580 316 896 - 10,711<br />
1994 8,131 162 1,206 5,667 50 - - 559 - 15,775 63 2 906 115 1,086 - 16,861<br />
1995 18,909 270 678 7,223 821 - - 335 2 28,238 11 - 649 275 935 - 29,173<br />
1996 7,644 94 901 5,359 102 - - 956 - 15,056 3,700 - 4,633 90 8,423 - 23,479<br />
1997 13,152 34 1,300 4,354 1,054 - - 1,814 - 21,708 367 - 2,240 245 2,852 - 24,560<br />
1998 5,391 85 1,255 4,450 188 - - 1,910 - 13,279 1 - 1,771 597 2,369 - 15,648<br />
1999 16,173 35 1,157 5,246 256 - - 3,089 - 25,956 2,369 35 184 617 3,205 - 29,161<br />
2000 16,486 102 953 7,031 2,401 - - 2,780 2 29,755 3,019 99 693 353 4,164 - 33,919<br />
2001 7,620 180 791 5,614 1,176 10 - 1,839 4 17,234 863 - 292 384 1,539 131 18,904<br />
2002 8,903 99 841 4,338 932 1 - 1,523 4 16,641 1,708 2 50 622 2,382 67 19,090<br />
2003 5,768 44 1,237 3,345 2,601 - - 1,863 21 14,879 3,211 43 22 372 3,648 42 18,569<br />
2004 8,257 132 1,847 3,855 773 - - 1,714 3 16,581 8,880 14 - 59 8,953 - 25,534<br />
2005 12,817 549 1,925 6,363 1,318 9 - 1,368 2 24,351 4,542 - 201 80 4,823 - 29,174<br />
2006 8,880 108 1,121 4,058 1,012 3 - 1,149 1 16,332 9,927 - - 93 10,020 - 26,352<br />
2007 6,840 236 1,762 4,983 1,281 4 - 1,401 10 16,517 4,147 - 42 14 4,203 - 20,720<br />
2008 10,221 64 1,390 5,505 1,866 10 - 979 2 20,037 4,392 15 - 63 4,470 - 24,507<br />
2009 8,077 50 1,080 4,814 936 4 - 877 11 15,849 3,019 - 410 161 3,590 - 19,439<br />
2010 3,742 83 890 3,681 1,196 16 - 373 36 10,017 7,746 - - 89 7,835 - 17,852<br />
2011 8,340 63 837 3,754 670 14 - 292 24 13,994 2,730 1 99 244 3,074 - 17,068<br />
2012 2,462 113 673 2,845 1,421 2 - 210 4 7,730 6,667 1 38 405 7,111 - 14,841<br />
2013 2,771 8 784 2,848 604 1 - 332 3 7,351 3,154 - - 819 3,973 - 11,324<br />
2014 5,456 5 715 3,429 1,305 6 - 480 3 11,399 4,862 - 401 403 5,666 - 17,065<br />
2015 * * * * * * * * * * 3,082 - 86 14 3,182 - 3,182<br />
1<br />
Source: International Scientific Committee, 15th Plenary Meeting, PBFWG workshop report on Pacific Bluefin Tuna,<br />
July 2015—Fuente: Comité Científico Internacional, 15ª Reunión Plenaria, Taller PBFWG sobre Atún Aleta Azul del<br />
Pacífico, julio de 2015
44<br />
TABLE A-5b. Reported catches of Pacific bluefin tuna in the EPO by recreational gear, in number of<br />
fish, 1986-2015.<br />
TAB<strong>LA</strong> A-5b. Capturas reportadas de atún aleta azul del Pacifico en el OPO por artes deportivas, en<br />
número de peces, 1986-2015.<br />
PBF<br />
1986 693 2001 21,913<br />
1987 1,951 2002 33,399<br />
1988 330 2003 22,291<br />
1989 6,519 2004 3,391<br />
1990 3,755 2005 5,757<br />
1991 5,330 2006 7,473<br />
1992 8,586 2007 1,028<br />
1993 10,535 2008 10,187<br />
1994 2,243 2009 12,138<br />
1995 16,025 2010 8,453<br />
1996 2,739 2011 31,494<br />
1997 8,338 2012 40,012<br />
1998 20,466 2013 63,158<br />
1999 36,797 2014 26,105<br />
2000 20,669 2015 26,077
45<br />
TABLE A-6. Annual retained catches of albacore in the EPO, by gear and area (north and south of the<br />
equator), in metric tons. The data for 2013 and 2014 are preliminary.<br />
TAB<strong>LA</strong> A-6. Capturas retenidas anuales de atún albacora en el OPO, por arte y zona (al norte y al sur de<br />
la línea ecuatorial), en toneladas. Los datos de 2013 y 2014 son preliminares.<br />
ALB<br />
North—Norte<br />
South—Sur<br />
LL LTL 1 OTR Subtotal LL LTL OTR Subtotal<br />
Total<br />
1986 698 4,368 243 5,309 5,752 74 149 5,975 11,284<br />
1987 1,114 2,620 172 3,906 8,880 188 3 9,071 12,977<br />
1988 899 4,473 81 5,453 9,035 1,282 1 10,318 15,771<br />
1989 952 1,873 161 2,986 5,832 593 90 6,515 9,501<br />
1990 1,143 2,610 63 3,816 5,393 1,336 305 7,034 10,850<br />
1991 1,514 2,617 6 4,137 6,379 795 170 7,344 11,481<br />
1992 1,635 4,770 2 6,407 15,445 1,205 18 16,668 23,075<br />
1993 1,772 4,332 25 6,129 9,422 35 19 9,476 15,605<br />
1994 2,356 9,666 106 12,128 8,034 446 21 8,501 20,629<br />
1995 1,380 7,773 102 9,255 4,805 2 15 4,822 14,077<br />
1996 1,675 8,267 99 10,041 5,956 94 21 6,071 16,112<br />
1997 1,365 6,115 1,019 8,499 8,313 466 0 8,779 17,278<br />
1998 1,730 12,019 1,250 14,999 10,905 12 0 10,917 25,916<br />
1999 2,701 11,028 3,668 17,397 8,932 81 7 9,020 26,417<br />
2000 1,880 10,960 1,869 14,709 7,783 778 3 8,564 23,273<br />
2001 1,822 11,727 1,638 15,187 17,588 516 6 18,110 33,297<br />
2002 1,227 12,286 2,388 15,901 14,062 131 40 14,233 30,134<br />
2003 1,129 17,808 2,260 21,197 23,772 419 3 24,194 45,391<br />
2004 854 20,288 1,623 22,765 17,590 331 0 17,921 40,686<br />
2005 405 13,818 1,741 15,964 8,945 181 7 9,133 25,097<br />
2006 3,671 18,515 408 22,594 10,161 48 118 10,327 32,921<br />
2007 2,708 17,948 1,415 22,071 8,399 19 87 8,505 30,576<br />
2008 1,160 17,185 308 18,653 8,058 0 159 8,217 26,870<br />
2009 91 17,933 996 19,020 11,981 0 213 12,194 31,214<br />
2010 1,134 18,216 892 20,242 13,122 3 247 13,372 33,614<br />
2011 1,833 15,468 426 17,727 14,357 0 222 14,579 32,306<br />
2012 4,580 16,633 1,224 22,437 19,616 35 210 19,861 42,298<br />
2013 6,771 17,399 844 25,014 18,597 0 271 18,868 43,882<br />
2014 3,342 18,194 1,052 22,588 25,533 72 237 25,842 48,430<br />
1<br />
Includes pole-and-line—Incluye caña
46<br />
TABLE A-7. Estimated numbers of sets, by set type and vessel capacity category, and estimated retained<br />
catches, in metric tons, of yellowfin, skipjack, and bigeye tuna by purse-seine vessels in the EPO. The<br />
data for 2015 are preliminary. The data for yellowfin, skipjack, and bigeye tunas have been adjusted to<br />
the species composition estimate and are preliminary.<br />
TAB<strong>LA</strong> A-7. Números estimados de lances, por tipo de lance y categoría de capacidad de buque, y<br />
capturas retenidas estimadas, en toneladas métricas, de atunes aleta amarilla, barrilete, y patudo por<br />
buques cerqueros en el OPO. Los datos de 2015 son preliminares. Los datos de los atunes aleta amarilla,<br />
barrilete, y patudo fueron ajustados a la estimación de composición por especie, y son preliminares.<br />
Number of sets—Número de lances<br />
Retained catch—Captura retenida<br />
Vessel capacity—Capacidad del<br />
buque Total YFT SKJ BET<br />
≤363 t >363 t<br />
DEL<br />
Sets on fish associated with dolphins<br />
Lances sobre peces asociados a delfines<br />
2000 0 9,235 9,235 146,533 540 15<br />
2001 0 9,876 9,876 238,629 1,802 6<br />
2002 0 12,290 12,290 301,099 3,180 2<br />
2003 0 13,760 13,760 265,512 13,332 1<br />
2004 0 11,783 11,783 177,460 10,730 3<br />
2005 0 12,173 12,173 166,211 12,127 2<br />
2006 0 8,923 8,923 91,978 4,787 0<br />
2007 0 8,871 8,871 97,032 3,277 7<br />
2008 0 9,246 9,246 122,105 8,382 5<br />
2009 0 10,910 10,910 178,436 2,719 1<br />
2010 0 11,645 11,645 168,984 1,627 4<br />
2011 0 9,604 9,604 134,839 4,372 2<br />
2012 0 9,220 9,220 133,716 2,120 0<br />
2013 0 10,736 10,736 157,432 4,272 0<br />
2014 0 11,382 11,382 168,209 4,436 3<br />
2015 0 11,020 11,020 160,901 5,651 2<br />
OBJ<br />
Sets on fish associated with floating objects<br />
Lances sobre peces asociados a objetos flotantes<br />
2000 508 3,713 4,221 42,522 121,723 92,966<br />
2001 827 5,674 6,501 67,200 122,363 59,748<br />
2002 867 5,771 6,638 38,057 116,793 55,901<br />
2003 706 5,457 6,163 30,307 181,214 51,296<br />
2004 615 4,986 5,601 28,340 117,212 64,005<br />
2005 639 4,992 5,631 26,126 133,509 66,257<br />
2006 1,158 6,862 8,020 34,313 191,093 82,136<br />
2007 1,384 5,857 7,241 29,619 122,286 62,189<br />
2008 1,819 6,655 8,474 34,819 157,274 73,855<br />
2009 1,821 7,077 8,898 36,136 157,067 75,888<br />
2010 1,788 6,399 8,187 38,113 113,716 57,167<br />
2011 2,538 6,921 9,459 42,189 170,986 55,589<br />
2012 3,067 7,610 10,677 37,527 177,239 65,040<br />
2013 3,081 8,038 11,119 35,089 194,372 48,337<br />
2014 3,858 8,777 12,635 45,476 199,488 59,803<br />
2015 3,403 9,385 12,788 43,152 205,976 61,277
47<br />
TABLE A-7. (continued)<br />
TAB<strong>LA</strong> A-7 (continuación)<br />
Number of sets—Número de lances<br />
Retained catch—Captura retenida<br />
Vessel capacity—Capacidad del<br />
buque Total YFT SKJ BET<br />
≤363 t >363 t<br />
NOA<br />
Sets on unassociated schools<br />
Lances sobre cardúmenes no asociados<br />
2000 5,497 5,472 10,969 64,208 83,384 2,301<br />
2001 4,022 3,024 7,046 78,107 19,000 764<br />
2002 4,938 3,442 8,380 73,130 33,573 1,518<br />
2003 7,274 5,131 12,405 87,460 79,422 1,755<br />
2004 4,969 5,696 10,665 66,757 69,882 1,463<br />
2005 6,109 7,816 13,925 75,764 117,593 1,636<br />
2006 6,189 8,443 14,632 40,340 100,388 1,702<br />
2007 4,845 7,211 12,056 43,365 82,732 1,254<br />
2008 4,771 6,210 10,981 28,133 130,947 1,168<br />
2009 3,308 4,109 7,417 22,200 70,737 910<br />
2010 2,252 3,886 6,138 43,912 31,849 581<br />
2011 2,840 5,182 8,022 29,823 100,677 921<br />
2012 2,996 5,369 8,365 26,774 86,856 980<br />
2013 3,064 4,156 7,220 25,666 79,916 1,150<br />
2014 2,427 3,369 5,796 20,288 57,654 647<br />
2015 3,075 6,201 9,276 41,130 117,653 1,950<br />
ALL<br />
Sets on all types of schools<br />
Lances sobre todos tipos de cardumen<br />
2000 6,005 18,420 24,425 253,263 205,647 95,282<br />
2001 4,849 18,574 23,423 383,936 143,165 60,518<br />
2002 5,805 21,503 27,308 412,286 153,546 57,421<br />
2003 7,980 24,348 32,328 383,279 273,968 53,052<br />
2004 5,584 22,465 28,049 272,557 197,824 65,471<br />
2005 6,748 24,981 31,729 268,101 263,229 67,895<br />
2006 7,347 24,228 31,575 166,631 296,268 83,838<br />
2007 6,229 21,939 28,168 170,016 208,295 63,450<br />
2008 6,590 22,111 28,701 185,057 296,603 75,028<br />
2009 5,129 22,096 27,225 236,772 230,523 76,799<br />
2010 4,040 21,930 25,970 251,009 147,192 57,752<br />
2011 5,378 21,707 27,085 206,851 276,035 56,512<br />
2012 6,063 22,199 28,262 198,017 266,215 66,020<br />
2013 6,145 22,930 29,075 218,187 278,560 49,487<br />
2014 6,285 23,528 29,813 233,973 261,578 60,453<br />
2015 6,478 26,606 33,084 245,183 329,280 63,229
48<br />
TABLE A-8. Types of floating objects involved in sets by vessels of >363 t carrying capacity. The 2015<br />
data are preliminary.<br />
TAB<strong>LA</strong> A-8. Tipos de objetos flotantes sobre los que realizaron lances buques de >363 t de capacidad de<br />
acarreo. Los datos de 2015 son preliminares.<br />
OBJ<br />
Flotsam<br />
Naturales<br />
FADs<br />
Plantados<br />
Unknown<br />
Desconocido<br />
Total<br />
No. % No. % No. %<br />
2000 488 13.1 3,187 85.8 38 1.0 3,713<br />
2001 592 10.4 5,058 89.1 24 0.4 5,674<br />
2002 778 13.5 4,966 86.1 27 0.5 5,771<br />
2003 715 13.1 4,722 86.5 20 0.4 5,457<br />
2004 586 11.8 4,370 87.6 30 0.6 4,986<br />
2005 603 12.1 4,281 85.8 108 2.2 4,992<br />
2006 697 10.2 6,123 89.2 42 0.6 6,862<br />
2007 597 10.2 5,188 88.6 72 1.2 5,857<br />
2008 560 8.4 6,070 91.2 25 0.4 6,655<br />
2009 322 4.5 6,728 95.1 27 0.4 7,077<br />
2010 337 5.3 6,038 94.3 24 0.4 6,399<br />
2011 563 8.1 6,342 91.6 16 0.2 6,921<br />
2012 286 3.8 7,321 96.2 3 < 0.1 7,610<br />
2013 274 3.4 7,759 96.5 5 0.1 8,038<br />
2014 283 3.2 8,490 96.7 4 < 0.1 8,777<br />
2015 273 2.9 9,093 96.9 19 0.2 9,385
49<br />
TABLE A-9. Reported nominal longline fishing effort (E; 1000 hooks), and catch (C; metric tons) of<br />
yellowfin, skipjack, bigeye, Pacific bluefin, and albacore tunas only, by flag, in the EPO.<br />
TAB<strong>LA</strong> A-9. Esfuerzo de pesca palangrero nominal reportado (E; 1000 anzuelos), y captura (C;<br />
toneladas métricas) de atunes aleta amarilla, barrilete, patudo, aleta azul del Pacífico, y albacora<br />
solamente, por bandera, en el OPO.<br />
LL<br />
CHN JPN KOR FRA(PYF) TWN USA OTR 1<br />
E C E C E C E C E C E C C<br />
1986 - - 160,572 111,672 30,778 17,432 - - 4,874 2,569 - - 68<br />
1987 - - 188,386 104,053 36,436 19,405 - - 12,267 5,335 - - 273<br />
1988 - - 182,709 82,383 43,056 10,172 - - 9,567 4,590 - - 234<br />
1989 - - 170,370 84,961 43,365 4,879 - - 16,360 4,962 - - 9<br />
1990 - - 178,414 117,923 47,167 17,415 - - 12,543 4,755 - - -<br />
1991 - - 200,374 112,337 65,024 24,644 - - 17,969 5,862 42 12 173<br />
1992 - - 191,300 93,011 45,634 13,104 199 89 33,025 14,142 325 106 128<br />
1993 - - 159,956 87,977 46,375 12,843 153 79 18,064 6,566 415 81 227<br />
1994 - - 163,999 92,606 44,788 13,250 1,373 574 12,588 4,883 303 25 523<br />
1995 - - 129,599 69,435 54,979 12,778 1,776 559 2,910 1,639 828 180 562<br />
1996 - - 103,649 52,298 40,290 14,121 2,087 931 5,830 3,553 510 182 185<br />
1997 - - 96,385 59,325 30,493 16,663 3,464 1,941 8,720 5,673 464 215 752<br />
1998 - - 106,568 50,167 51,817 15,089 4,724 2,858 10,586 5,039 1,008 406 1,176<br />
1999 - - 80,950 32,886 54,269 13,294 5,512 4,446 23,247 7,865 1,756 469 1,157<br />
2000 - - 79,311 45,216 33,585 18,759 8,090 4,382 18,152 7,809 737 204 4,868<br />
2001 13,056 5,162 102,219 54,775 72,261 18,201 7,445 5,086 41,920 20,060 1,438 238 15,612<br />
2002 34,889 10,398 103,919 45,401 96,273 14,370 943 3,238 78,018 31,773 613 138 10,258<br />
2003 43,289 14,548 101,227 36,187 71,006 15,551 11,098 4,101 74,460 28,328 1,314 262 11,595<br />
2004 15,889 4,033 76,824 30,936 55,861 14,540 13,757 3,030 49,979 19,535 1,049 166 9,193<br />
2005 16,896 3,681 65,081 25,712 15,798 12,284 13,356 2,515 38,536 12,229 2,397 557 5,244<br />
2006 588 969 56,525 21,432 27,472 7,892 11,786 3,220 38,134 12,375 234 121 10,027<br />
2007 12,226 2,624 45,972 20,514 10,548 6,037 9,672 3,753 22,244 9,498 2,689 436 6,424<br />
2008 11,518 2,984 44,547 21,375 3,442 4,256 10,255 3,017 12,544 4,198 6,322 1,369 9,231<br />
2009 10,536 3,435 41,517 21,492 18,364 7,615 10,686 4,032 13,904 6,366 5,141 852 11,731<br />
2010 11,905 3,590 47,807 21,017 25,816 10,477 8,976 3,139 24,976 10,396 8,879 1,480 11,400<br />
2011 37,384 9,983 52,194 18,682 25,323 7,814 9,514 3,192 21,065 9,422 7,359 1,233 7,616<br />
2012 55,508 14,462 55,587 22,214 20,338 8,286 8,806 3,589 20,519 11,924 5,822 986 14,237<br />
2013 70,411 18,128 48,825 19,096 31,702 10,248 11,189 3,303 18,353 11,722 10,765 2,133 10,388<br />
2014 78,851 24,282 40,410 17,074 22,695 9,132 10,572 3,291 16,830 10,435 11,276 2,194 6,325<br />
1 Includes the catches of—Incluye las capturas de: BLZ, CHL, COK, CRI, ECU, EU(ESP), GTM, HND, MEX, NIC, PAN,<br />
EU(PRT), SLV, VUT
50<br />
TABLE A-10. Numbers and well volumes, in cubic meters, of purse-seine and pole-and line vessels of<br />
the EPO tuna fleet. The data for 2015 are preliminary.<br />
TAB<strong>LA</strong> A-10. Número y volumen de bodega, en metros cúbicos, de buques cerqueros y cañeros de la<br />
flota atunera del OPO. Los datos de 2015 son preliminares.<br />
PS LP Total<br />
No. Vol. (m 3 ) No. Vol. (m 3 ) No. Vol. (m 3 )<br />
1986 165 130,530 17 2,066 182 132,596<br />
1987 173 148,713 29 2,383 202 151,096<br />
1988 185 154,845 39 3,352 224 158,197<br />
1989 176 141,956 32 3,181 208 145,137<br />
1990 172 143,877 23 1,975 195 145,852<br />
1991 152 124,062 22 1,997 174 126,059<br />
1992 158 116,619 20 1,807 178 118,426<br />
1993 151 117,593 15 1,550 166 119,143<br />
1994 166 120,726 20 1,726 186 122,452<br />
1995 175 123,798 20 1,784 195 125,582<br />
1996 180 130,774 17 1,646 197 132,420<br />
1997 194 147,926 23 2,127 217 150,053<br />
1998 202 164,956 22 2,216 224 167,172<br />
1999 208 178,724 14 1,642 222 180,366<br />
2000 205 180,679 12 1,220 217 181,899<br />
2001 204 189,088 10 1,259 214 190,347<br />
2002 218 199,870 6 921 224 200,791<br />
2003 214 202,381 3 338 217 202,719<br />
2004 218 206,473 3 338 221 206,811<br />
2005 220 212,419 4 498 224 212,917<br />
2006 225 225,166 4 498 229 225,664<br />
2007 227 225,359 4 380 231 225,739<br />
2008 219 223,804 4 380 223 224,184<br />
2009 221 224,632 4 380 225 225,012<br />
2010 202 210,025 3 255 205 210,280<br />
2011 208 213,237 3 339 211 213,576<br />
2012 209 217,687 4 464 213 218,151<br />
2013 203 212,087 3 268 206 212,355<br />
2014 226 230,379 2 226 228 230,605<br />
2015 243 247,978 1 125 244 248,103
51<br />
TABLE A-11a. Estimates of the numbers and well volume (cubic meters) of purse-seine (PS) and poleand-line<br />
(LP) vessels that fished in the EPO in 2014, by flag and gear. Each vessel is included in the total<br />
for each flag under which it fished during the year, but is included only once in the “Grand total”;<br />
therefore the grand total may not equal the sums of the individual flags.<br />
TAB<strong>LA</strong> A-11a. Estimaciones del número y volumen de bodega (metros cúbicos) de buques cerqueros<br />
(PS) y cañeros (LP) que pescaron en el OPO en 2014, por bandera y arte de pesca. Se incluye cada<br />
buque en los totales de cada bandera bajo la cual pescó durante el año, pero solamente una vez en el<br />
“Total general”; por consiguiente, los totales generales no equivalen necesariamente a las sumas de<br />
las banderas individuales.<br />
Well volume —Volumen de bodega (m 3 )<br />
Total<br />
Flag Gear<br />
1800<br />
Bandera Arte<br />
No. Vol. (m 3 )<br />
Number—Número<br />
COL PS 2 2 7 3 - 14 14,860<br />
ECU PS 36 33 22 8 12 111 88,957<br />
EU(ESP) PS - - - - 4 4 10,116<br />
GTM PS - - - 1 - 1 1,475<br />
MEX PS 3 4 18 20 - 45 54,206<br />
LP 2 - - - - 2 226<br />
NIC PS - - 3 3 - 6 8,478<br />
PAN PS - 2 4 4 4 14 19,865<br />
PER PS 1 2 - - - 3 1,437<br />
SLV PS - - - 1 3 4 7,892<br />
USA PS 8 - 1 - - 9 2,203<br />
V<strong>EN</strong> PS - - 7 7 1 15 20,890<br />
Grand total—<br />
Total general<br />
Grand total—<br />
Total general<br />
- : none—ninguno<br />
PS 50 43 62 47 24 226<br />
LP 2 - - - - 2<br />
PS + LP 52 43 62 47 24 228<br />
Well volume—Volumen de bodega (m 3 )<br />
PS 12,757 25,997 69,465 70,687 51,473 230,379<br />
LP 226 - - - - 226<br />
PS + LP 12,983 25,997 69,465 70,687 51,473 230,605
52<br />
TABLE A-11b. Estimates of the numbers and well volumes (cubic meters) of purse-seine (PS) and poleand-line<br />
(LP) vessels that fished in the EPO in 2015 by flag and gear. Each vessel is included in the total<br />
for each flag under which it fished during the year, but is included only once in the “Grand total”;<br />
therefore the grand total may not equal the sums of the individual flags.<br />
TAB<strong>LA</strong> A-11b. Estimaciones del número y volumen de bodega (metros cúbicos) de buques<br />
cerqueros (PS) y cañeros (LP) que pescaron en el OPO en 2015, por bandera y arte de pesca. Se<br />
incluye cada buque en los totales de cada bandera bajo la cual pescó durante el año, pero solamente<br />
una vez en el “Total general”; por consiguiente, los totales generales no equivalen necesariamente a<br />
las sumas de las banderas individuales.<br />
Well volume —Volumen de bodega (m 3 )<br />
Total<br />
Flag Gear<br />
1800<br />
Bandera Arte<br />
No. Vol. (m 3 )<br />
Number—Número<br />
COL PS 2 2 7 3 - 14 14,860<br />
ECU PS 35 33 23 8 13 112 91,651<br />
EU(ESP) PS - - - - 4 4 10,116<br />
GTM PS - - - 1 - 1 1,475<br />
MEX PS 3 4 18 22 - 47 57,502<br />
LP 1 - - - - 1 125<br />
NIC PS - - 3 3 - 6 8,478<br />
PAN PS - 2 4 4 4 14 19,794<br />
PER PS 3 3 - - - 6 2,818<br />
SLV PS - - - - 2 2 4,473<br />
USA PS 11 - 1 7 4 23 17,219<br />
V<strong>EN</strong> PS - - 6 7 1 14 19,592<br />
Grand total—<br />
Total general<br />
Grand total—<br />
Total general<br />
- : none—ninguno<br />
PS 54 44 62 55 28 243<br />
LP 1 - - - - 1<br />
PS + LP 55 44 62 55 28 244<br />
Well volume—Volumen de bodega (m 3 )<br />
PS 13,543 26,675 69,150 82,095 56,515 247,978<br />
LP 125 - - - - 125<br />
PS + LP 13,668 26,675 69,150 82,095 56,515 248,103
53<br />
TABLE A-12. Minimum, maximum, and average capacity, in thousands of cubic meters, of purse-seine<br />
and pole-and-line vessels at sea in the EPO during 2005-2014 and in 2015, by month.<br />
TAB<strong>LA</strong> A-12. Capacidad mínima, máxima, y media, en miles de metros cúbicos, de los buques<br />
cerqueros y cañeros en el mar en el OPO durante 2005-2014 y en 2015 por mes.<br />
Month<br />
2005-2014<br />
Mes Min Max Ave.-Prom.<br />
2015<br />
1 86.9 157.7 115.3 92.4<br />
2 150.7 175.3 158.3 181.1<br />
3 135.4 159.9 147.2 168.6<br />
4 142.8 165.0 153.7 173.6<br />
5 139.8 164.4 153.1 163.1<br />
6 154.9 175.0 160.4 173.1<br />
7 154.1 170.4 162.8 169.9<br />
8 62.2 123.6 105.2 117.6<br />
9 105.5 137.7 117.3 121.9<br />
10 150.7 172.2 164.3 186.7<br />
11 102.9 150.8 128.6 134.3<br />
12 45.9 105.8 63.9 57.8<br />
Ave.-Prom. 119.3 154.8 135.8 145.0
54<br />
LOS ATUNES, PECES PICUDOS, Y OTROS PECES PELÁGICOS <strong>EN</strong> EL<br />
OCÉANO PACÍFICO ORI<strong>EN</strong>TAL <strong>EN</strong> 2015<br />
A. La pesquería de atunes y peces picudos en el Océano Pacífico oriental ........................................... 54<br />
B. Atún aleta amarilla ........................................................................................................................... 74<br />
C. Atún barrilete ................................................................................................................................... 77<br />
D. Atún patudo ...................................................................................................................................... 87<br />
E. Atún aleta azul del Pacífico .............................................................................................................. 93<br />
F. Atún albacora ................................................................................................................................. 102<br />
G. Pez espada ...................................................................................................................................... 107<br />
H. Marlín azul ..................................................................................................................................... 110<br />
I. Marlín rayado ................................................................................................................................. 113<br />
J. Pez vela .......................................................................................................................................... 118<br />
K. Tiburón sedoso ............................................................................................................................... 123<br />
L. Consideraciones ecosistémicas ....................................................................................................... 161<br />
INTRODUCCIÓN<br />
El presente informe contiene un resumen de la pesquería atunera en el Océano Pacífico oriental (OPO),<br />
evaluaciones sumarias de las poblaciones más importantes de los atunes y peces picudos explotados en la<br />
pesquería, y una evaluación del ecosistema pelágico en el OPO, en 2015.<br />
Se basa en datos disponibles al personal de la CIAT en marzo de 2016. Como resultado, algunas de las<br />
tablas de datos de 2015 son incompletas, y todos los datos de 2014 y 2015 deben ser considerados<br />
preliminares.<br />
Se expresa el peso de capturas y descartes en toneladas métricas (t). En las tablas, 0 en una casilla<br />
significa ningún esfuerzo o una captura de menos de 0,5 t; - significa que no se tomaron datos, y *<br />
significa datos faltantes o no disponibles. Se usan las siglas siguientes:<br />
Especies:<br />
ALB Atún albacora (Thunnus alalunga)<br />
BET Atún patudo (Thunnus obesus)<br />
BIL Peces picudos istiofóridos no identificados<br />
BKJ Atún barrilete negro (Euthynnus lineatus)<br />
BLM Marlín negro (Makaira indica)<br />
BUM Marlín azul (Makaira nigricans)<br />
BZX Bonito (Sarda spp.)<br />
CAR Chondrichthyes, peces cartilaginosos nep 3<br />
CGX Carángidos (Carangidae)<br />
DOX Dorados (Coryphaena spp.)<br />
MLS Marlín rayado (Kajakia audax)<br />
MZZ Osteichthyes, peces marinos nep<br />
PBF Atún aleta azul del Pacífico (Thunnus<br />
orientalis)<br />
SFA Pez vela del Indo-Pacífico (Istiophorus<br />
platypterus)<br />
SKJ Atún barrilete (Katsuwonus pelamis)<br />
SKX Elasmobranquios no identificados<br />
SSP Marlín trompa corta (Tetrapturus<br />
angustirostris)<br />
SWO Pez espada (Xiphias gladius)<br />
TUN Atunes no identificados<br />
YFT Atún aleta amarilla (Thunnus albacares)<br />
Artes de pesca:<br />
FPN Almadraba<br />
GN Red de trasmallo<br />
HAR Arpón<br />
LL Palangre<br />
LP Caña<br />
LTL Curricán<br />
LX Sedal y anzuelo<br />
OTR Otras 4<br />
NK Desconocido<br />
PS Red de cerco<br />
RG Deportivo<br />
TX Red de arrastre<br />
3 no especificado en otra partida<br />
4 Usado para agrupar artes conocidas
55<br />
Áreas oceánicas:<br />
OPO Océano Pacífico oriental<br />
WCPO Océano Pacífico occidental y central<br />
Tipos de lance:<br />
DEL Delfín<br />
NOA Peces no asociados<br />
OBJ Objeto flotante<br />
LOG: Natural<br />
FAD: Plantado<br />
Banderas:<br />
Miembros y no Miembros Cooperantes de la<br />
CIAT<br />
BLZ Belice<br />
BOL Bolivia<br />
CAN Canadá<br />
CHN China<br />
COL Colombia<br />
CRI Costa Rica<br />
ECU Ecuador<br />
EU Unión Europea<br />
EU<br />
(CYP)<br />
Chipre<br />
EU (ESP) España<br />
EU (PRT) Portugal<br />
FRA Francia<br />
GTM Guatemala<br />
HND Honduras<br />
IDN Indonesia<br />
JPN Japón<br />
KIR Kiribati<br />
KOR República de Corea<br />
LBR Liberia<br />
MEX México<br />
NIC Nicaragua<br />
PAN Panamá<br />
PER Perú<br />
SLV El Salvador<br />
TWN Taipéi Chino<br />
USA Estados Unidos de América<br />
V<strong>EN</strong> Venezuela<br />
VUT Vanuatu<br />
Otras banderas<br />
CHL Chile<br />
COK Islas Cook<br />
CYM Islas Caimán<br />
NZL Nueva Zelanda<br />
RUS Rusia<br />
VCT San Vicente y Granadinas<br />
UNK Desconocido<br />
Evaluación del stock:<br />
B<br />
Biomasa<br />
C Captura<br />
CPUE Captura por unidad de esfuerzo<br />
F<br />
Tasa de mortalidad por pesca<br />
MSY Rendimiento máximo sostenible<br />
S<br />
Índice de biomasa reproductora<br />
SBR Cociente de biomasa reproductora<br />
SSB Biomasa de reproductores
56<br />
A. <strong>LA</strong> PESQUERÍA DE ATUNES Y PECES PICUDOS <strong>EN</strong> EL OCÉANO PACÍFICO<br />
ORI<strong>EN</strong>TAL<br />
1. Capturas y descargas de atunes, peces picudos, y especies asociadas .............................................. 56<br />
1.1. Capturas por especie......................................................................................................................... 57<br />
1.2. Distribución de las capturas de atunes .............................................................................................. 60<br />
1.3. Composición por tamaño de las capturas de atunes .......................................................................... 61<br />
1.4. Capturas de atunes y bonitos, por bandera y arte .............................................................................. 63<br />
2. Esfuerzo de pesca ............................................................................................................................. 63<br />
2.1. Pesca de cerco .................................................................................................................................. 63<br />
2.2. Pesca palangrera ............................................................................................................................... 64<br />
3. Las flotas .......................................................................................................................................... 64<br />
3.1. Las flotas de cerco y de caña ............................................................................................................ 64<br />
3.2. Otras flotas del OPO ........................................................................................................................ 65<br />
En este documento se presenta un resumen de las pesquerías de las especies amparadas por la Convención<br />
de la CIAT (los atunes y otros peces capturados por buques atuneros) en el Océano Pacífico oriental<br />
(OPO). Las más importantes de éstas son los escómbridos (familia Scombridae), que incluyen los atunes,<br />
bonitos, carites y caballas. Las especies principales de atunes capturadas son el aleta amarilla, barrilete,<br />
patudo y albacora, con capturas menores de los atunes aleta azul del Pacífico y barrilete negro y de<br />
melvas; se capturan también otros escómbridos, como el bonito y el peto.<br />
El presente documento abarca también otras especies capturadas por buques atuneros en el OPO: peces<br />
picudos (pez espada, marlines y pez vela), carángidos (jureles y salmón), dorado, elasmobranquios<br />
(tiburones y rayas) y otros peces.<br />
La mayor parte de las capturas es realizada por las flotas de cerco y palangrera; la flota cañera y varias<br />
pesquerías artesanales y recreacionales toman un pequeño porcentaje de las capturas totales.<br />
Se dispone de datos detallados de las pesquerías cerquera y cañera; los datos de las pesquerías<br />
palangreras, artesanales y recreacionales son incompletos.<br />
El Registro Regional de Buques de la CIAT contiene detalles de los buques autorizados para pescar<br />
atunes en el OPO. La CIAT cuenta con registros detallados de la mayoría de los buques cerqueros y<br />
cañeros que pescan atunes aleta amarilla, barrilete, patudo y/o aleta azul del Pacífico en el OPO. El<br />
Registro es incompleto para buques pequeños. Incluye la mayoría de los buques palangreros grandes<br />
(eslora total >24 m) que pescan en el OPO y en otros océanos.<br />
Los datos en el presente informe provienen de varias fuentes, entre ellas los cuadernos de bitácora de los<br />
buques, datos de observadores, registros de descargas provistos por empresas enlatadoras y otros<br />
procesadores, registros de importaciones y exportaciones, informes de los gobiernos y otras entidades, y<br />
estimaciones derivadas del programa de muestreo de especies y composición por talla.<br />
1. CAPTURAS Y DESCARGAS DE ATUNES, PECES PICUDOS, Y ESPECIES ASOCIADAS<br />
Estimar la captura total de una especie de pez es difícil, por varios motivos. Pescado es descartado en el<br />
mar, y los datos de algunas artes de pesca son incompletos. Desde 1993 los observadores han tomado<br />
datos sobre pescado descartado en el mar por buques cerqueros de más de 363 toneladas métricas (t) de<br />
capacidad de acarreo, lo cual permite una estimación más precisa de las cantidades totales de pescado<br />
capturadas por la flota de cerco. Las estimaciones de la cantidad total de la captura que se descarga (en lo<br />
sucesivo la “captura retenida”) se basan principalmente en datos de descarga. A partir del Informe de la<br />
Situación de la Pesquería 3, que describe la pesquería en 2004, los datos de descargas de buques<br />
cerqueros y cañeros son ajustados con base en las estimaciones de composición por especies para los<br />
atunes aleta amarilla, barrilete, y patudo. El programa actual de muestreo de composición por especies,
57<br />
descrito en la Sección 1.3.1, comenzó en 2000, y por lo tanto los datos de captura de 2000-2015 son<br />
ajustados con base en las estimaciones obtenidas para cada año, por bandera. Para ajustar los datos de<br />
captura de los años previos, se aplicó la proporción media de especies de las estimaciones de 2000-2004,<br />
por bandera, y se sumó para todas las banderas. En general, esto ha incrementado las capturas estimadas<br />
de patudo, y reducido aquéllas de aleta amarilla y barrilete. Todos estos ajustes son preliminares, y<br />
podrían ser mejorados en el futuro. Todos los datos de 2014 y 2015 de las pesquerías cerquera y cañera<br />
son provisionales.<br />
Se obtienen los datos de las capturas retenidas de la mayoría de los buques palangreros grandes de los<br />
gobiernos de las naciones que pescan atunes en el OPO. Los buques palangreros, particularmente los más<br />
grandes, dirigen su esfuerzo principalmente hacia los atunes patudo, aleta amarilla, y albacora, o el pez espada.<br />
Los datos de los buques palangreros pequeños, artesanales y otros que pescan atunes, peces picudos, dorado, y<br />
tiburones en el OPO fueron obtenidos directamente de los gobiernos, de los cuadernos de bitácora, o de<br />
informes publicados por los gobiernos. Los datos del Pacífico occidental y central (WCPO) fueron provistos<br />
por el Programa de Pesquerías Oceánicas de la Secretaría de la Comunidad del Pacífico (SPC). Todos los datos<br />
de captura en el OPO con palangre y otras artes en 2014 y 2015 son preliminares.<br />
Los datos de todas estas fuentes fueron compilados en una base de datos por el personal de la CIAT y<br />
resumidos en el presente informe. En los últimos años, el personal de la CIAT ha incrementado sus<br />
esfuerzos por compilar datos sobre las capturas de atunes, peces picudos, y otras especies capturadas con<br />
otras artes, como curricán, arpón, y red de transmalle, y artes recreacionales. En la Tabla A-1 se presentan<br />
las capturas totales de aleta amarilla, barrilete, y patudo en el Océano Pacífico entero, estimadas de todas<br />
las fuentes mencionadas; son tratadas en mayor detalle en las secciones siguientes.<br />
En las Tablas A-2a-c se presentan estimaciones de las capturas anuales retenidas y descartadas de atunes<br />
y otras especies capturadas por buques atuneros en el OPO durante 1986-2015. En las Tablas A-3a-e se<br />
presentan las capturas de atunes aleta amarilla, barrilete, y patudo, por arte y bandera, durante 1986-2015,<br />
y en la Tabla A-4 se resumen por bandera las capturas cerqueras y cañeras de atunes y bonitos durante<br />
2014-2015. No se restringió la pesca del atún en el OPO durante 1988-1997, pero las capturas de la<br />
mayoría de las especies fueron afectadas por las restricciones de la pesca durante partes, o la totalidad, del<br />
segundo semestre del año durante 1998-2014. Además, la reglamentación de aquellos cerqueros que<br />
dirigen su esfuerzo hacia atunes asociados a delfines afectó el modo de operación de esos buques,<br />
especialmente desde fines de los años 1980 (ver Sección 3).<br />
Las capturas fueron afectadas también por perturbaciones climáticas, tales como los importantes eventos<br />
de El Niño que ocurrieron durante 1982-1983 y 1997-1998. Estos redujeron la vulnerabilidad de los peces<br />
a la captura con red de cerco debido a la mayor profundidad de la termoclina, pero aparentemente no<br />
tuvieron ningún efecto sobre las capturas palangreras. El reclutamiento de aleta amarilla suele ser mayor<br />
después de un evento de El Niño.<br />
1.1. Capturas por especie<br />
1.1.1. Atún aleta amarilla<br />
En la Tabla A-1 se presentan las capturas anuales de aleta amarilla durante 1986-2015. Los totales del<br />
OPO de 1993-2015 incluyen los descartes de los buques cerqueros de capacidad de acarreo de más de 363<br />
t. El evento de El Niño de 1982-1983 causó una reducción de las capturas en esos años, mientras que las<br />
capturas en el resto del Pacífico aparentemente no fueron afectadas. Aunque el alcance del Niño de 1997-<br />
1998 fue mayor, no tuvo el mismo efecto sobre las capturas de aleta amarilla en el OPO. En el OPO, las<br />
capturas aumentaron constantemente a un pico de 443 mil t en 2002. Disminuyeron sustancialmente en<br />
2004, al nivel más bajo del periodo de 2006-2008, 40% de las capturas más altas del período de 2001-<br />
2003. La captura de 2015 de 246 mil t es mayor que el promedio del quinquenio previo (234 mil t). En el<br />
Pacífico occidental y central, las capturas de aleta amarilla alcanzaron un nuevo récord de 611 mil t en<br />
2014, rebasando el récord previo de 600 mil t en 2008.
58<br />
En la Tabla A-2a se presentan las capturas retenidas anuales de aleta amarilla en el OPO por buques<br />
cerqueros y cañeros durante 1986-2015. La captura retenida anual media durante 2000-2014 fue 257 mil t<br />
(rango: 167 a 413 mil t); la estimación preliminar de la captura retenida en 2015, 245 mil t, fue 5% mayor<br />
que aquella de 2014, pero 5% menor que el promedio de 2000-2014. Los descartes medios de aleta<br />
amarilla en el mar durante 2000-2014 se cifraron en un 1% (rango: 0,1 a 2,4%) de la captura total<br />
cerquera (capturas retenidas más descartes) de la especie (Tabla A-2a).<br />
En la Tabla A-2a se presentan las capturas retenidas anuales de aleta amarilla en el OPO por buques<br />
palangreros durante 1986-2015. Durante 1990-2003 la capturo promedio fue unas 23 mil t (rango: 12 a 50<br />
mil t), o un 8% de las capturas retenidas totales de la especie. Las capturas palangreras disminuyeron<br />
bruscamente a partir de 2005, con un promedio anual de 10 mil t (rango: 8 a 13 mil t), o un 4% de las<br />
capturas totales retenidas hasta 2014. El aleta amarilla es capturado también por buques de pesca<br />
recreacional, incidentalmente en redes de transmalle, y en pesquerías artesanales. En la columna de ‘Otras<br />
artes’ (OTR) de la Tabla A-2a se presentan estimaciones de estas capturas; durante 2000-2014 fueron en<br />
promedio unas mil t.<br />
1.1.2. Atún barrilete<br />
En la Tabla A-1 se presentan las capturas anuales de barrilete durante 1986-2015. La mayoría de la<br />
captura de barrilete en el Océano Pacífico proviene del Pacífico occidental y central. Antes de 1999, la<br />
captura anual media en el Pacífico occidental y central fue aproximadamente 900 mil; a partir de 1999, las<br />
capturas aumentaron constantemente de 1,1 millones de toneladas a un récord de 2 millones en 2014. En<br />
el OPO, las capturas anuales máximas ocurrieron entre 2003 y 2015, variando de 153 a 333 mil t, el<br />
récord logrado en 2015.<br />
En la Tabla A-2a se presentan las capturas retenidas anuales de barrilete en el OPO por buques cerqueros<br />
y cañeros durante 1986-2015. La captura retenida anual media durante 2000-2014 fue 234 mil t (rango:<br />
144 a 297 mil t). La estimación preliminar de la captura retenida de barrilete en 2015, 329 mil t, es 41%<br />
mayor que el promedio de 2000-2014, y 11% mayor que la captura retenida récord de 2008. Los descartes<br />
de barrilete en el mar disminuyeron cada año durante el período, de 11% en 2000 a menos de 1% en 2014.<br />
Durante el periodo un 4% de la captura total de la especie fue descartado en el mar (Tabla A-2a).<br />
En el OPO se capturan pequeñas cantidades de barrilete con palangre y otros tipos de arte (Tabla A-2a).<br />
1.1.3. Atún patudo<br />
En la Tabla A-1 se presentan las capturas anuales de patudo durante 1986-2015. En general, las capturas<br />
en el OPO y en el Pacífico occidental y central han aumentado, pero con fluctuaciones considerables. En<br />
el OPO, la captura media durante el periodo fue 104 mil t, con una mínima de 73 mil t en 1989 y una<br />
máxima de 149 mil t en 2000. En el Pacífico occidental y central, las capturas de patudo aumentaron a<br />
más de 77 mil t a fines de los años 1970, disminuyeron a principios de los años 1980, y luego aumentaron<br />
constantemente a 111 mil t en 1996. En 1997 se disparó a 153 mil t, y alcanzó un pico de 178 mil t en<br />
2004. Desde entonces ha fluctuado entre 130 y 155 mil t.<br />
En la Tabla A-2a se presentan las capturas retenidas anuales de patudo en el OPO por buques<br />
cerqueros y cañeros durante 1986-2015. Durante 1993-1994 el uso de dispositivos agregadores de<br />
peces (DAP, o plantados), colocados en el agua por los pescadores para atraer a los atunes, casi se<br />
duplicó, y siguió aumentando en los años siguientes. Esto resultó en mayores capturas de patudo por<br />
buques cerqueros. Antes de este aumento, la captura retenida media anual de patudo por buques<br />
cerqueros en el OPO fue alrededor de 5 mil t (Tabla A-2a). Como consecuencia del desarrollo de la<br />
pesquería sobre plantados, las capturas de patudo crecieron de 10 mil t en 1993 a 35 mil t en 1994, y<br />
siguieron aumentando a entre 44 y 95 mil t durante 1995-2014. La estimación preliminar de la<br />
captura retenida en el OPO en 2015 es de 63 mil t.<br />
Durante 2000-2014 disminuyó consistentemente el porcentaje de la captura cerquera de la especie
59<br />
descartado en el mar, de 5% en 2000 a menos de 1% en 2014, para una tasa media de descarte de<br />
aproximadamente 2,1%. No se han reportado capturas de patudo por buques cañeros en los últimos años.<br />
Entre 1986 y 1993, antes del aumento del uso de plantados, los buques palangreros capturaban en promedio el<br />
95% del patudo en el OPO, (promedio 88 mil t; rango 71 a 104 mil t). Durante 2000-2014, este promedio<br />
disminuyó a 38%, con un mínimo de 25% en 2006 (promedio: 42 mil t; rango: 26 a 74 mil t; Tabla A-2a). La<br />
estimación preliminar de la captura palangrera en el OPO en 2015 es de 38 mil t (Tabla A-2a).<br />
En el OPO se capturan pequeñas cantidades de patudo con otros tipos de arte (Tabla A-2a).<br />
1.1.4. Atún aleta azul<br />
En la Tabla A-2a se presentan las capturas de atún aleta azul del Pacífico en el OPO durante 1986-2015,<br />
por arte de pesca. Los buques cerqueros y cañeros tomaron más del 94% de la captura total retenida en el<br />
OPO durante 2000-2014. Durante este período la captura anual retenida de la especie en el OPO por<br />
buques cerqueros fue en promedio 4,7 mil t (rango: 1,2 a 9,9 mil t). La estimación preliminar de la<br />
captura cerquera retenida de aleta azul en 2015, 3,2 mil t, es ligeramente menor que el promedio de 2000-<br />
2014 (Tabla A-2a).<br />
En la Tabla A-5a se presentan las capturas de aleta azul del Pacífico en el Océano Pacífico entero, por<br />
bandera y arte. Los datos, obtenidos del Comité Científico Internacional sobre los Atunes y Especies<br />
Afines en el Océano Pacífico Norte (ISC), son desglosados por nación o entidad pesquera, sin tener en<br />
cuenta la región del Pacífico donde fue capturado el pescado.<br />
Las capturas de atún aleta azul del Pacífico con artes recreativas en el OPO son reportadas en número de<br />
peces individuales capturados, mientras todas las otras artes reportan sus capturas en peso (toneladas). Se<br />
convierten estos datos en número a toneladas para inclusión en las capturas totales por todas las artes en el<br />
OPO. En la Tabla A-5b se presentan los datos originales de 1986-2014, en número de peces.<br />
1.1.5. Atún albacora<br />
En la Tabla A-6 se presentan las capturas de albacora en el OPO, por arte y zona (al norte y al sur de la línea<br />
ecuatorial). En la Tabla A-2a se presentan las capturas de albacora en el OPO, por arte. Una porción<br />
importante de la captura de la especie es tomada con curricán, incluido en otras artes (OTR) en la Tabla A-2a.<br />
1.1.6. Otros atunes y especies afines<br />
Los atunes aleta amarilla, barrilete, y patudo forman el componente más importante de las capturas<br />
retenidas de la flota cerquera y cañera en el OPO, pero otros atunes y especies afines, como el barrilete<br />
negro, bonito, peto, y las melvas, contribuyen a la captura general de la región. En la Tabla A-2a se<br />
presentan estimaciones de las capturas anuales retenidas y descartadas de estas especies durante 1986-<br />
2015. Las capturas incluidas en la categoría de “atunes no identificados” (TUN) en la Tabla A-2a<br />
contienen algunas capturas reportadas por especie (melvas o petos) junto con los atunes no identificados.<br />
La captura retenida total de estas otras especies en estas pesquerías fue 4,7 mil toneladas en 2015, menos<br />
que el promedio de 2000-2014 de 6,8 mil t (rango: 500 t a 19 mil t).<br />
El barrilete negro es también capturado con otras artes en el OPO, principalmente en la pesca artesanal<br />
costera. El bonito es asimismo capturado en las pesquerías artesanales, y ha sido reportado como captura<br />
por buques palangreros en algunos años.<br />
1.1.7. Peces picudos<br />
En la Tabla A-2b se presentan datos de captura de los peces picudos (pez espada, marlín azul, negro,<br />
rayado y trompa corta, y pez vela).<br />
En general, los delfines, tortugas marinas, ballenas tiburón, y peces pequeños son los únicos animales<br />
capturados en la pesquería de cerco que son liberados vivos. En versiones previas del presente informe,<br />
todos los peces picudos capturados en esas pesquerías son clasificados como descartados muertos. Si la
60<br />
gran mayoría de los individuos o especies capturados incidentalmente es descartada, la diferencia entre<br />
las capturas y los descartes no son significativas para esas especies, pero a medida que aumenta la tasa de<br />
retención de especies antes descartadas, parte de la captura incidental cambia a ser captura, y la distinción<br />
se vuelve importante. Como resultado de una revisión en 2010, esto ha sido aclarado en la Tabla A-2b con<br />
una columna adicional de captura retenida al lado de la columna de descartes.<br />
El pez espada es capturado en el OPO con palangres a gran escala y artesanales, red de transmalle, arpón<br />
y, de vez en cuando, por buques recreacionales. Durante 1999-2008 la captura anual media palangrera de<br />
pez espada fue 12 mil t, pero durante 2012-2014 casi se duplicó, a más de 22 ml t. No queda claro si esto<br />
se debe a una mayor abundancia de la especie o a un aumento del esfuerzo dirigido hacia la misma.<br />
Otros peces picudos son capturados con palangres a gran escala y artesanales y por artes recreacionales.<br />
Las capturas palangreras anuales medias de marlín azul y marlín rayado durante 2000-2014 fueron unas<br />
3,2 mil y 1,9 mil t, respectivamente. Se capturan cantidades menores de otros peces picudos con palangre.<br />
Desgraciadamente, se cuenta con muy poca información sobre las capturas recreacionales de peces picudos,<br />
pero se cree que son sustancialmente menores que las capturas comerciales de todas estas especies.<br />
Se capturan pequeñas cantidades de peces picudos con red de cerco; algunos son retenidos, y otros son<br />
considerados descartados, aunque es posible que parte de esta captura sea descargada sin ser reportada. Se<br />
incluyen estos datos en la Tabla A-2b. Durante 2000-2014 los buques cerqueros capturaron<br />
aproximadamente el 1% de la captura total de peces picudos en el OPO.<br />
1.1.8. Otras especies<br />
En la Tabla A-2c se presentan datos de las capturas y descartes de carángidos (jureles y salmón), dorado,<br />
elasmobranquios (tiburones y rayas) y otros peces capturados en el OPO.<br />
En la Tabla A-2c se clasifican en retenidas o descartadas las capturas incidentales en la pesquería de cerco.<br />
Como resultado de una revisión en 2010, se modificó la asignación de las capturas en estas categorías.<br />
Las capturas de dorado son descargadas principalmente en puertos de América Central y del Sur. Aunque<br />
las capturas reportadas han alcanzado hasta 71 mil toneladas en los últimos años, a menudo no se reporta<br />
el tipo de arte usado.<br />
1.2. Distribución de las capturas de atunes<br />
1.2.1. Capturas cerqueras<br />
En las Figuras A-1a, A-2a, y A-3a ilustran las distribuciones anuales medias de las capturas cerqueras de<br />
aleta amarilla, barrilete y patudo, por tipo de lance, en el OPO durante 2010-2014, y en las Figuras A-<br />
1b, A-2b, y A-3b estimaciones preliminares para 2015.<br />
La mayor parte de las capturas de aleta amarilla en 2015 provino de al norte del paralelo de 5°N en lances<br />
asociados a delfines, y en el área entre Galápagos y el litoral del continente en todos los tres tipos de<br />
lance. Aunque típicamente se encuentra aleta amarilla en cardúmenes no asociados cerca de la costa, se<br />
realizaron capturas moderadas muy lejos de la costa alrededor del meridiano de 135°O al sur de la línea<br />
ecuatorial. Al igual que en años previos, la mayor parte de la captura de aleta amarilla al sur del paralelo<br />
de 5°N provino de lances sobre objetos flotantes.<br />
La mayor parte de las capturas de barrilete en 2015 provino de al sur del paralelo de 5°N, en lances sobre<br />
objetos flotantes y no asociados cerca de la costa. El área frente a la costa de Perú produjo las mayores<br />
capturas de barrilete en 2015, que fueron mayores que en años previos. Se logró una captura de barrilete<br />
en alta mar mayor que lo normal alrededor del meridiano de 135°O al sur de la línea ecuatorial en lances<br />
no asociados.<br />
No se captura a menudo patudo al norte de aproximadamente 7°N, y las capturas de la especie han<br />
disminuido en las zonas costeras de América del Sur desde hace varios años. Con el desarrollo de la
61<br />
pesquería sobre plantados, la importancia relativa de las zonas costeras ha disminuido, mientras que la de<br />
las zonas de altura ha aumentado. La mayoría de las capturas de patudo provienen de lances sobre<br />
plantados entre 5°N y 5°S.<br />
1.2.2. Capturas palangreras<br />
Las bases de datos de la CIAT contienen datos sobre las distribuciones espacial y temporal de las capturas<br />
en el OPO de las flotas palangreras de aguas lejanas de China, la República de Corea, España, Estados<br />
Unidos, Japón, Polinesia Francesa, Taipéi Chino, y Vanuatu. Los atunes patudo y aleta amarilla forman la<br />
mayor parte de las capturas de la mayoría de estos buques. En la Figura A-4 se ilustra la distribución de<br />
las capturas de atunes de estas dos especies por buques de palangre de China, Corea, Japón, y Taipéi<br />
Chino en el Océano Pacífico durante 2010-2014. Se presentan datos de la pesquería palangrera japonesa<br />
en el OPO durante 1956-2007 en los Boletines de la CIAT que describen esa pesquería.<br />
1.3. Composición por tamaño de las capturas de atunes<br />
1.3.1. Pesquerías de cerco, de caña, y recreacional<br />
Las muestras de frecuencia de talla son la fuente básica de los datos usados para estimar la composición<br />
por talla y edad de las distintas especies de peces en las descargas. Esta información es necesaria para<br />
obtener estimaciones de la composición de las poblaciones por edad, usadas para varios propósitos, entre<br />
ellos el modelado integrado que el personal ha usado en los últimos años. Los resultados de estudios de<br />
este tipo han sido descritos en diversos Boletines de la CIAT, en sus Informes Anuales de 1954 a 2002, y<br />
en sus Informes de Evaluación de Poblaciones.<br />
Las muestras de frecuencia de talla de aleta amarilla, barrilete, patudo, aleta azul del Pacífico y,<br />
ocasionalmente, barrilete negro de las capturas de buques cerqueros, cañeros, y recreacionales en el OPO<br />
son tomadas por el personal de la CIAT en puertos de descarga en Ecuador, Estados Unidos, México,<br />
Panamá, y Venezuela. El muestreo de las capturas de aleta amarilla y barrilete fue iniciado en 1954, el de<br />
aleta azul en 1973, y el de patudo en 1975, y continúa actualmente.<br />
En el Informe Anual de la CIAT de 2000 y los Informes de Evaluación de Stocks 2 y 4 se describen los<br />
métodos de muestreo de las capturas de atún. En breve, se selecciona para el muestreo pescado en las<br />
bodegas de buques cerqueros y cañeros solamente si todo el pescado en la bodega fue capturado durante<br />
un solo mes, en un solo tipo de lance (delfín, objeto flotante, o no asociado), y en la misma zona de<br />
muestreo. Se clasifican estos datos por pesquería (Figura A-5), con base en las evaluaciones más recientes<br />
de las poblaciones realizadas por el personal.<br />
En este informe se presentan datos de pescado capturado durante 2010-2015. Para cada especie, excepto<br />
el aleta azul y el barrilete negro, se presentan dos histogramas de frecuencia de talla: el primero presenta<br />
los datos por estrato (arte de pesca, tipo de lance, y zona) para 2015, y el segundo ilustra los datos<br />
combinados para cada año del período de 2010-2015. En el caso del aleta azul, se ilustran las capturas<br />
comerciales y recreacionales de 2007-2012 combinadas. En el caso del barrilete negro, los histogramas<br />
ilustran as capturas por artes comerciales durante 2010-2015. Hubo muy poca captura por buques cañeros<br />
en 2013, 2014, y 2015, y no se obtuvo ninguna muestra de los mismos.<br />
Para la evaluación de las poblaciones de aleta amarilla se definen nueve pesquerías de cerco (cuatro<br />
asociadas a objetos flotantes, tres asociadas a delfines, dos de atunes no asociados) y una de caña (Figura<br />
A-5). La última abarca todas las 13 zonas de muestreo. De las 958 bodegas muestreadas durante 2015,<br />
686 contenían aleta amarilla. En la Figura A-6a se ilustran las composiciones por talla estimadas del<br />
pescado capturado durante 2012. La mayoría de la captura de aleta amarilla provino de lances asociados a<br />
delfines en las pesquerías sobre delfines del norte y costera, principalmente en el segundo trimestre. La<br />
mayoría del aleta amarilla grande (>110 cm) fue capturado en las pesquerías sobre delfines del norte y<br />
costera durante los trimestres segundo y tercero, y en la pesquería no asociada del sur en el cuarto<br />
trimestre. Fueron capturados aletas amarillas más pequeños (
62<br />
sobre objetos flotantes ecuatorial durante el cuarto trimestre.<br />
En la Figura A-6b se ilustra la composición por talla estimada del aleta amarilla capturado por todas las<br />
pesquerías combinadas durante 2010-2015. El peso medio del aleta amarilla capturado en 2015 (9,0 kg)<br />
fue entre los más bajos del sexenio, mucho menos que la máxima de 13,3 kg en 2012.<br />
Para la evaluación de las poblaciones de barrilete se definen siete pesquerías de cerco (cuatro asociadas a<br />
objetos flotantes, dos de atunes no asociados, una asociada a delfines) y una de caña (Figura A-5). Las dos<br />
últimas abarcan todas las 13 zonas de muestreo. De las 958 bodegas muestreadas, 628 contenían barrilete. En<br />
la Figura A-7a se ilustran las composiciones por talla estimadas del pescado capturado durante 2015. Fueron<br />
capturadas grandes cantidades de barrilete de entre 35 y 50 cm de talla en la pesquería sobre objetos flotantes<br />
del sur en todos los cuatro trimestres, y en menor grado en la pesquería sobre objetos flotantes del norte,<br />
ecuatorial, y costera en los trimestres segundo y tercero, así como en la pesquería no asociada del sur durante<br />
los trimestres primero y cuarto. Fueron capturados barriletes más grandes, de entre 65 y 80 cm de talla, en la<br />
pesquería sobre objetos flotantes ecuatorial durante los trimestres tercero y cuarto, en la pesquería sobre<br />
objetos flotantes del sur durante los trimestres tercero y cuarto.<br />
En la Figura A-7b se ilustra la composición por talla estimada del barrilete capturado por todas las<br />
pesquerías combinadas durante 2010-2015. El peso medio del barrilete en 2015 (1,9 kg) es el más bajo<br />
del sexenio, muy inferior al récord de 2,5 kg en 2013.<br />
Para la evaluación de las poblaciones de patudo se definen seis pesquerías de cerco (cuatro asociadas a<br />
objetos flotantes, una de atunes no asociados, una asociada a delfines) y una de caña (Figura A-5). Las<br />
tres últimas abarcan todas las 13 zonas de muestreo. De las 958 bodegas muestreadas, 209 contenían<br />
patudo. En la Figura A-8a se ilustra la composición por talla estimada del patudo capturado durante 2015.<br />
Se capturó patudo pequeño de entre 40 y 80 cm de talla principalmente en la pesquería sobre objetos<br />
flotantes del norte durante el segundo trimestre, y en la pesquería sobre objetos flotantes del sur durante el<br />
cuarto trimestre. Fueron capturados patudos más grandes (>100 cm) principalmente en la pesquería sobre<br />
objetos flotantes del sur en el cuarto trimestre.<br />
En la Figura A-8b se ilustra la composición por talla estimada del patudo capturado por todas las<br />
pesquerías combinadas durante 2010-2015. El peso medio del patudo en 2015 (4,7 kg) fue el más bajo del<br />
sexenio, muy inferior al récord de 8,0 kg en 2011.<br />
El aleta azul del Pacífico es capturado con red de cerco y con artes recreacionales frente a California y<br />
Baja California, entre 28°N y 35°N, aproximadamente, principalmente entre mayo y diciembre. Durante<br />
2012 fue capturado entre 26°N y 32°N desde junio hasta agosto. La mayor parte de las capturas<br />
comerciales y recreacionales fue lograda en julio y agosto. Antes de 2004 se reportaban las tallas del<br />
pescado en las capturas comercial y recreacional por separado, pero durante 2004-2012 el pequeño<br />
tamaño de las muestras imposibilitó la estimación de la composición por talla por separado. Se<br />
combinaron por tanto las tallas del pescado en las capturas comercial y recreacional de aleta azul para<br />
cada año del período de 2004-2012. El peso medio del pescado capturado durante 2012 (14,2 kg) fue<br />
menor que aquél de 2011 (15,4 kg), pero muy parecido al peso promedio de 2009 y 2010. En la Figura A-<br />
9 se presentan las composiciones por talla estimadas. Antes de 2013, el personal de la CIAT obtenía<br />
muestras de frecuencia de talla de buques de pesca recreacional que descargaban en San Diego y de<br />
buques cerqueros. A partir de 2013, un muestreo de los buques recreacionales fue realizado por el<br />
Servicio Nacional de Pesquerías Marinas (NMFS) de EE.UU... Se tomaron muy pocas muestras de<br />
buques cerqueros comerciales en 2014 y 2015. Las estimaciones de composición por talla del aleta azul<br />
serán actualizadas una vez se desarrolle una metodología que incorpore los cambios en el muestreo.<br />
El barrilete negro es capturado incidentalmente por pescadores que dirigen su esfuerzo hacia los atunes<br />
aleta amarilla, barrilete, y patudo. La demanda de la especie es baja, y la mayoría de las capturas es<br />
desechada en el mar, pero a veces se retienen pequeñas cantidades, mezcladas con las especies más<br />
deseadas. En la Figura A-10 se ilustra la composición estimada por talla de la especie en cada año del
63<br />
período de 2010-2015.<br />
1.3.2. Pesquería de palangre<br />
En las Figuras A-11 y A-12 se ilustra la composición<br />
estimada por talla de las capturas de aleta amarilla y<br />
patudo por la pesquería palangrera japonesa en el<br />
OPO durante 2010-2014. El peso promedio del aleta<br />
amarilla en 2014 (62,7 kg) fue considerablemente<br />
mayor que aquellos de los cuatro años previos (44,7 a<br />
62,1 kg). El peso promedio del patudo en 2014 fue<br />
consistente con los cuatro años previos en 56,3 kg. En<br />
los Boletines de la CIAT que describen esta pesquería<br />
se presenta información sobre la composición por talla<br />
del pescado capturado en el OPO durante 1958-2008.<br />
1.4. Capturas de atunes y bonitos, por bandera y<br />
arte<br />
En las Tablas A-3a-e se detallan las capturas retenidas<br />
anuales de atunes y bonitos en el OPO durante 1986-<br />
2015, clasificadas por bandera y arte. Las tablas<br />
incluyen todas las capturas conocidas de atunes,<br />
compiladas de varias fuentes, entre ellas los cuadernos<br />
de bitácora de los buques, datos de observadores,<br />
registros de descargas provistos por empresas<br />
enlatadoras y otros procesadores, registros de<br />
importaciones y exportaciones, informes de los<br />
gobiernos y otras entidades, y estimaciones derivadas<br />
Figura 1. Capturas cerqueras de atunes, por<br />
especie y tipo de lance, 2000-2015.<br />
del programa de muestreo de especies y composición por talla. En el portal de internet de la CIAT se<br />
presenta información similar de años anteriores a 2001 sobre los atunes y bonitos, y datos históricos de<br />
atunes, peces picudos, tiburones, carángidos, dorado, y peces misceláneos. En la Tabla A-4 se resumen<br />
las capturas cerqueras de atunes y bonitos en 2014 y 2015, por bandera. De las 646 mil t de atunes y<br />
bonitos capturadas en 2015, 47% fue capturado por buques ecuatorianos, y 21% por buques mexicanos.<br />
Otros países con capturas importantes de atunes y bonitos en el OPO incluyen Panamá (10%), Venezuela<br />
(6%), Colombia (6%), y Estados Unidos (4).<br />
2. ESFUERZO DE PESCA<br />
2.1. Pesca de cerco<br />
En la Tabla A-7 se presentan estimaciones del número de lances cerqueros de cada tipo (asociados a<br />
delfines, asociados a objetos flotantes (naturales y plantados), y no asociados) en el OPO durante 2000-<br />
2015 y de las capturas retenidas de esos lances (Figura 1). Se calcularon las estimaciones para los buques<br />
de ≤363 t de capacidad de acarreo con datos de bitácora en la base de datos estadística de la CIAT, y<br />
aquéllos para los buques de >363 t de capacidad de acarreo a partir de las bases de datos de observadores<br />
de la CIAT y de los programas de observadores de la CIAT, Colombia, Ecuador, Estados Unidos,<br />
México, Nicaragua, Panamá, la Unión Europea y Venezuela. El número de lances sobre atunes asociados<br />
a objetos flotantes y no asociados fue máximo entre mediados de los años 1970 y principios de los 1980.<br />
A pesar de la oposición a la pesca de atunes asociados a delfines, y de la decisión de las enlatadoras de<br />
EE.UU. de no comprar atún capturado en viajes en los cuales se realizaron lances sobre delfines, el<br />
número de lances sobre delfines disminuyó tan sólo moderadamente a mediados de los años 1990, y en<br />
2003 fue el mayor jamás registrado.<br />
Hay dos tipos de objetos flotantes, los “naturales” (que también incluyen desperdicios y otros objetos
64<br />
artificiales), que se encuentran en el mar por casualidad, del punto de vista de los pescadores, y los que<br />
son construidos por pescadores con el propósito específico de atraer peces. Se conocen estos últimos<br />
como plantados, dispositivos agregadores de peces (DAP), o FAD (del inglés fish-aggregating device). El<br />
uso de los plantados aumentó bruscamente en 1994, con un porcentaje de plantados casi el doble del año<br />
anterior, en casi el 69% de todos los lances sobre objetos flotantes. Su importancia relativa ha seguido<br />
aumentando desde entonces, alcanzando el 97% de todos los lances sobre objetos flotantes por buques de<br />
más de 363 t de capacidad de acarreo en los últimos años, tal como se indica en la Tabla A-8.<br />
2.2. Pesca palangrera<br />
En la Tabla A-9 se presentan el esfuerzo nominal de los buques palangreros en el OPO, en miles de<br />
anzuelos, y sus capturas reportadas de las especies principales de atunes.<br />
3. <strong>LA</strong>S FLOTAS<br />
3.1. Las flotas de cerco y de caña<br />
El personal de la CIAT mantiene registros detallados del arte de pesca, bandera, y capacidad de acarreo<br />
de la mayoría de los buques que pescan atunes aleta amarilla, barrilete, patudo, y/o aleta azul del Pacífico<br />
con red de cerco o caña en el OPO. La flota aquí descrita incluye buques cerqueros y cañeros que<br />
pescaron alguna de estas cuatro especies en el OPO durante el año entero o parte del mismo.<br />
Históricamente, se usaron las estimaciones de la capacidad de acarreo de buques individuales provistas<br />
por el armador o astillero, en toneladas de pescado, hasta que los registros de descarga indicasen que era<br />
preciso modificarlas.<br />
Desde 2000, el personal de la CIAT usa el volumen de bodegas, en metros cúbicos (m 3 ), en lugar de peso,<br />
en toneladas (t), para medir la capacidad de acarreo de los buques. Ya que la densidad de carga de<br />
pescado en una bodega puede variar, medir la capacidad de acarreo en peso es subjetivo, ya que un<br />
cargamento de pescado metido en una bodega a densidad alta pesa más que uno cargado a densidad<br />
menor. El uso de volumen como medida de capacidad elimina este problema.<br />
El personal de la CIAT comenzó a reunir<br />
datos sobre la capacidad en volumen en<br />
1999, pero todavía no ha obtenido esta<br />
información para todos los buques. En el<br />
caso de buques para los cuales no se<br />
dispone de información fidedigna sobre<br />
el volumen de bodega, se convirtió la<br />
capacidad estimada en toneladas en<br />
metros cúbicos.<br />
Hasta aproximadamente 1960<br />
predominaron en la pesca atunera en el<br />
OPO los buques cañeros, que faenaban<br />
en zonas costeras y cerca de islas y<br />
bancos de alta mar. Hacia fines de los<br />
años 1950 y a principios de los 1960, la<br />
mayoría de los buques cañeros grandes<br />
fue convertida a arte de cerco, y para<br />
1961 este arte predominaba en la<br />
pesquería del OPO. Entre 1961 y 2015,<br />
Figura 2. Capacidad de acarreo, en metros cúbicos de<br />
volumen de bodega, de las flotas de cerco y de caña en el<br />
OPO, 1961-2015<br />
el número de buques cañeros se redujo de 93 a 1, y su volumen de bodega total disminuyó de unos 11.000<br />
m 3 a unos 125 m 3 . Durante el mismo período el número de cerqueros aumentó de 125 a 243, y su volumen<br />
total de bodega de unos 32.000 m 3 a 248.000 m 3 , un promedio de unos 1.021 m 3 por buque. Previamente
65<br />
ocurrió un pico en el número y volumen total de bodega de la flota cerquera entre mediados de los años<br />
1970 y principios de los 1980, cuando llegó a haber 282 buques, y el volumen total de bodega alcanzó<br />
unos 195.000 m 3 , un promedio de unos 700 m 3 por buque (Tabla A-10 y Figura 2).<br />
Las tasas de captura en el OPO fueron bajas durante 1978-1981, debido a la concentración del esfuerzo de<br />
pesca sobre peces pequeños, y la situación se vio agravada por un evento importante de El Niño que<br />
comenzó a mediados de 1982 y persistió hasta fines de 1983, y que causó que los peces fueran menos<br />
vulnerables a la captura. Luego disminuyó el volumen total de bodegas de los buques de cerco y caña,<br />
debido al retiro de buques o a su traslado a otras zonas de pesca, principalmente el Pacífico occidental, y<br />
en 1984 alcanzó el nivel más bajo desde 1971, unos 119.000 m 3 . A principios de 1990 la industria<br />
enlatadora de Estados Unidos decidió no comprar más atún capturado en viajes en los que se pescaran<br />
atunes asociados a delfines. Esto llevó a que muchas embarcaciones de Estados Unidos abandonasen el<br />
OPO, y a una disminución consecuente en la flota a 117.000 m 3 en 1992. Con la mayor participación de<br />
buques de otras naciones en la pesquería, el volumen total de bodega ha aumentado progresivamente<br />
desde 1992, y en 2015 fue de unos 248 mil m 3 .<br />
En las Tablas A-11a y A-11b se presentan los datos de 2014 y preliminares de 2015 del número y<br />
volumen total de bodega de los buques cerqueros y cañeros que pescaron atunes en el OPO. En 2015<br />
predominaron las flotas de Ecuador y México, con 37% y 23%, respectivamente, del volumen de bodega<br />
total, seguidos por Venezuela (8%), Panamá (8%), Estados Unidos (7%), Colombia (6%), la Unión<br />
Europea (España) (4%), Nicaragua (3%), El Salvador (2%), y Guatemala y Perú (1% cada uno). Los<br />
porcentajes pueden no sumar a 100% debido al redondeo.<br />
En la Figura 3 se compara la capacidad acumulativa en el mar durante 2015 con los cinco años anteriores.<br />
En la Tabla A-12 se presentan los valores mensuales medios, mínimos, y máximos del volumen total de<br />
bodega en el mar (VEM), en miles de metros cúbicos, de los buques cerqueros y cañeros que pescaron<br />
atunes en el OPO durante 2005-2014, junto con los valores de 2015. Los valores mensuales son los<br />
promedios de las estimaciones de la VEM calculadas semanalmente por el personal de la CIAT. La pesca<br />
fue reglamentada durante<br />
parte, o la totalidad, de los<br />
últimos cuatro meses del año<br />
durante 2000-2015, por lo que<br />
los valores de la VEM de<br />
septiembre-diciembre de 2015<br />
no son comparables con los<br />
valores medios del período<br />
correspondiente durante 2000-<br />
2015. Durante 2005-2014 y<br />
2015 el valor medio del VEM<br />
fue 136 mil m 3 (62% de la<br />
capacidad total) y 145 mil m 3<br />
(58% de la capacidad total),<br />
respectivamente.<br />
3.2. Otras flotas del OPO<br />
Figura 3. Capacidad acumulativa de la flota cerquera y cañera en el<br />
mar, por mes, 2010-2015<br />
El Registro Regional de Buques de la CIAT, disponible en el sitio web de la Comisión, contiene<br />
información sobre otros tipos de buques que pescan atunes en el OPO. El Registro es incompleto para<br />
buques pequeños. En algunos casos, particularmente con respecto a los buques palangreros grandes, el<br />
Registro Regional contiene información de buques que están autorizados para pescar no sólo en el OPO,<br />
sino también en otros océanos, y que posiblemente no hayan pescado en el OPO en 2015, o jamás.
66<br />
B. YELLOWFIN TUNA<br />
This report presents the most current stock assessment of yellowfin tuna (Thunnus albacares) in the<br />
eastern Pacific Ocean (EPO). An integrated statistical age-structured stock assessment model (Stock<br />
Synthesis Version 3.23b) was used in the assessment, which is based on the assumption that there is a<br />
single stock of yellowfin in the EPO.<br />
Yellowfin are distributed across the Pacific Ocean, but the bulk of the catch is made in the eastern and<br />
western regions. Purse-seine catches of yellowfin are relatively low in the vicinity of the western<br />
boundary of the EPO at 150ºW (Figure A-1a and A-1b). The majority of the catch in the EPO is taken in<br />
purse-seine sets on yellowfin associated with dolphins and in unassociated schools (Figure B-1). Tagging<br />
studies of yellowfin throughout the Pacific indicate that the fish tend to stay within 1800 km of their<br />
release positions. This regional fidelity, along with the geographic variation in phenotypic and genotypic<br />
characteristics of yellowfin shown in some studies, suggests that there might be multiple stocks of<br />
yellowfin in the EPO and throughout the Pacific Ocean. This is consistent with the fact that longline<br />
catch-per-unit-of-effort (CPUE) trends differ among areas in the EPO. However, movement rates<br />
between these putative stocks, as well as across the 150°W meridian, cannot be estimated with currentlyavailable<br />
tagging data.<br />
The assessment of yellowfin tuna in the eastern Pacific Ocean in 2015 is similar to the previous<br />
assessment, except that separate series of length-frequency data for Japanese longline commercial and<br />
training vessels are now available, and both were used in the assessment. There is uncertainty about<br />
recent and future levels of recruitment (Figure B-2) and biomass (Figure B-5). There have been two, and<br />
possibly three, different productivity regimes since 1975, and the levels of maximum sustainable yield<br />
(MSY) and the biomasses corresponding to the MSY may differ among the regimes. The population may<br />
have switched in the last ten years from a high to an intermediate productivity regime. The spawning<br />
biomass ratio (SBR) has been below average since 2006, with the exception of 2008-2010, which resulted<br />
from a high recruitment in 2006. The recent fishing mortality rates (F) are slightly below the MSY level<br />
(Fmult = 1.02), and the recent levels of spawning biomass (S) are estimated to be below that level<br />
(S recent /S MSY = 0.95) (Table B-1 and Figure B-6). As noted in IATTC Stock Assessment Report 16 and<br />
previous assessments, these interpretations are uncertain, and highly sensitive to the assumptions made<br />
about the steepness parameter (h) of the stock-recruitment relationship, the average size of the older fish<br />
(L 2 ), and the assumed levels of natural mortality (M). The results are more pessimistic if a stockrecruitment<br />
relationship is assumed, if a higher value is assumed for L 2 , and if lower rates of M are<br />
assumed for adult yellowfin. A likelihood profile on the virgin recruitment (R 0 ) parameter showed that<br />
data components diverge on their information about abundance levels. Sensitivity analyses indicated that<br />
the results are more pessimistic if the weighting assigned to length-frequency data is changed, using<br />
recommended data weighting methods, and more optimistic if the model is fitted closely to the index of<br />
relative abundance based on the catch per unit of effort (CPUE) of the northern dolphin-associated purseseine<br />
fishery rather than of the southern longline fishery. The highest fishing mortality (F) has been on<br />
fish aged 11-20 quarters (2.75-5 years) (Figure B-3). The average annual F has been increasing for all age<br />
classes since 2009, but in 2015 it showed a slight decline for the 11-20 quarter age group. Historically, the<br />
dolphin-associated and unassociated purse-seine fisheries have the greatest impact on the spawning<br />
biomass of yellowfin, followed by the floating-object fisheries (Figure B-4). In more recent years, the<br />
impact of the floating-object fisheries has been greater than that of the unassociated fisheries. The impacts<br />
of the longline and purse-seine discard fisheries are much less, and have decreased in recent years.<br />
Increasing the average weight of the yellowfin caught could increase the MSY.
FIGURE B-1. Total catches (retained catches plus discards) for the purse-seine fisheries, and retained<br />
catches for the pole-and-line and longline fisheries, of yellowfin tuna in the eastern Pacific Ocean, 1975-<br />
2015. The purse-seine catches are adjusted to the species composition estimate obtained from sampling<br />
the catches. The 2015 catch data are preliminary.<br />
FIGURA B-1. Capturas totales (capturas retenidas más descartes) en las pesquerías de cerco, y capturas<br />
retenidas de las pesquerías de caña y de palangre, de atún aleta amarilla en el Océano Pacífico oriental,<br />
1975-2015. Se ajustan las capturas de cerco a la estimación de la composición por especie obtenida del<br />
muestreo de las capturas. Los datos de captura de 2015 son preliminares.<br />
67
68<br />
FIGURE B-2. Estimated annual recruitment at age zero of yellowfin tuna to the fisheries of the EPO.<br />
The estimates are scaled so that the average recruitment is equal to 1.0 (dashed horizontal line). The solid<br />
line illustrates the maximum likelihood estimates of recruitment, and the shaded area indicates the<br />
approximate 95% confidence intervals around those estimates.<br />
FIGURA B-2. Reclutamiento anual estimado a edad cero de atún aleta amarilla a las pesquerías del OPO.<br />
Se ajusta la escala de las estimaciones para que el reclutamiento medio equivalga a 1.0 (línea de trazos<br />
horizontal). La línea sólida ilustra las estimaciones de verosimilitud máxima del reclutamiento, y la zona<br />
sombreada los límites de confianza de 95% aproximados de las estimaciones.
FIGURE B-3. Average annual fishing mortality (F) by age groups, by all gears, of yellowfin tuna<br />
recruited to the fisheries of the EPO. The age groups are defined by age in quarters.<br />
FIGURA B-3. Mortalidad por pesca (F) anual media, por grupo de edad, por todas las artes, de atún aleta<br />
amarilla reclutado a las pesquerías del OPO. Se definen los grupos de edad por edad en trimestres.<br />
69
70<br />
FIGURE B-4. Biomass trajectory of a simulated population of yellowfin tuna that was never exploited<br />
(dashed line) and that predicted by the stock assessment model (solid line). The shaded areas between the<br />
two lines show the portions of the fishery impact attributed to each fishing method.<br />
FIGURA B-4. Trayectoria de la biomasa de una población simulada de atún aleta amarilla que nunca fue<br />
explotada (línea de trazos) y aquella predicha por el modelo de evaluación de la población (línea sólida).<br />
Las áreas sombreadas entre las dos líneas representan la porción del impacto de la pesca atribuida a cada<br />
método de pesca.
FIGURE B-5. Spawning biomass ratios (SBRs) for yellowfin tuna in the EPO, including projections for<br />
2016-2026 based on average fishing mortality rates during 2013-2015, from the base case (top) and the<br />
sensitivity analysis that assumes a stock-recruitment relationship (h = 0.75, bottom). The dashed<br />
horizontal line (at 0.21 and 0.30, respectively) identifies the SBR at MSY. The solid curve illustrates the<br />
maximum likelihood estimates, and the estimates after 2016 (the large dot) indicate the SBR predicted to<br />
occur if fishing mortality rates continue at the average of that observed during 2013-2015, and average<br />
recruitment occur during the next 10 years. The shaded area indicates the approximate 95% confidence<br />
intervals around those estimates.<br />
FIGURA B-5. Cocientes de biomasa reproductora (SBR) de atún aleta amarilla en el OPO, con<br />
proyecciones para 2016-2026 basadas en las tasas de mortalidad por pesca medias durante 2013-2015, del<br />
caso base (recuadro superior) y el análisis de sensibilidad que supone una relación poblaciónreclutamiento<br />
(h = 0.75, recuadro inferior). La línea de trazos horizontal (en 0.27 y 0.35, respectivamente)<br />
identifica el SBR correspondiente al RMS. La curva sólida ilustra las estimaciones de verosimilitud<br />
máxima, y las estimaciones a partir de 2016 (punto grande) indican el SBR que se predice ocurrirá con<br />
tasas de mortalidad por pesca en el promedio de aquellas observadas durante 2013-2015, y con<br />
reclutamiento medio durante los 10 años próximos. El área sombreada indica los intervalos de confianza<br />
de 95% aproximados alrededor de esas estimaciones.<br />
71
72<br />
FIGURE B-6. Kobe (phase) plot of the time series of estimates of stock size (top panel: spawning<br />
biomass; bottom panel: total biomass of fish aged 3+ quarters) and fishing mortality relative to their MSY<br />
reference points. The panels represent interim target reference points (S MSY and F MSY ). The dashed lines<br />
represent the interim limit reference points of 0.28 *S MSY and 2.42*F MSY , which correspond to a 50%<br />
reduction in recruitment from its average unexploited level based on a conservative steepness value (h =<br />
0.75) for the Beverton-Holt stock-recruitment relationship. Each dot is based on the average exploitation<br />
rate over three years; the large blue dot indicates the most recent estimate. The squares around the most<br />
recent estimate represent its approximate 95% confidence interval. The triangle represents the first<br />
estimate (1975).<br />
FIGURA B-6. Gráfica de Kobe (fase) de la serie de tiempo de las estimaciones del tamaño de la<br />
población (panel superior: biomasa reproductora; panel inferior: biomasa total de peces de 3+ trimestres<br />
de edad) y la mortalidad por pesca en relación con sus puntos de referencia de RMS. Las líneas de trazos<br />
representan los puntos de referencia límite provisionales de 0.28*S RMS y 2.42*F RMS , que corresponden a<br />
una reducción de 50% del reclutamiento de su nivel medio no explotado basada en un valor cauteloso de<br />
la inclinación de la relación población-reclutamiento de Beverton-Holt (h = 0.75). Cada punto se basa en<br />
la tasa de explotación media por trienio; el punto azul grande indica la estimación más reciente. Los<br />
cuadrados alrededor de la estimación más reciente representan su intervalo de confianza de 95%<br />
aproximado. El triángulo representa la primera estimación (1975).
73<br />
TABLE B-1. MSY and related quantities for the base case and the stock-recruitment relationship<br />
sensitivity analysis, based on average fishing mortality (F) for 2013-2015. B recent and B MSY are defined as<br />
the biomass, in metric tons, of fish 3+ quarters old at the start of the first quarter of 2016 and at MSY,<br />
respectively, and S recent and S MSY are defined as indices of spawning biomass (therefore, they are not in<br />
metric tons). C recent is the estimated total catch for 2015.<br />
TAB<strong>LA</strong> B-1. RMS y cantidades relacionadas para el caso base y el análisis de sensibilidad a la relación<br />
población-reclutamiento, basados en la mortalidad por pesca (F) media de 2012-2014. Se definen B recent y<br />
B RMS como la biomasa, en toneladas, de peces de 3+ trimestres de edad al principio del primer trimestre<br />
de 2015 y en RMS, respectivamente, y S recent y S RMS como índices de biomasa reproductora (por lo tanto,<br />
no se expresan en toneladas). C recent es la captura total estimada de 2015.<br />
Base case<br />
YFT<br />
Caso base<br />
h = 0.75<br />
MSY-RMS 272,841 287,476<br />
B MSY - B RMS 372,010 547,238<br />
S MSY - S RMS 3,528 5,897<br />
B MSY /B 0 - B RMS /B 0 0.32 0.37<br />
S MSY /S 0 - S RMS /S 0 0.27 0.35<br />
C recent /MSY- C recent /RMS 0.94 0.89<br />
B recent /B MSY - B recent /B RMS 0.96 0.64<br />
S recent /S MSY -S recent /S RMS 0.95 0.56<br />
F multiplier-Multiplicador de F 1.02 0.65
74<br />
B. ATÚN ALETA AMARIL<strong>LA</strong><br />
Este informe presenta la evaluación más reciente de la población del atún aleta amarilla (Thunnus<br />
albacares) en el Océano Pacífico oriental (OPO). Se usó un modelo de evaluación de poblaciones<br />
estadístico integrado con estructura por edad (Stock Synthesis Versión 3.23b) en la evaluación, que se<br />
basa en el supuesto que existe una sola población de aleta amarilla en el OPO.<br />
El aleta amarilla se encuentra distribuido en todo el Océano Pacífico, pero la mayor parte de la captura<br />
proviene de las regiones oriental y occidental. Las capturas cerqueras de aleta amarilla son relativamente<br />
bajas cerca del límite occidental del OPO en 150°O (Figure A-1a and A-1b). La mayoría de la captura en<br />
el OPO proviene de lances cerqueros sobre aletas amarillas asociados a delfines y en cardúmenes no<br />
asociados (Figure B-1). Estudios de marcado de aleta amarilla en todas partes del Pacífico indican que los<br />
peces suelen permanecer a menos de 1 800 km de su posición de liberación. Esta fidelidad regional, junto<br />
con la variación geográfica en las características fenotípicas y genotípicas del aleta amarilla mostrada en<br />
algunos estudios, indica que podrían existir múltiples poblaciones de aleta amarilla en el OPO y en todo el<br />
Océano Pacífico. Esto es consistente con el hecho que las tendencias de la captura por unidad de esfuerzo<br />
(CPUE) palangrera son diferentes en distintas zonas en el OPO. No obstante, las tasas de desplazamiento<br />
entre esas poblaciones, así como a través del meridiano de 150°O, no pueden ser estimadas con los datos<br />
de marcado actualmente disponibles.<br />
La evaluación del atún aleta amarilla en el Océano Pacífico oriental en 2015 es similar a la evaluación<br />
previa, excepto que se dispone ahora de series separadas de datos de frecuencia de talla de buques<br />
palangreros japoneses comerciales y de aprendizaje, y se usaron ambos en la evaluación.<br />
Existe incertidumbre acerca de los niveles recientes y futuros del reclutamiento (Figure B-2) y la biomasa<br />
(Figure B-5). Han ocurrido dos, y posiblemente tres, distintos regímenes de productividad desde 1975, y<br />
los niveles de rendimiento máximo sostenible (RMS) y las biomasas correspondientes al RMS podrían ser<br />
diferentes entre los regímenes. La población podría haber cambiado en la última década de un régimen de<br />
productividad alto a uno intermedio. El cociente de biomasa reproductora (SBR) ha estado por debajo del<br />
promedio desde 2006, con la excepción de 2008-2010, que resultó de un reclutamiento elevado en 2006.<br />
Las tasas recientes de mortalidad por pesca (F) son ligeramente inferiores al nivel de RMS (Fmult =<br />
1.02), y se estima que los niveles recientes de biomasa reproductora (S) están por debajo de ese nivel<br />
(S reciente /S RMS = 0.95). Tal como se comenta en el Informe de Evaluación de Stocks 16 de la CIAT y<br />
evaluaciones previas estas interpretaciones son inciertas, y altamente sensibles a los supuestos hechos<br />
acerca del parámetro de inclinación (h) de la relación población-reclutamiento, el tamaño medio de los<br />
peces más viejos (L 2 ), y los niveles supuestos de mortalidad natural (M). Los resultados más pesimistas si<br />
se supone una relación población-reclutamiento, un valor más alto para L 2 , y si se suponen tasas de M<br />
más bajas para el aleta amarilla adulto. Un perfil de verosimilitud del parámetro de reclutamiento virgen<br />
(R 0 ) mostró que los componentes de datos divergen en su información sobre los niveles de abundancia.<br />
Los análisis de sensibilidad indicaron que los resultados más pesimistas si se cambia a la ponderación<br />
asignada a los datos de frecuencia de talla, usando métodos de ponderación de datos recomendados, y más<br />
optimistas si se ajustaron modelos estrechamente al índice de abundancia relativa basado en la CPUE de<br />
la pesquería cerquera asociada a delfines del norte en lugar de la pesquería palangrera del sur.<br />
La F más alta ocurrió en peces de entre 11 y 20 trimestres (2.75-5 años) de edad. La F anual media viene<br />
aumentando para todas las clases de edad desde 2009, pero en 2015 mostró una ligera disminución del<br />
grupo de edad de 11 a 20 trimestres. Históricamente, las pesquerías cerqueras asociadas a delfines y no<br />
asociadas ejercen el mayor impacto sobre la biomasa reproductora de aleta amarilla, seguidas por las<br />
pesquerías sobre objetos flotantes (Figura B-4). En los años más recientes, el impacto de las pesquerías<br />
sobre objetos flotantes ha sido mayor que aquel de las pesquerías no asociadas. Los impactos de las<br />
pesquerías de palangre y cerquera de descarte han sido mucho menores, y han disminuido en años<br />
recientes. Aumentar el peso promedio del aleta amarilla capturado podría incrementar el RMS.
75<br />
C. SKIPJACK TUNA<br />
Skipjack are distributed across the Pacific Ocean, and it is likely that there is a continuous stock<br />
throughout the Pacific Ocean, with exchange of individuals at a local level, although large-scale<br />
movements are thought to be rare. The bulk of the catches of skipjack are made in the eastern and western<br />
regions; the purse-seine catches are relatively low in the vicinity of the western boundary of the EPO at<br />
150°W. The movements of tagged skipjack generally cover hundreds, rather than thousands, of<br />
kilometers, and exchange of fish between the eastern and western Pacific Ocean appears to be limited.<br />
Movement rates between the EPO and the western Pacific cannot be estimated with currently-available<br />
tagging data. In some analyses the EPO was divided into six independent sub-regions to accommodate<br />
spatial structure of the population and fishery dynamics.<br />
Stock assessment requires substantial amounts of information and the information varies depending on<br />
the method used. The methods applied to skipjack require a variety of information, including data on<br />
retained catches, discards, indices of abundance, the size compositions of the catches of the various<br />
fisheries, tagging data, and oceanographic data. In addition, assumptions have to be made about processes<br />
such as growth, recruitment, movement, natural mortality, selectivity, and stock structure.<br />
Biomass, recruitment, and fishing mortality are estimated to be highly variable over time. The estimates<br />
are uncertain and differ among the alternative assessment methods. A large recruitment appears to have<br />
entered the population in 1999, and led to increased biomass in that year, but the increase was temporary,<br />
due to the short-lived nature of skipjack. Biomass appears to have been above average in recent years, but<br />
this may differ among regions. SEAPODYM estimates annual biomass of skipjack 30cm or larger cycling<br />
between 1,800,000 t and 2,350,000 t from 1998 to 2008, but the quality of these estimates has yet to be<br />
determined. The average weight of skipjack started declining in 2000, but has stabilized in recent years<br />
(Figure C-1). Previous assessments using a catch-at-length analysis (A-SCA<strong>LA</strong>) to assess skipjack tuna in<br />
the EPO were considered preliminary because: 1) it was unknown if catch-per-day-fished for purse-seine<br />
fisheries is proportional to abundance; 2) it is possible that there is a population of large skipjack that is<br />
invulnerable to the fisheries; and 3) the structure of the EPO stock in relation to the western and central<br />
Pacific stocks is uncertain. These issues are also relevant to the other assessments.<br />
Previous assessments estimated that maximum yields are achieved with infinite fishing mortality because the<br />
critical weight is less than the average weight at recruitment to the fishery. However, this is uncertain because<br />
of uncertainties in the estimates of natural mortality and growth. For this reason, no traditional reference points<br />
are available for skipjack tuna in the EPO. Consequently, indicators and reference levels have been used to<br />
evaluate the status of the stock. The main concern with the skipjack stock is the constantly increasing<br />
exploitation rate. However, exploitation rate appears to have leveled off in recent years. The data- and modelbased<br />
indicators have yet to detect any adverse consequence of this increase. The average weight has declined<br />
to levels seen in the early 1980s and was below its lower reference level in 2015 (Figure C-1), which can be a<br />
consequence of overexploitation, but it can also be caused by recent recruitments being greater than past<br />
recruitments or expansion of the fishery into areas occupied by smaller skipjack. The low 2015 level is likely<br />
due to the large recruitment in 2015. However, average weight has stabilized in recent years. The tagging<br />
analyses, length-structured model, A-SCA<strong>LA</strong>, and the SEAPODYM analyses do not provide any information<br />
that indicates a credible risk to the skipjack stock(s).<br />
Susceptibility and productivity analysis (PSA; see IATTC Fishery Status Report 12, p 149) shows that<br />
skipjack has substantially higher productivity than bigeye tuna. Biomass and fishing mortality<br />
corresponding to MSY are, respectively, negatively and positively related to productivity. Therefore,<br />
since skipjack and bigeye have about the same susceptibility, which is related to fishing mortality, the<br />
status of skipjack can be inferred from the status of bigeye. The current assessment of bigeye tuna<br />
estimates that the fishing mortality is less than FMSY; therefore, the fishing mortality for skipjack should<br />
also be less than FMSY. Since effort and skipjack biomass have been relatively constant over the past 10<br />
years, this also implies that skipjack biomass is above BMSY.
76<br />
FIGURE C-1. Indicators of stock status for skipjack tuna in the eastern Pacific Ocean. OBJ: floatingobject<br />
fishery; NOA: unassociated fishery; CPDF: catch per day fished. All indicators are scaled so that<br />
their average equals one.<br />
FIGURA C-1. Indicadores del estatus de la población de atún barrilete en el Océano Pacífico oriental.<br />
OBJ: pesquería sobre objetos flotantes; NOA: pesquería no asociada; CPDP: captura por día de pesca. Se<br />
escalan todos los indicadores para que su promedio equivalga a uno.
77<br />
C. ATÚN BARRILETE<br />
El barrilete se encuentra distribuido por todo el Océano Pacífico, y es probable que exista una población<br />
continua por todo el Océano Pacífico, con intercambio de individuos a nivel local, aunque se cree que los<br />
desplazamientos a gran escala son poco comunes. La mayoría de las capturas de barrilete provienen de las<br />
regiones oriental y occidental; las capturas cerqueras son relativamente bajas cerca del límite occidental<br />
del OPO en 150°OW. Los desplazamientos de barrilete es marcados cubren generalmente centenares, no<br />
miles, de kilómetros, y el intercambio de peces entre el Océano Pacífico oriental y occidental parece ser<br />
limitado. Las tasas de desplazamiento entre el OPO y el Pacífico occidental no pueden ser estimadas con<br />
los datos de marcado actualmente disponibles. En algunos análisis se dividió el OPO en seis subregiones<br />
independientes para acomodar la estructura espacial de la dinámica de la población y de la pesquería.<br />
La evaluación de poblaciones requiere cantidades sustanciales de información, y la información varía de<br />
acuerdo al método usado. Los métodos aplicados al barrilete exigen una variedad de información,<br />
incluyendo datos de las capturas retenidas, descartes, índices de abundancia, la composición por tamaño<br />
de las capturas de las varias pesquerías, datos de marcado, y datos oceanográficos. Además, se han de<br />
hacer supuestos acerca de los procesos tales como crecimiento, reclutamiento, desplazamiento, mortalidad<br />
natural, selectividad, y estructura de la población.<br />
Se estima que la biomasa, reclutamiento, y mortalidad por pesca son altamente variables a lo largo<br />
del tiempo. Las estimaciones son inciertas, y son diferentes entre los métodos de evaluación<br />
alternativos. Parece que un reclutamiento grande ingresó a la población en 1999, y condujo a una<br />
biomasa incrementada en ese año, pero el incremento fue temporario, debido a la corta vida del<br />
barrilete. La biomasa parece haber sido superior al promedio en los últimos años, pero esto podría<br />
variar entre regiones. SEAPODYM estima una biomasa en el barrilete de 30 cm o más de entre<br />
1,800,000 y 2,350,000 t entre 1998 y 2008, pero la calidad de estas estimaciones queda todavía por<br />
determinar. El peso promedio del barrilete comenzó a disminuir en 2000, pero se ha estabilizado en<br />
los años recientes. Las evaluaciones previas que usaron un análisis de captura por talla (A-SCA<strong>LA</strong>)<br />
para evaluar al atún barrilete en el OPO fueron consideradas preliminares porque: 1) no se sabía si la<br />
captura por día de pesca en las pesquerías de cerco es proporcional a la abundancia; 2) es posible que<br />
exista una población de barriletes grandes invulnerable a las pesquerías; y 3) la estructura de la<br />
población del OPO en relación con las poblaciones del Pacífico occidental y central es incierta. Estos<br />
problemas son asimismo pertinentes a las otras evaluaciones.<br />
Las evaluaciones previas estimaron que se logran los rendimientos máximos con una mortalidad por<br />
pesca infinita, porque el peso crítico es inferior al peso promedio al momento del reclutamiento a la<br />
pesquería. No obstante, esto es incierto debido a incertidumbres en las estimaciones de la mortalidad<br />
natural y el crecimiento. Por este motivo, no se dispone de puntos de referencia tradicionales para el atún<br />
barrilete en el OPO. Consecuentemente, se han usado indicadores y niveles de referencia para evaluar la<br />
condición de la población. La preocupación principal con respecto a la población de barrilete es el<br />
incremento constante de la tasa de explotación. No obstante, esta tasa parece haber permanecido estable<br />
en los últimos años. Los indicadores basados en datos y en modelos todavía no han detectado<br />
consecuencias adversas de este incremento. El peso promedio ha disminuido a niveles vistos a principios<br />
de los años 1980, y estuvo por debajo de su nivel de referencia inferior en 2015, lo cual podría ser<br />
consecuencia de sobreexplotación, pero también puede ser causado por el hecho que los reclutamientos<br />
recientes han sido mayores que los anteriores, o por la expansión de la pesquería a zonas ocupadas por<br />
barriletes más pequeños. El bajo nivel de 2015 se debe probablemente al reclutamiento grande en 2013.<br />
Sin embargo, el peso promedio se ha estabilizado en los años recientes. Los análisis de marcado, el<br />
modelo por talla A-SCA<strong>LA</strong>, y los análisis de SEAPODYM no brindan ninguna información que indique<br />
un riesgo creíble para la población (o poblaciones) de barrilete.<br />
Un análisis de susceptibilidad y productividad (PSA; ver Informe de la situación de la pesquería 12, p<br />
172) señala que la productividad del barrilete es sustancialmente mayor que aquella del atún patudo. La
78<br />
biomasa y mortalidad por pesca correspondientes al RMS están relacionadas negativa y positivamente,<br />
respectivamente, con la productividad. Por lo tanto, ya que la susceptibilidad (que está relacionada con la<br />
mortalidad por pesca) del barrilete y patudo son aproximadamente iguales, la condición del barrilete<br />
puede ser inferida a partir de la condición del patudo. La evaluación actual del patudo estima que la<br />
mortalidad por pesca es menos que F RMS ; por lo tanto, la mortalidad por pesca del barrilete debería ser<br />
menos que F RMS . Ya que el esfuerzo y la biomasa del barrilete han sido relativamente constantes durante<br />
los 10 últimos años, esto implica asimismo que la biomasa del barrilete está por encima de B RMS .
79<br />
D. BIGEYE TUNA<br />
This report presents the most current stock assessment of bigeye tuna (Thunnus obesus) in the eastern<br />
Pacific Ocean (EPO). An integrated statistical age-structured stock assessment model (Stock Synthesis<br />
3.23b) was used in the assessment.<br />
There have been substantial changes in the bigeye tuna fishery in the EPO over recent decades (Figure D-<br />
1). Initially, the majority of the bigeye catch was taken by longline vessels. With the expansion of the<br />
fishery on fish-aggregating devices (FADs) since 1993, the purse-seine fishery has taken an increasing<br />
component of the bigeye catch. In recent years, purse-seine catches of bigeye were taken primarily<br />
between 5°N and 5°S across the equatorial Pacific as far west as the western boundary (150°W) of the<br />
EPO (Figure D-3). The longline catches of bigeye in the EPO are predominantly taken below 5°S, but a<br />
substantial portion is also taken north of 10°N (Figure D-4). The assessment is conducted as if there were<br />
a single stock of bigeye in the EPO, with minimal net movement of fish between the EPO and the western<br />
and central Pacific Ocean (WCPO). Its results are consistent with the results of other analyses of bigeye<br />
tuna on a Pacific-wide basis. However, the distribution of the bigeye catches extends across the equatorial<br />
Pacific Ocean. In addition, a large amount of conventional and electronic tagging data has recently<br />
accumulated from the Pacific Tuna Tagging Programme, which has focused its bigeye tagging efforts<br />
between 180° and 140°W since 2008. The tag recoveries clearly show that there is extensive longitudinal<br />
movement of bigeye across the IATTC’s management boundary at 150°W, in particular from west to east.<br />
The IATTC staff is collaborating with Secretariat of the Pacific Community (SPC) on an updated Pacificwide<br />
bigeye stock assessment. This research will incorporate the new tagging data in a spatiallystructured<br />
population dynamics model, which will help to evaluate potential biases resulting from the<br />
current approach of conducting separate assessments for the EPO and WCPO.<br />
The assessment of bigeye tuna in the eastern Pacific Ocean in 2015 is similar to the previous assessment,<br />
except that separate series of length-frequency data for Japanese longline commercial and training vessels<br />
are now available, and both were used in the assessment. The results of this assessment indicate a<br />
recovering trend for bigeye in the EPO during 2005-2009, subsequent to IATTC tuna conservation<br />
resolutions initiated in 2004 (Figure D-5). However, although the resolutions have continued since 2009,<br />
the rebuilding trend was not sustained during 2010-2012, and the spawning biomass ratio (SBR)<br />
gradually declined to a historically low level of 0.16 at the start of 2013. This decline may be related to a<br />
series of recent below-average recruitments which coincided with a series of strong La Niña events<br />
(Figure D-2). More recently, the SBR is estimated to have increased slightly, from 0.16 in 2013 to 0.20 at<br />
the start of 2016; in the model, this increase is driven mainly by the recent increase in the catch per unit of<br />
effort (CPUE) of the longline fisheries that catch adult bigeye. There is uncertainty about recent and<br />
future levels of recruitment and biomass.<br />
There have been important changes in the amount of fishing mortality caused by the fisheries that catch<br />
bigeye tuna in the EPO. On average, since 1993 the fishing mortality of bigeye less than about 15 quarters<br />
old has increased substantially, and that of fish more than about 15 quarters old has also increased, but to<br />
a lesser extent) (Figure D-3). The increase in the fishing mortality of the younger fish was caused by the<br />
expansion of the purse-seine fisheries that catch tuna in association with floating objects. It is clear that<br />
the longline fishery had the greatest impact on the stock prior to 1995, but with the decrease in longline<br />
effort and the expansion of the floating-object fishery, at present the impact of the purse-seine fishery on<br />
the bigeye stock is far greater than that of the longline fishery (Figure D-4). The discarding of small<br />
bigeye has a small, but detectable, impact on the depletion of the stock.<br />
At current levels of fishing mortality (F), and if recent levels of effort and catchability continue and<br />
recruitment remains average, the spawning biomass (S) is predicted to continue rebuilding and stabilize at<br />
about 0.22 (Figure D-5), above the level corresponding to the maximum sustainable yield (MSY) (0.21).<br />
The recent fishing mortality rates are estimated to be below the level corresponding to MSY, whereas<br />
recent spawning biomasses are estimated to be slightly below that level (Table D-1 and Figure D-6).
80<br />
These interpretations are uncertain and highly sensitive to the assumptions made about the steepness<br />
parameter (h) of the stock-recruitment relationship, the weighting assigned to the size-composition data<br />
(in particular to the longline size-composition data), the growth curve, and the assumed rates of natural<br />
mortality (M) for bigeye.<br />
FIGURE D-1. Total catches (retained catches plus discards) of bigeye tuna by the purse-seine fisheries,<br />
and retained catches for the longline fisheries, in the eastern Pacific Ocean, 1975-2015. The purse-seine<br />
catches are adjusted to the species composition estimate obtained from sampling the catches. The 2015<br />
catch data are preliminary.<br />
FIGURA D-1. Capturas totales (capturas retenidas más descartes) de atún patudo por las pesquerías<br />
de cerco y capturas retenidas de las pesquerías palangreras en el Océano Pacífico oriental, 1975-<br />
2015. Las capturas cerqueras se basan en datos de descargas, ajustados a la estimación de la<br />
composición por especie.
FIGURE D-2. Estimated annual recruitment of bigeye tuna to the fisheries of the EPO. The estimates are<br />
scaled so that the estimate of virgin recruitment is equal to 1.0 (dashed horizontal line). The solid line<br />
shows the maximum likelihood estimates of recruitment, and the shaded area indicates the approximate<br />
95% intervals around those estimates.<br />
FIGURA D-2. Reclutamiento estimado de atún patudo a las pesquerías del OPO. Se escalan las<br />
estimaciones para que la estimación de reclutamiento virgen equivalga a 1,0 (línea de trazos horizontal).<br />
La línea sólida indica las estimaciones de reclutamiento de verosimilitud máxima, y el área sombreada<br />
indica los intervalos de confianza de 95% aproximados de esas estimaciones.<br />
81
82<br />
FIGURE D-3. Average annual fishing mortality, by all gears, of bigeye tuna recruited to the fisheries of<br />
the EPO. Each panel illustrates the average fishing mortality rates that affected the fish within the range<br />
of ages indicated in the title of each panel. For example, the trend illustrated in the top panel is an average<br />
of the fishing mortalities that affected the fish that were 1-4 quarters old.<br />
FIGURA D-3. Mortalidad por pesca anual media, por todas las artes, de atún patudo reclutado a las<br />
pesquerías del OPO. Cada recuadro ilustra las tasas medias de mortalidad por pesca que afectaron a los<br />
peces de la edad indicada en el título de cada recuadro. Por ejemplo, la tendencia ilustrada en el recuadro<br />
superior es un promedio de las mortalidades por pesca que afectaron a los peces de entre 1 y 4 trimestres<br />
de edad.
FIGURE D-4. Trajectory of the spawning biomass of a simulated population of bigeye tuna that was not<br />
exploited (top line) and that predicted by the stock assessment model (bottom line). The shaded areas<br />
between the two lines show the portions of the impact attributed to each fishing method. t = metric tons.<br />
FIGURA D-4. Trayectoria de la biomasa reproductora de una población simulada de atún patudo no<br />
explotada (línea superior) y la que predice el modelo de evaluación (línea inferior). Las áreas sombreadas<br />
entre las dos líneas señalan la porción del efecto atribuida a cada método de pesca. t = toneladas métricas.<br />
83
84<br />
FIGURE D-5. Estimated spawning biomass ratios (SBRs) of bigeye tuna in the EPO, including<br />
projections for 2016-2026 based on average fishing mortality rates during 2013-2015. The dashed<br />
horizontal line (at 0.21) identifies the SBR at MSY. The solid line illustrates the maximum likelihood<br />
estimates, and the estimates after 2016 (the large dot) indicate the SBR predicted to occur if fishing<br />
mortality rates continue at the average of that observed during 2013-2015. The dashed lines are the 95-<br />
percent confidence intervals around these estimates.<br />
FIGURA D-5. Cocientes de biomasa reproductora (SBR) del atún patudo en el OPO, incluyendo<br />
proyecciones para 2016-2026 basadas en las tasas medias de mortalidad por pesca durante 2013-2015. La<br />
línea de trazos horizontal identifica el SBR en RMS. La línea sólida ilustra las estimaciones de<br />
verosimilitud máxima, y las estimaciones a partir de 2016 (el punto grande) señalan el SBR predicho si<br />
las tasas de mortalidad por pesca continúan en el promedio observado durante 2013-2015. Las líneas de<br />
trazos representan los intervalos de confianza de 95% alrededor de esas estimaciones.
FIGURE D.6. Kobe (phase) plot of the time series of estimates of spawning stock size (top panel:<br />
spawning biomass; bottom panel: total biomass aged 3+ quarters) and fishing mortality relative to their<br />
MSY reference points. The colored panels represent interim target reference points (S MSY and F MSY; solid<br />
lines) and limit reference points (dashed lines) of 0.38 S MSY and 1.6 F MSY , which correspond to a 50%<br />
reduction in recruitment from its average unexploited level based on a conservative steepness value (h =<br />
0.75) for the Beverton-Holt stock-recruitment relationship. Each dot is based on the average fishing<br />
mortality rate over three years; the large dot indicates the most recent estimate. The squares around the<br />
most recent estimate represent its approximate 95% confidence interval. The triangle represents the first<br />
estimate (1975).<br />
FIGURA D.6. Gráfica de Kobe (fase) de la serie de tiempo de las estimaciones del tamaño de la<br />
población reproductora (panel superior: biomasa reproductora; panel inferior: biomasa total de edad 3+<br />
trimestres) y la mortalidad por pesca relativas a sus puntos de referencia de RMS. Los recuadros<br />
colorados representan los puntos de referencia objetivo provisionales (S RMS y 1F RMS; líneas sólidas) y los<br />
puntos de referencia límite (líneas de trazos) de 0,38 S RMS y 1,6 F RMS , que corresponden a una reducción<br />
de 50% del reclutamiento de su nivel medio no explotado basada en un valor cauteloso (h = 0.75) de la<br />
inclinación de la relación población-reclutamiento de Beverton-Holt. Cada punto se basa en la tasa de<br />
explotación media de un trienio; el punto grande indica la estimación más reciente. Los cuadros alrededor<br />
de la estimación más reciente representan su intervalo de confianza de 95% aproximado. El triángulo<br />
representa la primera estimación (1975).<br />
85
86<br />
TABLE D.1. Estimates of the MSY and its associated quantities for bigeye tuna for the base case<br />
assessment and the sensitivity analyses. All analyses are based on average fishing mortality during 2013-<br />
2015. B recent and B MSY are defined as the biomass of fish 3+ quarters old (in metric tons) at the beginning<br />
of 2016 and at MSY, respectively. S recent and S MSY are in metric tons. C recent is the estimated total catch in<br />
2015. The F multiplier indicates how many times effort would have to be effectively increased to achieve<br />
the MSY in relation to the average fishing mortality during 2013-2015.<br />
TAB<strong>LA</strong> D.1. Estimaciones del RMS y sus cantidades asociadas para el atún patudo para la evaluación del<br />
caso base y los análisis de sensibilidad. Todos los análisis se basan en la mortalidad por pesca promedio<br />
de 2013-2015. Se definen B recent y B RMS como la biomasa de peces de 3+ trimestres de edad (en toneladas)<br />
al principio de 2016 y en RMS, respectivamente. Se expresan S recent y S MSY en toneladas métricas. C recent<br />
es la captura total estimada en 2015. El multiplicador de F indica cuántas veces se tendría que<br />
incrementar el esfuerzo para lograr el RMS en relación con la mortalidad por pesca media durante 2013-<br />
2015.<br />
Base case-<br />
Caso base<br />
h = 0.75<br />
MSY-RMS 107,864 107,595<br />
B MSY - B RMS 389,211 726,606<br />
S MSY - S RMS 95,101 200,215<br />
B MSY /B 0 - B RMS /B 0 0.26 0.34<br />
S MSY /S 0 - S RMS /S 0 0.21 0.30<br />
C recent /MSY- C recent /RMS 0.97 0.97<br />
B recent /B MSY - B recent /B RMS 1.00 0.83<br />
S recent /S MSY -S recent /S RMS 0.96 0.81<br />
F multiplier-<br />
Multiplicador de F 1.05 0.91
87<br />
D. ATÚN PATUDO<br />
Este informe presenta la evaluación más actual de la población de atún patudo (Thunnus obesus) en el<br />
Océano Pacífico oriental (OPO). Se usó un modelo modelo estadístico integrado de evaluación de<br />
poblaciones con estructura por edad (Stock Synthesis 3.23b).<br />
Han ocurrido cambios sustanciales en la pesquería de atún patudo en el OPO en las décadas recientes<br />
(Figura D-1). Inicialmente, la mayor parte de la captura de patudo era tomada por buques palangreros.<br />
Con la expansión de las pesquerías sobre dispositivos agregadores de peces (plantados) desde 1993, la<br />
pesquería de cerco ha tomado un componente creciente de la captura de patudo. En los últimos años, las<br />
capturas cerqueras de patudo fueron tomadas principalmente entre 5°N y 5°S sur a través del Pacífico<br />
ecuatorial al oeste hasta el límite occidental (150°O) del OPO (Figura D-3). Las capturas palangreras de<br />
patudo en el OPO son tomadas predominantemente por debajo de 5°S, pero una porción sustancial es<br />
también tomada al norte de 10°N (Figura D-4). Se realiza la evaluación como si existiese una sola<br />
población de patudo en el OPO, con desplazamientos netos mínimos de peces entre el OPO y el Océano<br />
Pacífico central y occidental (OPCO). Los resultados son consistentes con aquellos de otros análisis del<br />
patudo a escala del Pacífico entero. No obstante, en la distribución de las capturas de patudo se extiende<br />
por todo el Océano Pacífico ecuatorial. Además, recientemente se acumuló una gran cantidad de datos de<br />
marcado convencional y electrónico del Pacific Tuna Tagging Programme, que ha enfocado sus esfuerzos<br />
de marcado de patudo entre 180° y 140°O desde 2008. Las marcas recuperadas muestran claramente que<br />
ocurren extensos desplazamientos longitudinales de patudo a través del límite de la CIAT en 150°O, en<br />
particular de oeste a este. El personal de la CIAT está colaborando con la Secretaría de la Comunidad del<br />
Pacífico (SPC) en una evaluación actualizada del patudo a escala del Pacífico entero. Esta investigación<br />
incorporará los nuevos datos de marcado en un modelo de dinámica poblacional con estructura espacial,<br />
lo cual ayudará a evaluar sesgos potenciales que resulten del método actual de realizar evaluaciones<br />
separadas para el OPO y el OPCO.<br />
La evaluación del atún patudo en el OPO en 2015 es similar a la evaluación previa, excepto que se<br />
dispone ahora de series separadas de datos de frecuencia de talla de buques palangreros japoneses<br />
comerciales y de entrenamiento, y se usaron ambos en la evaluación. Los resultados de esta evaluación<br />
indican una tendencia de recuperación del patudo en el OPO durante 2005-2009, subsiguiente a las<br />
resoluciones de conservación de atún de la CIAT iniciadas en 2004 (Figura D-5). No obstante, aunque las<br />
resoluciones han continuado desde 2009, la tendencia recuperativa no fue mantenida durante 2010-2012,<br />
y el cociente de biomasa reproductora (SBR) disminuyó paulatinamente a un nivel históricamente bajo de<br />
0.16 al principio de 2013. Esta disminución podría estar relacionada con una serie de reclutamientos<br />
recientes inferiores al promedio que coincidieron con una serie de eventos fuertes de La Niña (Figura<br />
D-2). Más recientemente, se estima que el SBR aumentó ligeramente de 0.16 en 2013 a 0.20 al principio<br />
de 2016; en el modelo, este aumento es impulsado principalmente por el incremento reciente de la captura<br />
por unidad de esfuerzo (CPUE) de las pesquerías palangreras que capturan patudo adulto. Los niveles<br />
recientes y futuros del reclutamiento y biomasa son inciertos.<br />
Han ocurrido cambios importantes en la cantidad de mortalidad por pesca (F) causada por las pesquerías<br />
que capturan patudo en el OPO. En promedio, desde 1993 la mortalidad por pesca de patudo de menos de<br />
unos 15 trimestres de edad ha aumentado sustancialmente, y la de patudo de más de unos 15 trimestres de<br />
edad también ha aumentado, por ewn menor grado (Figura D-3). Este aumento de la mortalidad por pesca<br />
de los peces más jóvenes fue causado por la expansión de las pesquerías cerqueras que capturan atunes<br />
asociados a objetos flotantes. Queda claro que la pesquería palangrera tuvo el mayor impacto sobre la<br />
población antes de 1995, pero con la disminución del esfuerzo palangrero y la expansión de la pesquería<br />
sobre objetos flotantes, actualmente el impacto de la pesquería cerquera sobre la población de patudo es<br />
mucho mayor que aquel de la pesquería palangrera (Figura D-4). Los descartes de patudo pequeño ejercen<br />
un impacto pequeño, pero detectable, sobre la disminución de la población.
88<br />
Con los niveles actuales de mortalidad por pesca, y si continúan los niveles recientes del esfuerzo y<br />
capturabilidad y el reclutamiento sigue promedio, se predice que la biomasa reproductora (S) seguirá<br />
recuperándose, y se estabilizará en aproximadamente 0.22 (Figura D-5), por encima del nivel<br />
correspondiente al rendimiento máximo sostenible (RMS) (0.21). Estas interpretaciones son inciertas y<br />
altamente sensibles a los supuestos hechos con respecto al parámetro de inclinación (h) de la relación<br />
población-reclutamiento, la ponderación asignada a los datos de composición por tamaño, la curva de<br />
crecimiento, y los niveles supuestos de mortalidad natural (M) juvenil y adulta.
89<br />
E. PACIFIC BLUEFIN TUNA<br />
Tagging studies have shown that there is exchange of Pacific bluefin between the eastern and western<br />
Pacific Ocean. Larval, postlarval, and early juvenile bluefin have been caught in the western Pacific<br />
Ocean (WPO), but not in the eastern Pacific Ocean (EPO), so it is likely that there is a single stock of<br />
bluefin in the Pacific Ocean (or possibly two, one spawning in the vicinity of Taiwan and the Philippines<br />
and the other spawning in the Sea of Japan).<br />
Most of the commercial catches of bluefin in the EPO are taken by purse seiners. Nearly all of the purseseine<br />
catches have been made off Baja California and California, within about 100 nautical miles of the<br />
coast, between about 23°N and 35°N. Ninety percent of the fish in the catch are estimated to have been<br />
between about 60 and 100 cm in length, representing mostly fish 1 to 3 years of age. Aquaculture<br />
facilities for bluefin were established in Mexico in 1999, and some Mexican purse seiners began to direct<br />
their effort toward bluefin during that year. During recent years, most of the catches have been<br />
transported to holding pens, where the fish are held for fattening and later sale to sashimi markets. Lesser<br />
amounts of bluefin are caught by recreational, gillnet, and longline gear. Bluefin have been caught in the<br />
EPO during every month of the year, but most of the fish are taken from May through October.<br />
Bluefin are exploited by various gears in the WPO from Taiwan to Hokkaido, Japan. Age-0 fish, about<br />
15 to 30 cm in length, are caught by the Japanese troll fishery during July-October south of Shikoku<br />
Island and south of Shizuoka Prefecture. During November-April, age-0 fish about 35 to 60 cm in length<br />
are taken in troll fisheries south and west of Kyushu Island. Age-1 and older fish are caught by purse<br />
seining, mostly during May-September, between about 30°-42°N and 140°-152°E. Bluefin of various<br />
sizes are also caught by traps, gillnets, and other gear, especially in the Sea of Japan. Additionally, small<br />
amounts of bluefin are caught near the southeastern coast of Japan by longlining. The Chinese Taipei<br />
small-scale longline fishery, which has expanded since 1996, takes bluefin tuna more than 180 cm in<br />
length from late April to June, when they are aggregated for spawning in the waters east of the northern<br />
Philippines and Taiwan.<br />
The high-seas longline fisheries are directed mainly at tropical tunas, albacore, and billfishes, but small<br />
amounts of Pacific bluefin are caught by these fisheries. Small amounts of bluefin are also caught by<br />
Japanese pole-and-line vessels on the high seas.<br />
Tagging studies, conducted with conventional and archival tags, have revealed a great deal of information<br />
about the life history of bluefin. Some fish apparently remain their entire lives in the WPO, while others<br />
migrate to the EPO. These migrations begin mostly during the first and second years of life. The firstand<br />
second-year migrants are exposed to various fisheries before beginning their journey to the EPO.<br />
Then, after crossing the ocean, they are exposed to commercial and recreational fisheries off California<br />
and Baja California. Eventually, the survivors return to the WPO.<br />
Bluefin more than about 50 cm in length are most often found in waters where the sea-surface<br />
temperatures (SSTs) are between 17° and 23°C. Fish 15 to 31 cm in length are found in the WPO in<br />
waters with SSTs between 24° and 29°C. The survival of larval and early juvenile bluefin is<br />
undoubtedly strongly influenced by the environment. Conditions in the WPO probably influence<br />
recruitment, and thus the portions of the juvenile fish there that migrate to the EPO, as well as the<br />
timing of these migrations. Likewise, conditions in the EPO probably influence the timing of the<br />
return of the juvenile fish to the WPO.<br />
A full stock assessment was carried out by the Pacific Bluefin Working Group of the International<br />
Scientific Committee for Tuna and Tuna-like Species in the North Pacific Ocean (ISC) in 2016. The<br />
assessment, conducted with Stock Synthesis 3, an integrated statistical age-structured stock assessment<br />
model, was a substantial improvement over the previous assessments. Long-term fluctuations in spawning<br />
stock biomass (SSB) occurred throughout the assessment period (1952-2014), and the SSB has been<br />
declining for more than a decade, with a leveling off in recent years; however, there is no evidence of
90<br />
reduced recruitment. Age-specific fishing mortality has increased by up to 96% (age 2) in the recent<br />
period (2011-2013) relative to the baseline period (2002-2004) used in recent WCPFC and IATTC<br />
conservation measures.<br />
Estimated age-specific fishing mortalities for the stock in the recent period (2011-2013) relative to 2002-<br />
2004 (the base period for the current WCPFC conservation measures) show increases of 96, 4, 86, and<br />
43% for ages 2, 3, 4 and 5, respectively, and decreases of 28 and 1% for ages 0 and 1. Although no target<br />
or limit reference points have been established for the Pacific bluefin stock, the current F (2011-2013<br />
average) is above all target and limit biological reference points commonly used for management. The<br />
current (2014) Pacific bluefin SSB level is near historic low levels, and the ratio of SSB in 2014 relative<br />
to unfished SSB is low.<br />
Stock projections of spawning biomass and catches of Pacific bluefin tuna from 2015 to 2034 were<br />
conducted assuming alternative harvest scenarios. Recent WCPFC and IATTC conservation and<br />
management measures, combined with additional Japanese domestic regulations aimed at reducing<br />
mortality, if properly implemented and enforced, are expected to contribute to improvements in the stock<br />
status of Pacific bluefin tuna.<br />
The IATTC staff conducted an alternative analysis to investigate the robustness of the assessment<br />
(document SAC-07-05d). This analysis confirmed the results of the ISC update assessment.<br />
The total catches of bluefin have fluctuated considerably during the last 50 years (Figure E-1). The<br />
consecutive years of above-average catches (mid-1950s to mid-1960s) and below-average catches (early<br />
1980s to early 1990s) could be due to consecutive years of above-average and below-average<br />
recruitments.<br />
The finding that the north Pacific bluefin stock is at very low levels and the fishing mortality is higher<br />
than any reasonable reference point is robust to model assumptions, and support previous findings. The<br />
stock is projected to rebuild under current management actions (ISC 2016, Executive summary).<br />
However, due to uncertainty in how recruitment is related to the spawning stock size and when<br />
recruitment might be impacted by the low spawning abundance level, there is concern over the low<br />
abundance of spawners. This is exacerbated by the limited number of cohorts that comprise the spawning<br />
biomass.<br />
The IATTC has adopted resolutions to restrict the catch of bluefin tuna in the EPO. Resolutions C-12-<br />
09, C-13-02, and C-14-06 limit the commercial catches in the IATTC Convention Area by all CPCs to a<br />
total 10,000 metric tons during 2012-2013 fishing years , 5,000 metric tons in 2014, and a combined total<br />
of 6,600 metric tons during 2015-2016, respectively.<br />
Reference points<br />
Developing management reference points for bluefin is problematic, due to sensitivity to the stock<br />
assessment model’s assumptions. In particular, absolute levels of biomass and fishing mortality, and<br />
reference points based on maximum sustainable yield (MSY), are hypersensitive to the value of natural<br />
mortality. Relative trends in biomass and fishing mortality levels are more robust to model assumptions.<br />
Therefore, management reference points based on relative biomass or fishing mortality should be<br />
considered for managing bluefin . It is unlikely that these management measures can be designed to<br />
optimize yield, and management should be designed to provide reasonable yields while ensuring<br />
sustainability until the uncertainty in the assessment is reduced.<br />
A management “indicator” was developed that is based on integrating multiple years of fishing<br />
mortality and takes into consideration the age structure of the fishing mortality. The indicator is<br />
based on estimating the impact of fisheries on the stock of fish. The fishery impact over time is used<br />
as an indicator for developing reference points based on historic performance. The assumption is that<br />
if the fishery impact is less than that seen in the past, then the population is likely to be sustainable at
91<br />
current levels of fishing mortality.<br />
The fishery impact indicator is estimated for bluefin based on spawning biomass. The fisheries are<br />
grouped into those in the EPO and those of the WPO because setting management guidelines for the EPO<br />
is the goal of this analysis. The base case assessment developed by the ISC in 2008 is used as the stock<br />
assessment model. The sensitivity of the fishery impact and its use as a management indicator to the<br />
different natural mortality assumptions are evaluated.<br />
The index of impact proposed for management is calculated as the estimate of actual spawning biomass<br />
divided by the hypothetical spawning biomass in the absence of a fishery. This assumes that the impact is<br />
measured under the assumption that the impact of other fisheries is not controlled.<br />
The estimated impact of the fisheries on the bluefin population for the entire time period modeled (1952-<br />
2006) is substantial (Figure E-2). The impact is highly sensitive to the assumed values for natural<br />
mortality. The WPO fisheries have had a greater impact than the EPO fisheries, and their rate of increase<br />
in recent years is greater. The temporal trend in the impact is robust to the assumed level of natural<br />
mortality.<br />
Given the last fact, using the relative fishery impact as an indicator for management advice based on<br />
estimated historical performance may be useful. The impact of the EPO fisheries was substantially less<br />
during 1994-2007 than it was during 1970-1993, when bluefin was reduced to a much lower level;<br />
however, the impact has been increasing recently. The estimated status of bluefin is uncertain, and is<br />
sensitive to model assumptions. Catch levels should be set based on the years in which the impact was<br />
low until the uncertainty in the assessment is reduced. This management measure should ensure that the<br />
fishery is sustainable, provided equivalent measures are taken in the WPO.<br />
FIGURE E-1. Retained catches of Pacific bluefin tuna.<br />
FIGURA E-1. Capturas retenidas de atún aleta azul del Pacífico.
92<br />
FIGURE E-2. Estimates of the impact on the Pacific bluefin tuna population of fisheries in the EPO<br />
and in the WPO (upper panel). The dashed line represents the estimated hypothetical unfished<br />
spawning biomass, and the solid line the estimated actual spawning biomass. The shaded areas<br />
indicate the impact attributed to each fishery. The lower panel presents the proportion of impact<br />
attributed to the EPO and WPO.<br />
FIGURA E-2. Estimaciones del impacto sobre la población de atún aleta azul del Pacífico de las<br />
pesquerías en el OPO y en el WPO (panel superior). La línea de trazos representa la biomasa<br />
reproductora no pescada hipotética estimada, y la línea sólida la biomasa reproductora real estimada. Las<br />
áreas sombreadas indican el impacto atribuido a cada pesquería. El panel inferior ilustra la proporción del<br />
impacto atribuida al OPO y al WPO.
93<br />
E. ATÚN ALETA AZUL DEL PACÍFICO<br />
Los estudios de marcado han demostrado que ocurre intercambio de aleta azul del Pacífico entre el<br />
Océano Pacífico oriental (OPO) y occidental. Se han capturado aletas azules larvales, poslarvales, y<br />
juveniles tempranos en el Pacífico occidental, pero no en el OPO, por lo que es probable que exista una<br />
sola población de aleta azul en el Océano Pacífico (o posiblemente dos poblaciones, una que desova cerca<br />
de Taiwán y Filipinas y otra que desova en el Mar de Japón).<br />
La mayor parte de las capturas comerciales de aleta azul en el OPO es realizada por buques cerqueros.<br />
Casi todas las capturas cerqueras son realizadas al oeste de Baja California y California, a menos de unas<br />
100 millas náuticas de la costa, entre aproximadamente 23°N de y 35°N. Se estima que el 90% de la<br />
captura mide entre 60 y 100 cm de talla, lo cual representa principalmente peces de entre 1 y 3 años de<br />
edad. En 1999 es establecieron instalaciones de acuicultura del aleta azul en México, y algunos cerqueros<br />
mexicanos comenzaron a dirigir sus esfuerzos hacia el aleta azul durante ese año. En años recientes, la<br />
mayoría de la captura ha sido transportada a jaulas, donde se mantienen los peces para engordarlos y<br />
luego venderlos al mercado de sashimi. Se capturan cantidades menores de aleta azul con artes<br />
recreacionales, redes de transmalle, y palangre. Se han capturado aletas azules en el OPO durante todos<br />
los meses del año, pero la mayor parte de la captura es lograda entre mayo y octubre.<br />
El aleta azul es explotado con varias artes en el Pacífico occidental desde Taiwán hasta Hokkaido, Japón.<br />
La pesquería curricanera japonesa captura peces de edad 0, de unos 15 a 30 cm de talla, durante juliooctubre<br />
al sur de la isla Shikoku y al sur de la Prefectura de Shizuoka. Durante noviembre-abril, se<br />
capturan peces de edad 0, de entre unos 35 y 60 cm de talla, en pesquerías curricaneras al sur y oeste de la<br />
isla Kyushu. Peces de edad 1y mayores son capturados con red de cerco, principalmente durante mayoseptiembre,<br />
entre aproximadamente 30°-42°N y 140°-152°E. Aletas azules de varios tamaños son también<br />
capturados con almadrabas, redes de trasmalle, y otras artes, especialmente en el Mar de Japón.<br />
Adicionalmente, son capturadas pequeñas cantidades de aleta azul cerca de la costa sudeste de Japón con<br />
palangre. La pesquería palangrera a pequeña escala de Taipei Chino, que se ha expandido desde 1996,<br />
captura aleta azul de más de 180 cm de talla desde fines de abril hasta junio, cuando se concentran para<br />
desovar en aguas al este del norte de Filipinas y Taiwán.<br />
Las pesquerías palangreras de alta mar están dirigidas principalmente hacia los atunes tropicales,<br />
albacora, y peces picudos, pero capturan pequeñas cantidades de aleta azul del Pacífico. Son capturadas<br />
también pequeñas cantidades de aleta azul por buques cañeros japoneses en alta mar.<br />
Los estudios de marcado, usando marcas convencionales y archivadoras, han descubierto una gran<br />
cantidad de información acerca del ciclo vital del aleta azul. Algunos peces aparentemente permanecen su<br />
vida entera en el Pacífico occidental, mientras que otros migran al OPO. Las migraciones comienzan<br />
principalmente durante el primer y segundo año de vida. Los migrantes de primer o segundo año están<br />
expuestos a varias pesquerías antes de comenzar su viaje al OPO. Suego, después de cruzar el océano,<br />
están expuestos a las pesquerías comerciales y recreacionales frente a California y Baja California. A la<br />
larga, los supervivientes regresan al Pacífico occidental.<br />
Se encuentran aletas azules de más de unos 50 cm de talla con mayor frecuencia en aguas con una<br />
temperatura superficial del mar (TSM) de entre 17° y 23°C. En el Pacífico occidental se encuentran peces<br />
de entre 15 y 31 cm de talla en aguas con TSM entre 24 y 29 °C. La supervivencia de los aletas azules<br />
larvales y juveniles tempranos es sin duda fuertemente afectada por el medio ambiente. Las condiciones<br />
en el Pacífico occidental probablemente afectan el reclutamiento, y por lo tanto las porciones de los peces<br />
juveniles en esa zona que migran al OPO, así como cuándo ocurren estas migraciones. Similarmente, las<br />
condiciones en el OPO afectan probablemente cuándo los peces juveniles regresan al Pacífico occidental.<br />
El Grupo de Trabajo sobre el aleta azul del Pacífico del Comité Científico Internacional para los Atunes y<br />
Especies Afines en el Océano Pacífico Norte (ISC) realizó una evaluación completa de la población en<br />
2016. La evaluación fue realizada con Stock Synthesis, un modelo de evaluación de poblaciones
94<br />
estadístico integrado con estructura por edad. La evaluación fue una mejora sustancial con respecto a las<br />
evaluaciones previas. Ocurrieron fluctuaciones a largo plazo de la biomasa reproductora de la población<br />
(SSB) durante todo el periodo de la evaluación (1952-2014), y la SSB viene disminuyendo desde hace<br />
más de una década, con una estabilización en años recientes; no obstante, no existen pruebas de un<br />
reclutamiento reducido. La mortalidad por pesca por edad ha aumentado a 96% (edad 2) en el periodo<br />
reciente (2011-2013) relativa al periodo base (2002-2004) usando en las medidas de conservación<br />
recientes de la WCPFC y la CIAT.<br />
La mortalidad por pesca por edad estimada de la población en el periodo reciente (2011-2013) relativa a<br />
2002-2004 (el periodo base para las medidas de conservación actuales de la WCPFC) muestra aumentos<br />
de 96, 4, 86, y 43% para las edades de 2, 3, 4 y 5, respectivamente, y disminuciones de 28 y 1% para las<br />
edades de 0 y 1. Aunque no se han establecido puntos de referencia objetivo o límite para la población de<br />
aleta azul del Pacífico, la F actual (promedio de 2011-2013) está por encima de todos los puntos de<br />
referencia biológicos objetivo y límite usados comúnmente para la ordenación. La SSB actual (2014) del<br />
aleta azul del Pacífico está cerca de niveles históricamente bajos, y la razón de la SSB en 2014 a la SSB<br />
sin pesca es baja.<br />
Se realizaron proyecciones de la biomasa reproductora y las capturas de aleta azul del Pacífico de 2015<br />
2034, suponiendo escenarios alternativos de extracción. Se espera que las medidas recientes de<br />
conservación y ordenación de la WCPFC y CIAT, combinadas con reglamentos nacionales japoneses<br />
encaminados a reducir la mortalidad, si se implementan y aplican debidamente, contribuyan a mejoras en<br />
la condición de la población de atún aleta azul del Pacífico.<br />
El personal de la CIAT realizó un análisis alternativo para investigar la robustez de la evaluación<br />
(documento SAC-07-05d). Este análisis confirmó los resultados de la evaluación del ISC.<br />
Las capturas totales de aleta azul han fluctuado considerablemente durante los últimos 50 años (Figura E-<br />
1). Los años consecutivos de capturas superiores al promedio (mediados de los años 1950 a mediados de<br />
los 1960) e inferiores al promedio (principios de los 1980 a principios de los 1990) podrían ser debidos a<br />
años consecutivos de reclutamientos superiores al promedio e inferiores al promedio.<br />
El resultado que la población de aleta azul del Pacífico norte se encuentra en niveles muy bajos y que la<br />
mortalidad por pesca está por encima de cualquier punto de referencia razonable es robusto a los<br />
supuestos del modelo, y apoya los resultados previos. Se proyecta que la población se recuperará bajo las<br />
acciones de ordenación actuales (ISC 2016, resumen ejecutivo). No obstante, debido a incertidumbre con<br />
respecto a la relación entre el tamaño de la población reproductora y el reclutamiento y cuándo el<br />
reclutamiento podría ser afectado por el bajo nivel de abundancia de reproductores, existe preocupación<br />
acerca de la baja abundancia de reproductores. Esto es exacerbado por el número limitado de cohortes que<br />
constituyen la biomasa reproductora.<br />
La CIAT ha adoptado resoluciones para limitar la captura de atún aleta azul en el OPO. Las resoluciones<br />
C-12-09, C-13-02, y C-14-06 limitan las capturas comerciales en el Área de la Convención de la CIAT<br />
por todos los CPC a un total de 10,000 t durante los años pesqueros 2012-2013, 5,000 t en 2014, y un<br />
total combinado de 6,600 t durante 2015-2016, respectivamente.<br />
Puntos de referencia<br />
Desarrollar puntos de referencia para la ordenación del aleta azul es problemático, debido a la sensibilidad<br />
a los supuestos del modelo de evaluación. En particular, los niveles absolutos de biomasa y mortalidad<br />
por pesca, y los puntos de referencia basados en el rendimiento máximo sostenible (RMS), son<br />
hipersensibles al valor de mortalidad natural. Las tendencias relativas de la biomasa y la mortalidad por<br />
pesca son robustas a los supuestos del modelo. Por lo tanto, se deberían considerar para la ordenación del<br />
aleta azul puntos de referencia basados en biomasa o mortalidad por pesca relativa. Es poco probable que<br />
estas medidas de ordenación puedan ser diseñadas para optimizar el rendimiento, y la ordenación debería<br />
ser diseñada para producir rendimientos razonables y al mismo tiempo asegurar la sustentabilidad hasta
95<br />
que se reduzca la incertidumbre en la evaluación.<br />
Se desarrolló un « indicador » basado en integrar múltiples años de mortalidad por pesca y tomar en<br />
consideración la estructura por edad de la mortalidad por pesca. El indicador se basa en estimar el<br />
impacto de la pesca sobre la población de peces. Se usa el impacto de la pesca a lo largo del tiempo como<br />
indicador para desarrollar puntos de referencia basados en desempeño histórico. El supuesto es que, si el<br />
impacto de la pesca es menos de lo que se ha observado en el pasado, es entonces probable que la<br />
población sea sustentable con los niveles actuales de mortalidad por pesca..<br />
Se estima el indicador de impacto de pesca para el aleta azul con base en la biomasa reproductora. Se<br />
agrupan las pesquerías en aquellas en el OPO y aquellas en el Pacífico occidental porque fijar directrices<br />
de ordenación para el OPO es el objetivo de este análisis. Se usa la evaluación del caso base desarrollada<br />
por el ISC en 2008 como modelo de evaluación de la población. Se evalúan la sensibilidad del impacto de<br />
la pesca y su uso como indicador de ordenación con los distintos supuestos de mortalidad natural.<br />
El índice de impacto de la pesca propuesto para la ordenación es calculado como la estimación de la<br />
biomasa reproductora real dividida por la biomasa reproductora hipotética en ausencia de pesca. Esto<br />
supone que se mide el impacto bajo el supuesto que el impacto de otras pesquerías no es controlado.<br />
El impacto estimado de las pesquerías sobre la población de aleta azul durante todo el periodo de tiempo<br />
modelado (1952-2006) es sustancial (Figura E-2). El impacto es altamente sensible a los valores<br />
supuestos de mortalidad natural. Las pesquerías del Pacífico occidental han tenido un impacto mayor que<br />
aquellas del OPO, y su tasa de aumento en años recientes es mayor. La tendencia temporal del impacto es<br />
robusta al niveles supuestos de mortalidad natural.<br />
En vista de éste último, podría ser útil usar el impacto relativo de la pesca como indicador de ordenación<br />
de asesoramiento e indican de ordenación basado en el desempeño histórico estimado. El impacto de las<br />
pesquerías del OPO fue sustancialmente menor durante 1994 -2007 que durante 1970 -1923, cuando el<br />
aleta azul estaba reducido a un nivel mucho menor; sin embargo, el impacto viene aumentando<br />
recientemente. La condición estimada del aleta azul es incierta, es sensible a los supuestos del modelo de<br />
Sevilla se deberían fijar los niveles de captura con base en los años en los que el impacto fue bajo hasta<br />
que se reduzca la incertidumbre en la evaluación. Esta medida de ordenación debería asegurar que la<br />
pesquerías sostenible, siempre que se tomen medidas equivalentes en el Pacífico occidental.
96<br />
F. ALBACORE TUNA<br />
There are two stocks of albacore in the Pacific Ocean, one occurring in the northern hemisphere and the<br />
other in the southern hemisphere. Albacore are caught by longline gear in most of the North and South<br />
Pacific, but not often between about 10°N and 5°S, by trolling gear in the eastern and central North and<br />
South Pacific, and by pole-and-line gear in the western North Pacific. In the North Pacific about 57% of<br />
the fish are taken in pole-and-line and troll fisheries that catch smaller, younger albacore, whereas about<br />
95% of the albacore caught in the South Pacific are taken by longline. The total annual catches of North<br />
Pacific albacore peaked in 1976 at about 125,000 t, declined to about 38,000 t in 1991, and then increased<br />
to about 122,000 t in 1999 (Figure F-1a). Following a second decline in the early 2000s, catches have<br />
recovered slightly, and have fluctuated between about 69,000 and 95,000 t in recent years (2006-2013).<br />
During 2010-2014 the average annual catch was about 84,000 t. The total annual catches of South Pacific<br />
albacore ranged from about 25,000 to 50,000 t during the 1980s and 1990s, but increased after that,<br />
ranging from about 59,000 to 88,000 t during 2003-2013 (Figure F-1b). During 2010-2014 the average<br />
annual catch was about 82,000 t.<br />
Juvenile and adult albacore are caught mostly in the Kuroshio Current, the North Pacific Transition Zone,<br />
and the California Current in the North Pacific and in the Subtropical Convergence Zone in the South<br />
Pacific, but spawning occurs in tropical and subtropical waters, centering around 20ºN and 20ºS latitudes.<br />
North Pacific albacore are believed to spawn between March and July in the western and central Pacific.<br />
The movements of North Pacific albacore are strongly influenced by oceanic conditions, and<br />
migrating albacore tend to concentrate along oceanic fronts in the North Pacific Transition Zone.<br />
Most of the catches are made in water temperatures between about 15º and 19.5ºC. Details of the<br />
migration remain unclear, but juvenile fish (2- to 5-year-olds) are believed to move into the eastern<br />
Pacific Ocean (EPO) in the spring and early summer, and return to the western and central Pacific,<br />
perhaps annually, in the late fall and winter, where they tend to remain as they mature. This pattern<br />
may be complicated by sex-related movements of large adult fish (fork length > 125 cm), which are<br />
predominately male, to areas south of 20°N. The significance of such movements for the<br />
demographic dynamics of this stock are uncertain at present.<br />
Less is known about the movements of albacore in the South Pacific Ocean. The juveniles move<br />
southward from the tropics when they are about 35 cm long, and then eastward along the Subtropical<br />
Convergence Zone to about 130°W. When the fish approach maturity they return to tropical waters,<br />
where they spawn. Recoveries of tagged fish released in areas east of 155°W were usually made at<br />
locations to the east and north of the release site, whereas those of fish released west of 155°W were<br />
usually made at locations to the west and north of the release site.<br />
The most recent stock assessments for the South and North Pacific stocks of albacore were presented in<br />
2012 and 2014, respectively.<br />
The assessment of South Pacific albacore, which was carried out in 2012 with MULTIFAN-CL by<br />
scientists of the Secretariat of the Pacific Community, incorporated catch and effort data, lengthfrequency<br />
data, tagging data, and information on biological parameters. Although there were sources of<br />
structural uncertainty, in particular growth, it was concluded that the stock was above the level<br />
corresponding to the maximum sustainable yield (MSY). Specifically, the current abundance relative to<br />
biomass-based reference points B current /B MSY and SB current /SB MSY is estimated to be above 1.0, and therefore<br />
the stock was not in an overfished state. In addition, it was concluded that the risk of overfishing occuring<br />
was low (the median of the most recent fishing mortality estimate relative to the fishing mortality<br />
reference point F current /F MSY was 0.21). There appeared to be no need to restrict the fisheries for albacore<br />
in the South Pacific Ocean, but additional research to attempt to resolve the uncertainties in the data was<br />
recommended. A new stock assessment of South Pacific albacore is currently being carried out by<br />
scientists of the Secretariat of the Pacific Community (SPC), and will be presented to the Scientific<br />
Committee of the Western and Central Pacific Fisheries Commission (WCPFC) in August 2015.
97<br />
An assessment of North Pacific albacore using fisheries data through 2012 was conducted at a<br />
workshop of the Albacore Working Group of the International Scientific Committee for Tuna and<br />
Tuna-like Species in the North Pacific Ocean (ISC), held in April 2014. The stock was assessed<br />
using an age- and sex-structured Stock Synthesis (SS Version 3.24f) model fitted to time series of<br />
standardized CPUE and size-composition data over a 1966 to 2012 time frame. The base-case model<br />
was fitted to the Japanese pole-and-line (PL) and longline (LL) indices, which were considered by<br />
the Working Group to be the most representative indices of abundance trends for juveniles and<br />
adults, respectively. All available fishery data from the Pacific Ocean north of the equator were used<br />
for the stock assessment, which assumed a single well-mixed stock. Sex-specific growth curves were<br />
used because there is evidence of sexually dimorphic growth, with male albacore attaining greater<br />
sizes and ages than females. The assumed value of the steepness parameter (h) in the Beverton-Holt<br />
stock-recruitment relationship was 0.9, based on two separate external estimates of this parameter.<br />
The assessment model was fitted to the abundance indices and size-composition data in a likelihoodbased<br />
statistical framework. Maximum likelihood estimates of model parameters, derived outputs,<br />
and their variances were used to characterize stock status. Several sensitivity analyses were<br />
conducted to evaluate both changes in model performance and the range of uncertainty resulting from<br />
changes in model parameters, including some of the data series used in the analyses, growth curve<br />
parameters, natural mortality, stock-recruitment steepness, initial year, selectivity estimation, and<br />
weighting of size-composition data. The conclusions reached at that workshop were presented to the<br />
eleventh plenary meeting of the ISC, held in August 2014. Among these were the following:<br />
1. The base-case model estimates that the spawning stock biomass (SSB) has likely fluctuated between<br />
98,000 and 204,000 t between 1966 and 2012 (Figure F-2), and that recruitment has averaged about<br />
43 million fish annually during this period. There are periods of above- and below-average<br />
recruitment at the beginning of the assessment time frame, followed by fluctuations around the<br />
average since the 1990s. Female SSB was estimated to be approximately 110,101 t in the terminal<br />
year of the assessment (2012), and stock depletion is estimated to be 35.8% of unfished SSB.<br />
2. The estimated spawners per recruit (SPR) relative to the unfished population in the terminal year of<br />
the assessment is 0.41, which corresponds to a relatively low exploitation level (i.e., 1-SPR = 0.59).<br />
While the base case model’s estimate of current F-at-age on juvenile fish is lower than in 2002-2004,<br />
and current F on adult fish (50% of age-5 fish, and all fish age 6 and older) is higher, on average,<br />
than during 2002-2004.<br />
3. The Kobe plot (Figure F-3) depicts the status of the stock in relation to MSY-based and MSY proxy<br />
reference points from the base-case model. The plot is presented for illustrative purposes only, since<br />
the IATTC has not established biological reference points for north Pacific albacore . The ISC<br />
Working Group concluded that the stock is likely not in an overfished condition at present, as there is<br />
little evidence from the assessment that fishing has reduced SSB below reasonable candidate<br />
biomass-based reference points.<br />
4. Under the base-case model, the point estimate (± SD) of maximum sustainable yield (MSY) is<br />
105,571 ± 14,759 t, and the point estimate of spawning biomass to produce MSY (SSB MSY , adult<br />
female biomass) is 49,680 ± 6,739 t. The ratio of F 2010-2012 /F MSY is estimated to be 0.52, and the ratio<br />
of F 2002-2004 /F MSY (2002-2004 are the reference years for IATTC conservation and management<br />
measures for north Pacific albacore) is estimated to be 0.76.<br />
5. Stochastic stock projections were conducted externally to the base case model to evaluate the<br />
impact of various levels of fishing intensity on future female SSB for north Pacific albacore.<br />
Future recruitment was based on random resampling of historical recruitment for three periods:<br />
(1) low recruitment (about 29 million recruits), 1983-1989, (2) average recruitment (about 43<br />
million), 1966-2010, and high recruitment (about 55 million recruits), 1966-1975. These<br />
calculations incorporate the structure of the assessment model (e.g., multi-fleet, multi-season,
98<br />
size- and age-selectivity) to produce results consistent with the assessment model. Projections<br />
started in 2011 and continued through 2041 under two levels of fishing mortality (constant F 2010-<br />
2012, constant F 2002-2004 ) and constant catch averaged for 2010-2012, and three levels of<br />
recruitment (low, average, and high, as defined above). Based on these projections, the stock<br />
performs better under the constant F 2010-2012 harvest scenario than the constant F 2002-2004 harvest<br />
scenario. Assuming average historical recruitment and fishing at a constant current F, median<br />
female SSB is expected to remain relatively stable between the 25 th and median historical<br />
percentiles over both the short and long term. In contrast, if a low-recruitment scenario is<br />
assumed, then median female SSB declines under both harvest scenarios. The high-recruitment<br />
scenario is more optimistic, with median SSB increasing above the historical median SSB.<br />
6. The Working Group concluded that the north Pacific albacore stock is not experiencing<br />
overfishing and is probably not in an overfished condition. The current exploitation level (F 2010-<br />
2012) is estimated to be below that of F 2002-2004 , which had led previously to the implementation of<br />
conservation and management measures for the stock in the eastern Pacific (IATTC<br />
Resolution C-05-02, supplemented by Resolution C-13-03) and the western and central Pacific<br />
Ocean (WCPFC CMM 2005-03). The Working Group noted that there is no evidence that fishing<br />
has reduced SSB below thresholds associated with the majority of biomass-based reference<br />
points that might be chosen and that population dynamics in the north Pacific albacore stock are<br />
largely driven by recruitment, which is affected by both environmental changes and the stockrecruitment<br />
relationship. The Working Group concluded that the north Pacific albacore stock is<br />
healthy, and that current productivity is sufficient to sustain recent exploitation levels, assuming<br />
average historical recruitment in both the short and long term.<br />
7. The Working Group noted that the lack of sex-specific size data, the absence of updated estimates of<br />
important life history parameters (natural mortality, maturity), and the simplified treatment of the<br />
spatial structure of north Pacific albacore population dynamics are important sources of uncertainty in<br />
the assessment.<br />
In 2013 the IATTC adopted resolution C-13-03 on North Pacific albacore, which supplemented C-05-02 .<br />
By 1 December 2013, all CPCs were required to report catch, by gear and effort directed at northern<br />
albacore, in the Convention Area during 2007-2012, as well as the average effort for 2002-2004. The<br />
effort in vessel-days during 2007-2012 was only 2% higher than during 2002-2004, and the average<br />
number of vessels operating during 2007-2012 was about 7% lower than during 2002-2004.<br />
Currently the Working Group is developing a work plan to implement a Management Strategy Evaluation<br />
for the North Pacific albacore stock.
99<br />
FIGURE F-1a. Retained catches of North Pacific albacore.<br />
FIGURA F-1a. Capturas retenidas de albacora del Pacífico norte.<br />
FIGURE F-1b. Retained catches of South Pacific albacore.<br />
FIGURA F-1b. Capturas retenidas de albacora del Pacífico sur.
100<br />
FIGURE F-2. Spawning stock biomass of North Pacific albacore tuna, from the North Pacific Albacore<br />
Workshop analysis of 2012.<br />
FIGURA F-2. Biomasa de la población reproductora del atún albacora del Pacífico norte, de los análisis<br />
de la Reunión Técnica sobre el albacora del Pacífico norte de 2012.
FIGURE F-3. Kobe (phase) plot for the North Pacific albacore stock from the base-case assessment<br />
model (which assumes a steepness value of 0.9). The F proxy is computed as (1-(Spawning biomass per<br />
recruit [year] / Spawning biomass per recruit [virgin])). The limit and target reference points are those<br />
proposed by the IATTC staff and are included here for illustrative purposes. The dashed lines represent<br />
the proposed limit reference points. The limit biomass reference point corresponds to a depletion level<br />
that causes a 50% reduction in recruitment from its average unexploited level based on a conservative<br />
steepness value (h = 0.75). The limit fishing mortality reference point corresponds to the fishing mortality<br />
that will drive the population to the limit biomass reference point. The squares around the most recent<br />
estimate represent its approximate 95% confidence interval. The triangle is the first estimate (1966).<br />
FIGURA F-3. Gráfica de Kobe (fase) para la población de atún albacora del Pacífico norte del modelo de<br />
evaluación de caso base (que supone un valor de inclinación de 0.9). Se computa la aproximación de F<br />
como (1-(Biomasa reproductora por recluta [año] / Biomasa reproductora por recluta [virgen])). Los<br />
puntos de referencia límite y objetivo son los propuestos por el personal de la CIAT, y se incluyen aquí<br />
con fines ilustrativos. Las líneas de trazos representan los puntos de referencia límite propuestos. El punto<br />
de referencia límite basado en biomasa corresponde a un nivel de merma que causa una reducción de 50%<br />
del reclutamiento relativo a su nivel medio sin explotación basado en un valor cauteloso de la inclinación<br />
(h = 0.75). El punto de referencia límite basado en mortalidad por pesca corresponde a la mortalidad por<br />
pesca que impulsará a la población al punto de referencia límite basado en biomasa. Los cuadrados<br />
alrededor de la estimación más reciente representan su intervalo de confianza de 95% aproximado. El<br />
triángulo es la primera estimación (1966).<br />
101
102<br />
F. ATÚN ALBACORA<br />
Existen dos poblaciones de atún albacora en el Océano Pacífico, una en el hemisferio norte y la otra en el<br />
hemisferio sur. La especie es capturada con palangre en la mayor parte del Pacífico Norte y Sur, pero rara<br />
vez entre aproximadamente 10°N y 5°S, con curricán en el Pacífico Norte y Sur oriental y central, y con<br />
caña en el Pacífico Norte occidental. En el Pacífico Norte un 55% del pescado es capturado con caña y<br />
curricán, que capturan albacora más joven de menor tamaño, mientras que en el Pacífico Sur un 95% de la<br />
captura de albacora es tomada con palangre. Las capturas totales anuales de albacora del Pacífico Norte<br />
alcanzaron su nivel máximo de más de 125.000 t anuales en 1976, disminuyeron a unas 38.000 t en 1991,<br />
y luego aumentaron a unas 122.000 t en 1999 (Figura F-1a). Después de una segunda disminución a<br />
principios de los años 2000, las capturas se han recuperado ligeramente, hasta fluctuar entre unas 69,000<br />
y 95,000 t en los últimos años (2006-2013). Durante 2010-2014 la captura anual media fue unas 84,000 t.<br />
Las capturas anuales totales de albacora del Pacífico Sur oscilaron entre unas 25,000 y 50,000 t durante<br />
los años 1980 y 1990, pero aumentaron posteriormente, oscilando entre unas 59,000 y 88,000 t durante<br />
2002-2012 (Figura F-1b). Durante 2010-2014 la captura anual media fue unas 82,000 t.<br />
El atún albacora juvenil y adulto es capturado principalmente en la Corriente de Kuroshio, la Zona de<br />
Transición del Pacífico Norte, y la Corriente de California en el Pacífico norte y en la Zona de<br />
Convergencia Subtropical en el Pacífico sur, pero el desove ocurre en aguas tropicales y subtropicales, y<br />
se centra en los paralelos de 20ºN y 20ºS. Se cree que el albacora del Pacífico Norte desova entro marzo y<br />
julio en el Pacífico occidental y central.<br />
Los desplazamientos del albacora del Pacífico Norte son fuertemente afectados por las condiciones<br />
oceánicas, y los migrantes suelen estar concentrados en frentes oceánicos en la Zona de Transición del<br />
Pacífico Norte. La mayoría de las capturas tienen lugar en aguas de entre aproximadamente 15º y 19.5ºC.<br />
No quedan claros los detalles de la migración, pero se cree que peces juveniles (de entre 2 y 5 años de<br />
edad) se trasladan al Océano Pacífico oriental (OPO) en la primavera y a principios del verano, y vuelven<br />
al Pacífico occidental y central, tal vez anualmente, a fines de otoño y en el invierno, donde suelen<br />
permanecer cuando maduran. Este patrón podría ser complicado por desplazamientos por sexo de peces<br />
adultos grandes (talla furcal (TF) >125 cm), que son predominantemente machos, a zonas al sur de 20°N.<br />
La importancia de estos desplazamientos para la dinámica demográfica de esta población es incierta.<br />
Se sabe menos acerca de los desplazamientos de albacora en el Pacífico sur. Los juveniles se desplazan de<br />
los trópicos hacia el sur cuando miden unos 35 cm, y luego hacia el este por la Zona de Convergencia<br />
Subtropical hasta aproximadamente 130°O. Poco antes de alcanzar la madurez vuelven a aguas tropicales,<br />
donde desovan. Marcas fijadas en peces liberados al este de 155°O fueron recuperadas generalmente en<br />
lugares al este y norte del punto de liberación, mientras que aquéllas fijadas al oeste de 155°O fueron<br />
recuperadas generalmente en lugares al oeste y norte del punto de liberación.<br />
En 2012 y 2014 fueron presentadas las evaluaciones más recientes por edad de las poblaciones de<br />
albacora del Pacífico Sur y Norte, respectivamente.<br />
La evaluación del albacora del Pacífico Sur, realizada en 2012 con MULTIFAN-CL por científicos de la<br />
Secretaría de la Comunidad del Pacífico, incorporó datos de captura y esfuerzo, datos de frecuencia de<br />
talla, datos de marcado, e información sobre parámetros biológicos. Aunque existieron fuentes de<br />
incertidumbre estructural, en particular el crecimiento, se concluyó que la población estaba por encima<br />
del nivel correspondiente al rendimiento máximo sostenible (RMS). Específicamente, se estimó la<br />
abundancia actual relativa a los puntos de referencia basados en biomasa B actual /B RMS y SB actual /SB RMS<br />
estaban por encima de 1.0, y por lo tanto la población no se encontraba sobrepescada. Además, se<br />
concluyó que el riesgo que ocurriera sobrepesca era bajo (estimación mediana de 0.21 de la mortalidad<br />
por pesca actual relativa al punto de referencia de mortalidad por pesca F actual /F RMS ). No pareció existir<br />
ninguna necesidad de limitar la pesca de albacora en el Pacífico Sur, pero se recomendaron<br />
investigaciones adicionales para procurar resolver las incertidumbres en los datos. Científicos de la<br />
Secretaría de la Comunidad del Pacífico están realizando una nueva evaluación de la población del
103<br />
albacora del Pacífico sur, y será presentada al Comité Científico de la Comisión de Pesca del Pacífico<br />
Central y Occidental (WCPFC) en agosto de 2015.<br />
Se realizó una evaluación del albacora del Pacífico Norte, usando datos de la pesca de hasta 2012, en una<br />
reunión del Grupo de Trabajo sobre Albacora del Comité Científico Internacional sobre los Atunes y<br />
Especies Afines en el Océano Pacífico Norte (ISC), celebrada en abril de 2014. Se evaluó la población de<br />
albacora del Pacífico norte usando un modelo Stock Synthesis (SS Versión 3.24f), con estructura por edad<br />
y sexo, ajustado a series de tiempo de CPUE estandarizada y datos de composición por talla<br />
correspondientes a 1966-2012. El modelo de caso base fue ajustado a los índices japoneses de caña (PL) y<br />
palangre (LL), que fueron considerados por el grupo de trabajo sobre albacora los índices más<br />
representativos de las tendencias de la abundancia juvenil y adulta, respectivamente. Se usaron todos los<br />
datos de pesca disponibles del Océano Pacífico al norte de la línea ecuatorial para la evaluación de la<br />
población, que supuso una sola población bien mezclada. Se usaron curvas de crecimiento por sexo<br />
porque existen indicaciones de crecimiento sexualmente dismórfico, con los machos adultos alcanzando<br />
tamaños y edades mayores que las hembras. El valor supuesto del parámetro de inclinación (h) en la<br />
relación población-reclutamiento de Beverton-Holt fue 0.9, basado en dos estimaciones externas<br />
separadas de este parámetro. El modelo de evaluación fue ajustado los índices de abundancia y datos de<br />
composición por talla en un marco estadístico basado en verosimilitud. Se usaron estimaciones de<br />
verosimilitud máxima de los parámetros del modelo, los resultados derivados, y sus varianzas para<br />
caracterizar la condición de la población. Se realizaron varios análisis de sensibilidad para evaluar<br />
cambios en el desempeño del modelo o la amplitud de la incertidumbre que resulta de cambios en los<br />
parámetros del modelo, incluyendo algunas de las series de datos usadas en los análisis, parámetros de la<br />
curva de crecimiento, mortalidad natural, inclinación población-reclutamiento, año de inicio, estimación<br />
de la selectividad, y la ponderación de los datos de composición por talla. Las conclusiones alcanzadas en<br />
dicha reunión fueron presentadas a la undécima reunión plenaria del ISC en agosto de 2014. Entre las<br />
mismas figuraban las siguientes:<br />
1. El modelo de caso base estima que es probable que la biomasa de la población reproductora (SSB)<br />
haya fluctuado entre 98.000 y 204.000 t entre 1966 y 2012 (Figura F-2), y que el reclutamiento medio<br />
anual fue de unos 43 millones de peces durante este periodo. Ocurren periodos de reclutamiento<br />
superior e inferior al promedio al principio del periodo de la evaluación, seguidos por fluctuaciones<br />
alrededor del promedio desde los años 1990. Se estimó que la SSB hembra fue aproximadamente<br />
110,101 t en el último año de la evaluación (2012) y se estima que la reducción de la población es<br />
35.8% de la SSB sin pesca.<br />
2. La estimación del número de reproductores por recluta (RPR) relativo a la población sin pesca en el<br />
último año de la evaluación es 0.41, lo cual corresponde a un nivel de explotación relativamente bajo<br />
(o sea, 1-RPR = 0.59). Mientras que la estimación del modelo de caso base de la F por edad actual de<br />
peces juveniles es más baja que en 2002-2004, y la F actual de peces adultos (50% de peces de edad<br />
5, y todos los peces de edad 6 o más) es mayor en promedio que durante 2002 -2004.<br />
3. La gráfica de Kobe ilustra la condición de la población relativa a los puntos de referencia basados en<br />
RMS y aproximaciones de RMS del modelo de caso base (Figura F-3). Se presenta esta gráfica para<br />
fines ilustrativos ya que la CIAT no ha establecido puntos de referencia biológicos para la población<br />
de albacora del Pacífico norte. El grupo de trabajo sobre el albacora concluyó que la población<br />
probablemente no se encuentra sobrepescada en la actualidad, ya que la evaluación presenta pocas<br />
pruebas que la pesca haya reducido la SSB por debajo de puntos de referencia razonables basados en<br />
biomasa.<br />
4. En el modelo de caso base, la estimación puntual (± DE) del rendimiento máximo sostenible (RMS)<br />
es 105,571 ± 14,759 t, y la estimación puntual de la biomasa reproductora necesaria para producir el<br />
RMS (SSB MSY , biomasa adulta hembra) es 49,680 ± 6,739 t. Se estima que la razón de F 2010-2012 /F RMS<br />
es 0.52, y la de F 2002-2004 /F RMS (años de referencia para las medidas de conservación y ordenación de
104<br />
albacora del Pacífico norte adoptadas por la CIAT) es 0.76.<br />
5. Se realizaron proyecciones estocásticas de la población externas al modelo de caso base para evaluar<br />
el impacto de varios niveles de intensidad de pesca sobre la SSB hembra futura para el albacora del<br />
Pacífico norte. Se basó el reclutamiento futuro en un remuestreo aleatorio del reclutamiento histórico<br />
en tres periodos: (1) reclutamiento bajo (unos 29 millones), 1983-1989, (2) reclutamiento medio<br />
(unos 43 millones), 1966-2010, y (3) reclutamiento alto (unos 55 millones), 1966-1975. Estos<br />
cálculos incorporan la estructura del modelo de evaluación (por ejemplo, multi-flota, multitemporada,<br />
selectividad por tamaño y edad) para producir resultados consistentes con el modelo de<br />
evaluación. Las proyecciones comienzan en 2011 y continúan hasta 2041 con dos niveles de<br />
mortalidad por pesca (F 2010-2012 constante, F 2002-2004 constante) y captura constante promediada para<br />
2010-2012, y tres niveles de reclutamiento (bajo, medio, y alto, arriba definidos). Estas proyecciones<br />
indican que el desempeño de la población es mejor con el escenario de F 2010-2012 constante que con el<br />
escenario de F 2002-2004 constante. Suponiendo un reclutamiento histórico medio y pesca en una F<br />
actual constante, se espera que la SSB hembra mediana siga relativamente estable entre los<br />
percentiles 25 y mediano tanto a corto como a largo plazo. Por contraste, si se supone un escenario de<br />
reclutamiento bajo, entonces la SSB hembra mediana disminuye en ambos escenarios de captura. El<br />
escenario de reclutamiento alto es más optimista, con la SSB mediana aumentando a por encima de la<br />
SSB mediana histórica.<br />
6. El grupo de trabajo concluyó que la población del albacora del Pacífico norte no está siendo<br />
sobrepescada y probablemente tampoco se encuentra sobrepescada. Se estima que el nivel actual de<br />
explotación (F 2010-2012 ) es inferior a aquel de F 2002-2004 , que condujo previamente a la implementación<br />
de medidas de conservación y ordenación para la población de albacora del Pacífico norte en el OPO<br />
(Resolución C-05-02, suplementada por la Resolución C-13-03) y el Pacífico central y occidental<br />
(WCPFC CMM 2005-03). El grupo de trabajo señaló que no existen pruebas de que la pesca haya<br />
reducido la SSB por debajo de los umbrales asociados a la mayoría de los puntos de referencia<br />
basados en biomasa que podrían ser seleccionados y que la dinámica de la población de albacora del<br />
Pacífico norte es impulsada principalmente por el reclutamiento, que es afectado tanto por cambios<br />
ambientales como por la relación población-reclutamiento. El grupo de trabajo concluyó que la<br />
población de albacora del Pacífico norte está en buenas condiciones y que la productividad actual es<br />
suficiente para sostener los niveles recientes de explotación, suponiendo un reclutamiento medio<br />
histórico tanto a corto como a largo plazo.<br />
7. El grupo de trabajo señaló que la falta de datos de tamaño por sexo, la ausencia de estimaciones<br />
actualizadas de parámetros importantes del ciclo vital (mortalidadnatural, madurez), y el tratamiento<br />
simplificado de la estructura espacial de la dinámica poblacional del albacora del Pacífico norte se<br />
fuentes importantes de incertidumbre en la evaluación.<br />
En 2013 la CIAT aprobó la resolución C-13-03, que suplió la resolución C-05-02 sobre el albacora del<br />
norte. Requiere que todos los CPC informen, antes del 1 de diciembre de 2013, de sus capturas, por arte y<br />
esfuerzo dirigido al albacora del norte en el Área de la Convención durante 2007-2012, así como el<br />
esfuerzo medio de 2002-2004. El esfuerzo (en días de buque) durante 2007-2012 fue solamente 2%<br />
mayor que el nivel de 2002-2004. El número medio de buques que operaron durante 2007-2012 fue un<br />
7% menor que durante 2002-2004.<br />
El grupo de trabajo está desarrollando un plan de trabajo para implementar una evaluación de estrategia<br />
de ordenación para la población de albacora del Pacífico norte.
105<br />
G. SWORDFISH<br />
Swordfish (Xiphias gladius) occur throughout the Pacific Ocean between about 50°N and 50°S. They are<br />
caught mostly by the longline fisheries of Far East and Western Hemisphere nations. Lesser amounts are<br />
taken by gillnet and harpoon fisheries. They are seldom caught by recreational fishermen.<br />
Swordfish grow in length very rapidly, with both males and the faster-growing females reaching lowerjaw-fork<br />
lengths of more than a meter during their first year. Swordfish begin reaching maturity at about<br />
two years of age, when they are about 150 to 170 cm in length, and by age four all are mature. They<br />
probably spawn more than once per season. For fish greater than 170 cm in length, the proportion of<br />
females increases with increasing length.<br />
Swordfish tend to inhabit waters further below the surface during the day than at night, and they tend to<br />
inhabit frontal zones. Several of these occur in the eastern Pacific Ocean (EPO), including areas off<br />
California and Baja California, off Ecuador, Peru, and Chile, and in the equatorial Pacific. Swordfish<br />
tolerate temperatures of about 5° to 27°C, but their optimum range is about 18° to 22°C, and larvae have<br />
been found only at temperatures exceeding 24°C.<br />
The stock structure of swordfish in the Pacific is fairly well known. A number of specific regions of<br />
spawning are known, and analyses of fisheries and genetic data indicate that there is only limited<br />
exchange of swordfish between geographical areas, including between the eastern and western, and the<br />
northern and southern, Pacific Ocean.<br />
The best available scientific information from genetic and fishery data indicate that the swordfish of the<br />
northeastern Pacific Ocean (NEPO) and the southeastern Pacific Ocean (SEPO: south of about 5°S) constitute<br />
two distinct stocks. Also, there may be occasional movement of a northwestern Pacific stock of swordfish into<br />
the EPO at various times. Though assessments of eastern Pacific stocks did not include parameters for<br />
movements among these or other stocks, there may be limited exchange of fish among them.<br />
The results of an assessment of a North Pacific swordfish stock in the area north of 10°N and west of<br />
140°W indicate that the biomass level has been stable and well above 50% of the unexploited levels of<br />
stock biomass, indicating that these swordfish are not overexploited at current levels of fishing effort. A<br />
more recent analysis for the Pacific Ocean north of the equator, using a sex-specific age-structured<br />
assessment method, indicated that, at the current level of fishing effort, there is negligible risk of the<br />
spawning biomass decreasing to less than 40% of its unfished level.<br />
The standardized catches per unit of effort of the longline fisheries in the northern region of the EPO and<br />
trends in relative abundance obtained from them do not indicate declining abundances. Attempts to fit<br />
production models to the data failed to produce estimates of management parameters, such as maximum<br />
sustainable yield (MSY), under reasonable assumptions of natural mortality rates, due to lack of contrast<br />
in the trends. This lack of contrast suggests that the fisheries in this region have not been of magnitudes<br />
sufficient to cause significant responses in the populations. Based on these considerations, and the long<br />
period of relatively stable catches (Figure G-1), it appears that swordfish are not overfished in the<br />
northern EPO.<br />
The most recent assessment of the stock of swordfish in the southwestern EPO was conducted with<br />
Stock Synthesis, using data that were updated as of 22 April 2011. Key results from that assessment<br />
were (1) that the swordfish stock in the southeast Pacific Ocean is not experiencing overfishing and<br />
is not overfished; (2) that the spawning biomass ratio is about 1.45, indicating that the spawning<br />
biomass is about 50 percent above the carrying capacity, and substantially above the level which is<br />
expected to produce catch at the MSY level; (3) that the recent catch levels (Figure G-2) were at<br />
levels at about MSY (~25,000 t); and (4) that there has been a recent series of high recruitments to<br />
the swordfish stock. There is no indication of a significant impact of fishing on this stock. The results<br />
of the assessment did suggest an expansion of the fishery onto components of the stock that were<br />
previously not, or were only lightly, exploited.
106<br />
In the northern EPO the annual longline fishing effort, though recently increasing from about 23.7 million<br />
hooks in 2007 to about 43.9 million in 2011, remains significantly below the 2001-2003 average of 70.4<br />
million hooks. Since about 2006 the catch of swordfish has remained directly proportional to longline<br />
fishing effort. Considering the continuing relatively low fishing effort and the direct response of catch to<br />
effort, at the current level of fishing effort there is negligible risk of the spawning biomass decreasing to<br />
less than 40% of its unfished level.<br />
In the southern EPO catches have been steadily increasing since about 2005, and recent annual catches<br />
are nearing the estimated MSY.<br />
FIGURE G-1. Retained catches of swordfish in the northeastern Pacific Ocean.<br />
FIGURA G-1. Capturas retenidas de pez espada en el Océano Pacífico noreste.<br />
FIGURE G-2. Retained catches of swordfish in the southeastern Pacific Ocean<br />
FIGURA G-2. Capturas retenidas de pez espada en el Océano Pacífico sudeste.
107<br />
G. PEZ ESPADA<br />
El pez espada (Xiphias gladius) habita todo el Océano Pacífico entre aproximadamente 50°N y 50°S. Es<br />
capturado principalmente por las pesquerías palangreras de países de Lejano Oriente y del hemisferio<br />
occidental. Las pesquerías de red de transmalle y arpón capturan cantidades menores. Es rara vez<br />
capturado en la pesca recreacional.<br />
El pez espada crece en talla muy rápidamente, y tanto los machos como las hembras, que crecen más<br />
rápidamente, alcanzan tallas de mandíbula inferior a furca caudal de más de un metro durante su primer<br />
año. Comienza a alcanzar la madurez alrededor de los dos años de edad, cuando mide unos 150 a 170 cm<br />
de talla, y se considera que a los cuatro años de edad todos son maduros. Es probable que desove más de<br />
una vez por temporada. En el caso de peces de más de 170 cm, la proporción de hembras aumenta con el<br />
aumento en la talla.<br />
El pez espada suele permanecer a mayor profundidad de día que de noche, y vivir en zonas frontales, de<br />
las que hay varias en el Océano Pacífico oriental (OPO), entre ellas zonas frente a California y Baja<br />
California, frente a Ecuador, Perú, y Chile, y en el Pacífico ecuatorial. Tolera temperaturas de entre unos<br />
5° y 27°C, pero su gama óptima es de 18° a 22°C, y se han encontrado larvas únicamente a temperaturas<br />
de más de 24°C.<br />
Se conoce bastaste bien la estructura de la población del pez espada en el Pacífico. Se sabe de varias<br />
regiones específicas de desove, y los análisis de los datos de pesca y genéticos indican que ocurre un<br />
intercambio de peces espada tan sólo limitado entre zonas geográficas, inclusive entre el Océano Pacífico<br />
oriental y occidental, y norte y sur.<br />
La mejor información científica disponible, basada en datos genéticos y de la pesca, indica que el pez<br />
espada del Océano Pacífico noreste y el Océano Pacífico sudeste (al sur de 5°S) y constituyen dos<br />
poblaciones separadas. Además, es posible que una población del Pacífico noroeste se desplace<br />
ocasionalmente al OPO en varias ocasiones. Aunque las evaluaciones de las poblaciones del Pacífico<br />
oriental no incluyeron parámetros de desplazamientos entre éstas u otras poblaciones, podría ocurrir un<br />
intercambio limitado de peces entre las mismas.<br />
Los resultados de una evaluación de una población de pez espada del Pacífico Norte en el área al norte de<br />
10°N y al oeste de 140°O indican que el nivel de biomasa ha sido estable y ha estado por encima del 50%<br />
del nivel de la biomasa no explotada, lo cual indica que con los niveles actuales de esfuerzo de pesca, la<br />
explotación de estos peces espada no es excesiva. Un análisis más reciente para el Océano Pacífico al<br />
norte de la línea ecuatorial, usando un método de evaluación por sexo y edad, indicó que, al nivel actual<br />
de esfuerzo de pesca, existe un riesgo insignificante de que la biomasa reproductora disminuya a menos<br />
del 40% de su nivel sin pesca.<br />
Las tasas de captura por unidad de esfuerzo estandarizadas de las pesquerías de palangre en la región<br />
norte del OPO, y las tendencias en la abundancia relativa derivadas de las mismas, no señalan que la<br />
abundancia esté disminuyendo. Intentos de ajuste de modelos de producción a los datos no produjeron<br />
estimaciones de parámetros de ordenación, tales como el rendimiento máximo sostenible (RMS), con<br />
supuestos razonables de las tasas de mortalidad natural, debido a la falta de contraste en las tendencias.<br />
Esta falta de contraste sugiere que las pesquerías en esta región no son de magnitud suficiente como para<br />
causar reacciones significativas en las poblaciones. A partir de estas consideraciones, y del período de<br />
capturas relativamente estables (Figura G-1), parece que el pez espada no se encuentra sobrepescado en el<br />
OPO norte.<br />
Se realizó la evaluación más reciente de la población de pez espada en el OPO sudoeste con Stock<br />
Synthesis, usando datos actualizados al 22 de abril de 2011. Los resultados clave de esa evaluación son<br />
que (1) la población del pez espada en el Océano Pacífico sudeste no está padeciendo sobrepesca y no<br />
se encuentra sobrepescada; (2) el cociente de biomasa reproductora es aproximadamente 1,45, lo cual<br />
indica que la biomasa reproductora está aproximadamente un 50% por encima de la capacidad de<br />
carga, y sustancialmente por encima del nivel que se espera produciría una captura al nivel de RMS;<br />
(3) los niveles recientes de captura (Figura G-2) estaban en niveles cercanos al RMS estimado
108<br />
(~25,000 t); y (4) ha ocurrido una serie reciente de reclutamientos altos a la población. No existe<br />
ninguna indicación de un impacto significativo de la pesca sobre esta población. Los resultados de la<br />
evaluación no sugieren una expansión de la pesquería a componentes de la población que<br />
previamente no se explotaban, o se explotaban tan sólo ligeramente.<br />
En el norte del OPO el esfuerzo de pesca palangrero anual, pese a un incremento reciente de unos<br />
23,7 millones de anzuelos en 2007 a unos 43,9 millones en 2011, continúa significativamente inferior<br />
al promedio de 2001-2003 de 70,4 millones de anzuelos. Desde aproximadamente 2006 la captura de<br />
pez espada ha sido directamente proporcional al esfuerzo de pesca palangrero. Considerando el<br />
esfuerzo de pesca relativamente bajo y la reacción directa de la captura al esfuerzo, con el nivel<br />
actual de esfuerzo de pesca existe un riesgo insignificante que la biomasa reproductora disminuya a<br />
menos del 40% de su nivel sin pesca.<br />
En el sur del OPO las capturas vienen aumentando constantemente desde aproximadamente 2005, y las<br />
capturas anuales recientes están cerca del RMS estimado.
109<br />
H. BLUE MARLIN<br />
The best information currently available indicates that blue marlin constitutes a single world-wide species<br />
and that there is a single stock of blue marlin in the Pacific Ocean. For this reason, statistics on catches<br />
(Figure H-1) are compiled, and analyses of stock status are made, for the entire Pacific Ocean.<br />
Blue marlin are taken mostly in longline fisheries for tunas and billfishes between about 30°N and 30°S.<br />
Lesser amounts are taken by recreational fisheries and by various other commercial fisheries.<br />
Small numbers of blue marlin have been tagged with conventional dart tags, mostly by recreational<br />
fishermen. A few of these fish have been recaptured long distances from the locations of release. Blue<br />
marlin have been tagged with electronic pop-off satellite tags (PSATs) which collected data over periods<br />
of about 30-180 days, mostly in the Gulf of Mexico and the Atlantic Ocean, in studies of post-release<br />
survival and movement. More recently such studies have been undertaken in the Pacific Ocean.<br />
Blue marlin usually inhabit regions where the sea-surface temperatures (SSTs) are greater than 24°C, and<br />
they spend about 90% of their time at depths at which the temperatures are within 1° to 2° of the SSTs.<br />
The most recent assessment of the status and trends of the species was conducted in 2013, and included<br />
data through 2011. It indicated that blue marlin in the Pacific Ocean were fully exploited, i.e. that the<br />
population was being harvested at levels producing catches near the top of the yield curve.<br />
FIGURE H-1. Retained catches of blue marlin in Pacific Ocean by region.<br />
FIGURA H-1. Capturas retenidas de marlín azul en el Océano Pacífico, por región.
110<br />
H. MARLÍN AZUL<br />
La mejor información ahora disponible indica que el marlín azul constituye una sola especie a nivel<br />
mundial, y que existe una sola población de la especie en el Océano Pacífico. Por este motivo, se<br />
compilan estadísticas de capturas (Figura H-1), y se realizan análisis de la condición de la población, para<br />
el Océano Pacífico entero.<br />
El marlín azul es capturado principalmente por las pesquerías de palangre de atunes y peces picudos entre<br />
aproximadamente 30°N y 30°S. Las pesquerías recreacionales y varias otras pesquerías comerciales<br />
capturan cantidades menores.<br />
Pequeñas cantidades de marlines azules han sido marcadas con marcas convencionales, principalmente<br />
por pescadores recreacionales. Algunos de estos peces han sido recapturados a grandes distancias del<br />
punto de liberación. Marlines azules han sido marcados con marcas electrónicas satelitales<br />
autodesprendibles que toman datos durante períodos de unos 30 a 180 días, principalmente en el Golfo de<br />
México y el Océano Atlántico, en estudios de la supervivencia y desplazamientos después de la<br />
liberación. Más recientemente se han emprendido estudios de este tipo en el Océano Pacífico.<br />
El marlín azul vive generalmente en regiones con temperaturas superficiales del mar (TSM) de más de<br />
24°C, y pasa un 90% del tiempo a profundidades donde la temperatura es de 1° a 2° menos que la TSM.<br />
La evaluación más reciente de la condición y las tendencias fue realizada en 2013 e incluyó datos hasta 2011.<br />
En 2003 se realizó un segundo análisis, usando los mismos datos pero un modelo de evaluación alternativo.<br />
Indicó que el marlín azul en el Océano Pacífico está plenamente explotado, es decir, se está explotando la<br />
población en niveles que producen capturas cerca del ápice de la curva de rendimiento.
111<br />
I. STRIPED MARLIN<br />
Striped marlin (Kajikia audax) occur throughout the Pacific Ocean between about 45°N and 45°S. The<br />
assessment on which this report is based is for the stock of striped marlin in the eastern Pacific Ocean<br />
(EPO) region lying north of 10°S, east of about 145°W north of the equator, and east of about 165°W<br />
south of the equator. Although not included in the assessment model, there may be limited exchange of<br />
fish between this stock and stocks in adjacent regions.<br />
Significant effort has been devoted to understanding the stock structure of striped marlin in the Pacific<br />
Ocean, which is now moderately well known. It has been clear for some years that there are a number of<br />
stocks. Information on the movements of striped marlin is limited. Fish tagged with conventional dart tags<br />
and released off the tip of the Baja California peninsula have generally been recaptured near where they<br />
were tagged, but some have been recaptured around the Revillagigedo Islands, a few around Hawaii, and<br />
one near Norfolk Island. Tagging studies of striped marlin in the Pacific conducted using pop-off satellite<br />
tags indicated that there is essentially no mixing of tagged fish among tagging areas and that striped<br />
marlin maintain site fidelity. Recent results of analyses of fisheries and genetic data indicate that the<br />
northern EPO is home to a single stock, though there may be a seasonal low-level presence of juveniles<br />
from a more westerly Hawaii/Japan stock.<br />
Historically, the majority of the catch in the EPO was taken by longline fisheries; however, removals by<br />
recreational fisheries have become more important in recent years (Figure I-1). Longline fisheries expanded into<br />
the EPO beginning in the mid-1950s, and they extended throughout the region by the late 1960s. Except for a few<br />
years in the late 1960s to early 1970s in the northern EPO, these fisheries did not target billfish.<br />
Fishing by smaller longline vessels targeting tuna and other species off Central America, for which catch data<br />
are not available, appears to have increased recently. The shifting patterns of areas fished and targeting<br />
practices increase the difficulties encountered when using fisheries data in analyses of stock status and trends.<br />
These difficulties are exacerbated when analyzing species which are not principal targets of the fishery, and<br />
further exacerbated when the total catch of the species by all fisheries is not known.<br />
The assessment of this stock was conducted using Stock Synthesis, with data updated as of 30 October<br />
2010. Key results of the assessment were that (1) the stock is not overfished; (2) overfishing is not<br />
occurring; (3) the spawning stock biomass has been increasing and is above that expected to support MSY<br />
catch; and (4) catches in recent years have remained at about half the MSY catch level. If fishing effort<br />
and harvests had continued at levels near 2010 levels, it was expected that the biomass of the stock would<br />
continue to increase over the near term.<br />
The fishing effort by large longline vessels in the northern EPO has increased by about 20%, and the<br />
catch of striped marlin by longlines by about 70%, since 2010. This differential may be due to increasing<br />
striped marlin biomass or such as spatial/temporal shifts in fisheries resulting in increased availability of<br />
striped marlin to the longline fishery.<br />
The most recent report of catch by the recreational fishery was for 1990-2007 and included preliminary<br />
data for 2008. It is estimated that this fishery makes the majority of the catch of striped marlin in the<br />
northern EPO. Based on recent analyses of other billfish species, it appears that catches of billfish,<br />
including striped marlin, by components of the smaller-vessel longline fishery operating off Central<br />
America have not been reported. Therefore the total catch of striped marlin in the EPO, and thus the total<br />
impact of fishing on the stock since about 2008-2009, is not known.<br />
Since catches of striped marlin and fishing effort have increased in the large-vessel longline fishery, and<br />
because there is uncertainty in the estimated total catch of striped marlin in the EPO since at least 2008,<br />
the trends in spawning and total biomass of striped marlin in the EPO are unknown. Efforts have and are<br />
being made to obtain reliable catch data from all fisheries. Until the data are available and updated, and a<br />
review of the status of striped marlin in the EPO is completed, it is recommended that a precautionary<br />
approach be adopted, and that fishing effort directed at striped marlin in the EPO not be increased.
112<br />
FIGURE I-1. Landings of striped marlin from the northern EPO by longline and recreational fisheries,<br />
1954-2012. Due to unreported catches by recreational fisheries, estimates for 2009-2014 are minimums.<br />
FIGURA I-1. Descargas de marlín rayado del OPO norte por las pesquerías palangreras y recreativas,<br />
1954-2012. Debido a capturas no reportadas por pesquerías recreativas, las estimaciones de 2009-2014<br />
son mínimos.
113<br />
I. MARLÍN RAYADO<br />
El marlín rayado (Kajikia audax) está distribuido por todo el Océano Pacífico entre aproximadamente<br />
45°N y 45°S. El presente informe se basa en una evaluación de la población de marlín rayado en la región<br />
del Océano Pacífico oriental (OPO) al norte de 10°S, al este de aproximadamente 145°O al norte de la<br />
línea ecuatorial y al este de aproximadamente 165°O al sur de la misma. Aunque no se incluye en el<br />
modelo de evaluación, es posible que ocurra un intercambio limitado de peces entre esta población y las<br />
poblaciones en regiones adyacentes.<br />
Se ha dedicado un esfuerzo importante a entender la estructura de la población de marlín rayado en el<br />
Océano Pacífico, que ahora es moderadamente bien conocida. Queda claro desde hace varios años que<br />
existe varias poblaciones. La información sobre los desplazamientos del marlín rayado es limitada. Peces<br />
marcados con marcas de dardo convencionales y liberados frente a la punta de la península de Baja<br />
California han sido generalmente recapturados cerca de donde fueron marcados, pero algunos han sido<br />
recapturados cerca de las islas Revillagigedo, unos pocos cerca de Hawai, y uno cerca de la isla Norfolk.<br />
Estudios de marcado de marlín rayado en el Pacífico con marcas satelitales desprendibles indicaron que<br />
esencialmente no ocurre mezcla de peces marcados entre zonas de marcado, y que el marlín rayado<br />
mantiene fidelidad a su sitio. Los resultados recientes de análisis de datos de pesca y genéticos indican<br />
que en el OPO norte vive una sola población, aunque es posible que haya una presencia estacional a bajo<br />
nivel de juveniles de una población más al oeste de Hawai/Japón.<br />
Históricamente, la mayor parte de la captura en el OPO fue capturada por las pesquerías de palangre, pero<br />
las capturas de la pesca recreacional se han vuelto más importantes en años recientes (Figura I-1). Las<br />
pesquerías de palangre comenzaron a ingresar al OPO a mediados de los años 1950, y para fines de los<br />
años 1960 se extendían por toda la región. Con la excepción de unos años a fines de los 1960 y principios<br />
de los 1970 en el OPO norte, estas pesquerías no se dirigieron a los peces picudos. La pesca por buques<br />
palangreros pequeños que dirigen su esfuerzo a los atunes y otras especies en aguas frente a<br />
Centroamérica, de los que no se cuenta con datos de captura, parece haber aumentado recientemente. Los<br />
patrones variables de zonas de pesca y objetivos de la pesca incrementan las dificultades encontradas al<br />
usar datos de pesca in los análisis de la condición y tendencias de la población. Estas dificultades son<br />
exacerbadas al analizar especies que no son el blanco principal de la pesquería, and exacerbadas aún más<br />
si se ignora la captura total de todas las pesquerías.<br />
Se realizó la evaluación de esta población con el modelo Stock Synthesis, con datos actualizados al 30 de<br />
octubre de 2010. Los resultados clave de la evaluación son que (1) la población no se encuentra<br />
sobrepescada; (2) no está ocurriendo sobrepesca; (3) la biomasa de la población reproductora viene en<br />
aumento y se encuentra por encima del nivel que se espera produciría la captura en RMS; y (4) la captura<br />
en los últimos años ha permanecido alrededor de la mitad de la captura en el nivel de RMS. Si el esfuerzo<br />
de pesca y las capturas hubieran seguido en niveles cercanos a aquéllos de 2010, se esperaba que la<br />
biomasa de la población siguiera aumentando en el futuro cercano.<br />
El esfuerzo de pesca de los buques palangreros grandes al norte del OPO ha aumentado un 20%, y la<br />
captura palangrera un 70%, desde 2010. Esta diferencia podría deberse a un incremento de la biomasa de<br />
marlín rayado, a cambios espaciales o temporales en las pesquerías, conduciendo a una mayor<br />
disponibilidad del marlín rayado a la pesquería palangrera.<br />
El informe más reciente de la captura de la pesquería recreacional correspondió a 1990-2007 e incluyó<br />
datos preliminares de 2008. Se estima que esta pesquería realizó la mayoría de la captura de marlín<br />
rayado en el norte del OPO. A partir de análisis recientes de otras especies de peces picudos, parece que<br />
las capturas de peces picudos, incluido el marlín rayado, por componentes de la pesquería palangrera de<br />
buques pequeños que operan frente a Centroamérica no han sido notificadas. Por lo tanto se ignora la<br />
captura total de marlín rayado en el OPO, y por ende el impacto total de la pesca sobre la población de<br />
este aproximadamente 2008-2009.
114<br />
Ya que las capturas de marlín rayado y el esfuerzo de pesca han aumentado en la pesquería palangrera de<br />
buques grandes, y en vista de la incertidumbre en la estimación de la captura total de marlín rayado en el<br />
OPO desde al menos 2008, se ignoran las tendencias de las biomasas reproductora y total. Continúan los<br />
esfuerzos para obtener datos de capturas fiables de todas las pesquerías. Hasta que los datos estén<br />
disponibles y actualizados, y se lleve a cabo una revisión de la condición del marlín rayado en el OPO, se<br />
recomienda adoptar un enfoque precautorio y no permitir un incremento del esfuerzo de pesca dirigido al<br />
marlín rayado en el OPO.
115<br />
J. SAILFISH<br />
The stock structure of sailfish (Istiophorus platypterus) in the Pacific Ocean is well known. They are<br />
found in highest abundance in waters relatively near the continents and the Indo-Pacific land masses<br />
bordering the Pacific, and only infrequently in the high seas separating them. This separation by its very<br />
nature suggests that the regions of abundance in the EPO and in the western Pacific should be managed<br />
separately, and in this case, the separation has over time resulted in genetically distinct populations in the<br />
east and the west.<br />
The centers of sailfish distribution along the coast of the Americas shift in response to seasonal changes<br />
in surface and mixed-layer water temperature. Sailfish are found most often in waters warmer than about<br />
28°C, and are present in tropical waters nearer the equator in all months of the year. Spawning takes place<br />
off the coast of Mexico during the summer and fall, and off Costa Rica during winter, and perhaps yearround<br />
in areas with suitable conditions. The sex ratio is highly skewed towards males during spawning.<br />
The known shifts in sex ratios among spawning areas, and the spatial-temporal distributions of gonad<br />
indices and size-frequency distributions, which show smaller fish offshore, suggest that there may be<br />
maturity-dependent patterns in the distribution of the species in the EPO. Sailfish can reach an age of<br />
about 11 years in the EPO.<br />
The principal fisheries that capture sailfish in the EPO include the large-vessel, tuna-targeting longline<br />
fisheries of Chinese Taipei, Costa Rica, Japan, and Korea; the smaller-vessel longline fisheries targeting<br />
tuna and other species, particularly those operating in waters off Central America; and the artisanal and<br />
recreational fisheries of Central and South America. Sailfish are also taken occasionally in the purse-seine<br />
fisheries targeting tropical tunas.<br />
The first assessment of sailfish in the EPO was conducted in 2013. Initial analyses indicated that either this<br />
stock had uncharacteristically low productivity and high standing biomass, or – much more probably – that<br />
there was a large amount of catch missing in the data compiled for the assessment. We were unable to identify<br />
a means to satisfactorily estimate this catch in order to obtain reliable estimates of stock status and trends using<br />
Stock Synthesis, which is generally the preferred model for assessments. As a result, the assessment was<br />
conducted using a surplus production model, which provided results consistent with those obtained with Stock<br />
Synthesis and simplified the illustration of the issues in the assessment.<br />
Key results:<br />
1. It is not possible to determine the status of the sailfish stock in the EPO with respect to specific<br />
management parameters, such as maximum sustained yield (MSY), because the parameter estimates<br />
used in making these determinations in this case cannot be derived from the model results<br />
2. Sailfish abundance trended downward over 1994-2009, since when it has been relatively constant or<br />
slightly increasing (Figure J-1).<br />
3. Recent reported annual catches are on the order of 500 t (Figure J-2), significantly less than the 1993-<br />
2007 average of about 2,100 t.<br />
4. Model results suggest that there are significant levels of unreported catch, and the actual catch in<br />
earlier years was probably higher than those reported for 1993-2007. Assuming that this level of<br />
harvest has existed for many years, it is expected that the stock condition will not deteriorate if catch<br />
is not increased above current levels.<br />
5. A precautionary approach that does not increase fishing effort directed at sailfish, and that closely<br />
monitors catch until sufficient data are available to conduct another assessment, is recommended.
116<br />
6. A reliable assessment of the sailfish resources in the EPO cannot be obtained without reliable<br />
estimates of catch. It is therefore recommended that:<br />
a. historical data on catches of sailfish be obtained wherever possible<br />
b. fisheries currently reporting sailfish catches commingled with other species be required<br />
to report catches by species.<br />
c. existing data from small-scale fisheries, such as local longline fleets and artisanal<br />
fisheries, be compiled and that, where necessary, catch monitoring programs to identify<br />
catches by species be implemented.
117<br />
FIGURE J-1. Observed and predicted indices of relative abundance of sailfish in the EPO from Japanese<br />
longline (JPN LL) and Mexican recreational (MEX RG) fisheries. The 2010 observation in the JPN LL<br />
series was not included in the analyses.<br />
FIGURA J-1. Indices observados y predichos de abundancia relativa del pez vela en el OPO, basados en<br />
las pesquerías palangrera japonesa (JPN LL) y recreacional mexicana (MEX RG). No se incluyó en los<br />
análisis la observación de 2010 en la serie JPN LL.<br />
FIGURE J-2. Total reported catches of sailfish in the EPO, 1990-2014. The actual catches were<br />
probably greater.<br />
FIGURA J-2. Capturas totales reportadas de pez vela en el OPO, 1990-2014. (Las capturas reales son<br />
probablemente mayores).
118<br />
J. PEZ VE<strong>LA</strong><br />
La estructura de la población del pez vela (Istiophorus platypterus) en el Océano Pacífico es bien<br />
conocida. La abundancia máxima del pez vela ocurre en aguas relativamente cercanas a los continentes y<br />
las masas terrestres indopacíficas que lindan con el Océano Pacífico, y tan sólo infrecuentemente en las<br />
aguas de alta mar que los separan. Esta separación por su propia naturaleza sugiere que las regiones de<br />
abundancia en el OPO y en el Pacífico occidental deberían ser gestionadas por separado, y en este caso la<br />
separación ha resultado a lo largo del tiempo en poblaciones genéticamente distintas en el este y el oeste.<br />
Los centros de la distribución del pez vela a lo largo del litoral del continente americano cambian en<br />
reacción a cambios estacionales de la temperatura del agua en la superficie y en la capa de mezcla. Se<br />
encuentra la especie con mayor frecuencia en aguas de más de unos 28°C, y están presentes en aguas<br />
tropicales más cercanas a la línea ecuatorial en todos los meses del año. El desove tiene lugar frente al<br />
litoral mexicano durante el verano y otoño, y frente a Costa Rica durante el invierno, y tal vez durante<br />
todo el año en áreas con condiciones adecuadas. La proporción de sexos es altamente asimétrica hacia los<br />
machos durante el desove. Los cambios conocidos en la proporción de sexos entre las áreas de desove, y<br />
las distribuciones espaciotemporales de los índices de gónadas y las distribuciones de frecuencia de talla,<br />
que señalan peces más pequeños en alta mar, sugieren que podrían existir patrones dependientes de la<br />
madurez en la distribución de la especie en el OPO. El pez vela puede alcanzar una edad de unos 11 años<br />
en el OPO.<br />
Las pesquerías principales que capturan pez vela en el OPO incluyen las pesquerías palangreras atuneras<br />
de buques grandes de Taipéi Chino, Costa Rica, Japón, y Corea; las pesquerías palangreras de buques más<br />
pequeños dirigidas hacia los atunes y otras especies, particularmente aquellas que operan en las aguas<br />
costeras de Centroamérica, y las pesquerías artesanales y recreacionales de América Central y del Sur.<br />
Son también a veces capturados en las pesquerías atuneras de cerco.<br />
La primera evaluación del pez vela en el OPO fue realizada en el año en curso (2013). Los análisis<br />
iniciales indicaron que esta población cuenta con la productividad anormalmente baja y una alta biomasa<br />
constante, o – mucho más probable – que falta una gran cantidad de la captura en los datos compilados<br />
para la evaluación. No fue posible identificar una forma de estimar satisfactoriamente esta captura y así<br />
obtener una estimación confiable de la condición y tendencias de la población usando Stock Synthesis, el<br />
modelo generalmente preferido para las evaluaciones. Por consiguiente, se realizó una evaluación con un<br />
modelo de producción excesiva, el cual produjo resultados consistentes con aquellos obtenidos con Stock<br />
Synthesis y simplificó la ilustración de los problemas en la evaluación.<br />
Resultados clave:<br />
1. No es posible determinar la condición de la población del pez vela en el OPO con respecto a<br />
parámetros de ordenación específicos, tal como el rendimiento máximo sostenible (RMS), porque las<br />
estimaciones de los parámetros usados para hacer estas determinaciones no pueden ser derivadas de<br />
los resultados del modelo.<br />
2. La abundancia del pez vela mostró una tendencia descendente durante 1994-2009; desde entonces ha<br />
sido relativamente constante o ligeramente ascendente (Figura J-1).<br />
3. Las capturas anuales recientes reportadas están alrededor de 500 t (Figura J-2), significativamente<br />
menos que el promedio de 1993-2007 de 2,100 t.<br />
4. Los resultados del modelo sugieren que existen cantidades importantes de captura no reportada, y la<br />
captura en los años tempranos fue probablemente mayor que aquellas reportadas para 1993-2007.<br />
Suponiendo que este nivel de capturas existe desde hace muchos años, no es probable que la<br />
condición de la población deteriore si no se incrementa la captura más allá del nivel actual.<br />
5. Se recomienda un enfoque precautorio que no aumente el esfuerzo de pesca dirigido el pez vela, y<br />
que de un seguimiento estrecho a las capturas hasta que se disponga de suficientes datos para realizar<br />
una nueva evaluación.
6. No es posible obtener una evaluación fiable del recurso de pez vela en el OPO sin estimaciones<br />
fiables de la captura. Se recomienda por lo tanto que:<br />
a. se obtengan en todo caso posible datos históricos de captura de pez vela.<br />
b. en el caso de las pesquerías que actualmente reportan sus capturas de pez vela mezcladas con<br />
otras especies, notifiquen sus capturas por especie.<br />
c. Se compilen datos existentes de pesquerías a pequeña escala, tales como flotas palangreras<br />
locales y pesquerías artesanales, y que, en caso necesario, se implementen programas de<br />
seguimiento de capturas para identificar las capturas por especie.<br />
119
120<br />
K. UPDATED STOCK STATUS INDICATORS FOR SILKY SHARKS IN THE EASTERN<br />
PACIFIC OCEAN (1994-2015)<br />
An attempt by the IATTC staff in 2013 to assess the status of the silky shark (Carcharhinus falciformis)<br />
in the eastern Pacific Ocean (EPO), using conventional stock assessment models, was severely<br />
handicapped by major uncertainties in the fishery data, mainly regarding total catch levels in the early<br />
years for all fisheries operating in the EPO that caught silky sharks (SAC-05 INF-F). Although this stock<br />
assessment attempt produced a substantial amount of new information about the silky shark in the EPO<br />
(e.g., absolute and relative magnitude of the catch by different fisheries, and their selectivities), the<br />
absolute scale of population trends and the derived management quantities were compromised. Since a<br />
conventional stock assessment was not possible, in 2014 the staff proposed a suite of possible stock status<br />
(or stability) indicators (SSIs) which could be considered for managing the silky sharks in the EPO (SAC-<br />
05-11a), including standardized catch-per-unit-effort type indices from the purse-seine fishery.<br />
Document SAC-07-06b.i presents an update of the purse-seine indices through 2015.<br />
Following previous methodology, indices for the silky shark were computed for the northern and southern<br />
EPO (north and south of the equator, respectively). For the northern EPO, the floating-object set index<br />
shows an initial sharp decline during 1994-1998, followed by a period of relative stability at a low level<br />
(1999-2009), then a sharp increase from 2009 to 2010, a sharp decrease from 2010 through 2012, and<br />
again a sharp increase from 2012 through 2015 (Figure K-1). The floating-object set index trend in the<br />
shows agreement with standardized presence/absence indices for the silky shark computed for dolphin<br />
sets and unassociated sets (Figure K-2). A comparison of differences among floating-object set trends<br />
computed by sub-area in the north suggest that the overall recent increasing trend may reflect an<br />
integration of spatially-distinct processes, including the effect of fishing pressure closer to the coast, and<br />
environmentally-mediated movement of individuals into the tropical EPO from the west. For the southern<br />
area, the floating-object set indicator shows a sharp decline during 1994-2004, followed by a period of<br />
stability at much lower levels until 2013, and then a small increase in 2014, with little change in 2015<br />
(Figure K-1). Due to the very low levels of silky shark bycatch in the southern area in dolphin and<br />
unassociated sets, no indices were computed for these sets types in the southern area.<br />
The IATTC staff does not consider the more optimistic recent trends in the indices to be strong enough to<br />
offset the urgent need for precautionary management actions, and reiterates its previous<br />
recommendations. In addition, it is critical that improvements are made in shark fishery data collection in<br />
the EPO so that conventional stock assessments and/or other indicators of stock status can be developed<br />
and the results made available to better inform the management of silky and other shark species.<br />
With respect to future research on SSIs for the silky shark in the EPO, priority should be given to<br />
improving the collection of shark fishery data in the EPO. As part of this effort, it is essential that data<br />
from other sources be collected to develop additional indicators. The purse-seine indicators alone are not<br />
sufficient to determine stock status for a species that may be impacted by different factors in different<br />
regions within the EPO. Obtaining reliable catch data for all fisheries catching silky sharks in the EPO,<br />
indices of abundance for other fisheries (e.g., longline fisheries, which take the majority of the catch), and<br />
composition data, is vital. To date, no target or limit reference points or harvest control rules have been<br />
developed for the silky shark. While the current data shortcomings persist, management strategy<br />
evaluation (MSE) work to simulation-test and identify the reference points and harvest control rules that<br />
will achieve the conservation goals for the EPO should be conducted.
121<br />
FIGURE K-1. Standardized catch-per-unit-effort (CPUE, in number of sharks per set) of all silky sharks<br />
in floating-object sets for northern (top) and southern (bottom) EPO stocks.<br />
FIGURA K-1. Captura por unidad de esfuerzo (CPUE, en número de tiburones por lance)<br />
estandarizada de todos los tiburones en lances sobre objetos flotantes de las poblaciones del OPO del<br />
norte (arriba) y sur (abajo).
122<br />
FIGURE K-2. Comparison of stock status indicators (SSIs) for the northern silky shark produced for<br />
different purse-seine set types (floating-object (OBJ), dolphin (DEL), unassociated (NOA)).<br />
FIGURA K-2. Comparación de indicadores de condición de población (SSI) para el tiburón sedoso<br />
del norte producidos para distintos tipos de lance cerquero (objeto flotante (OBJ), delfín (DEL), no<br />
asociado (NOA)).
123<br />
K. INDICADORES ACTUALIZADOS DE <strong>LA</strong> CONDICION DE <strong>LA</strong> POB<strong>LA</strong>CIÓN DEL<br />
TIBURÓN SEDOSO <strong>EN</strong> EL OCÉANO PACÍFICO ORI<strong>EN</strong>TAL, 1994-2015<br />
Un intento de evaluar la condición del tiburón sedoso (Carcharhinus falciformis) en el Océano Pacífico<br />
oriental (OPO) usando modelos convencionales de evaluación de poblaciones fue gravemente perjudicado<br />
por incertidumbres importantes en los datos de pesca, principalmente con respecto a los niveles de captura<br />
total en los años tempranos para todas las pesquerías que operaban en el OPO y que capturaban tiburones<br />
sedosos. Aunque este intento de evaluar la población produjo una cantidad sustancial de información<br />
nueva acerca del tiburón sedoso en el OPO (por ejemplo, magnitud absoluta y relativa de la captura por<br />
distintas pesquerías y su selectividad), la escala absoluta de las tendencias de la población y las cantidades<br />
de ordenación derivadas estuvieron comprometidas. Ya que una evaluación convencional de la población<br />
no era posible, en 2014 el personal de la CIAT propuso un conjunto de posibles indicadores de estatus (o<br />
estabilidad) de población (SSI; stock status indicators) que podrían ser considerados para la ordenación<br />
del tiburón sedoso en el OPO (Documento SAC-05-11a), incluyendo índices tipo captura por unidad de<br />
esfuerzo (CPUE) estandarizada de la pesquería de cerco. En el Documento SAC-07-06b.i se presenta una<br />
actualización de los índices de cerco hasta 2015.<br />
Siguiendo la metodología previa, se computaron índices para el tiburón sedoso en el OPO norte y sur (al<br />
norte y sur de la línea ecuatorial, respectivamente). En el caso del OPO norte, el índice de lances sobre<br />
objetos flotantes muestra una disminución durante 1994-1998, seguido por un periodo de estabilidad<br />
relativa a nivel bajo (1999-2009), luego un incremento brusco en 2009-2010, una disminución brusca de<br />
2010-2012, y de nuevo un incremento brusco de 2012 a 2015 (Figura K-1). La tendencia del índice de<br />
lances sobre objetos flotantes concuerda con índices de presencia/ausencia estandarizada para el tiburón<br />
sedoso computado para lances sobre delfines y no asociados (Figura K-2). La comparación de diferencias<br />
entre las tendencias en los lances sobre objetos flotantes computados por subárea en el norte sugiere que<br />
la tendencia creciente general reciente podría reflejar una integración de procesos espacialmente<br />
separados, incluyendo el efecto de la presión de pesca cerca de la costa, y desplazamientos de individuos<br />
al OPO tropical desde el oeste impulsados por condiciones ambientales. En el caso del área del sur, el<br />
indicador de lances sobre objetos flotantes muestra una disminución brusca durante 1994-2004, seguida<br />
por un periodo de estabilidad en niveles mucho más bajos hasta 2013, y luego un pequeño aumento en<br />
2014, con poco cambio en 2015 (Figura K-1). Debido a los niveles muy bajos de captura incidental de<br />
tiburones sedosos en el área del sur en lances sobre delfines y no asociados, no se computaron índices<br />
para estos tipos de lance en el área del sur.<br />
El personal de la CIAT no considera que las tendencias recientes más optimistas en los índices sean<br />
suficientemente fuertes para compensar la necesidad urgente de acciones de ordenación precautoria, y<br />
reitera sus recomendaciones previas. Además, es crítico que se mejore la recolección de datos de pesca de<br />
tiburones en el OPO para permitir desarrollar evaluaciones convencionales de la población y/o otros<br />
indicadores de la condición de la población, y los resultados publicados para informar mejor la<br />
ordenación del tiburón sedoso y otras especies de tiburones.<br />
Con respecto a investigaciones futuras de SSI para el tiburón sedoso en el OPO, se debería priorizar la<br />
mejora de la recolección de datos de pesca de tiburones en el OPO. Como parte de este esfuerzo, es<br />
esencial que se recolecten datos de otras fuentes para desarrollar indicadores adicionales. Los indicadores<br />
de cerco por sí solos no son suficientes para determinar la condición de la población de una especie que<br />
podría ser afectada por distintos factores en distintas regiones dentro del OPO. Es esencial obtener datos<br />
de captura fiables para todas las pesquerías que capturan tiburones sedosos en el OPO, índices de<br />
abundancia para otras pesquerías (por ejemplo, pesquerías palangreras, que toman la mayor parte de la<br />
captura), y datos de composición. Hasta la fecha, no se han desarrollado puntos de referencia objetivo y<br />
límite o reglas de control de extracción para el tiburón sedoso. Mientras persistan las insuficiencias<br />
actuales de los datos, se debería realizar trabajo de evaluación de estrategias de ordenación para probar<br />
por simulación e identificar los puntos de referencia y reglas de control de explotación que lograrán las<br />
metas de conservación en el OPO.
124<br />
L. ECOSYSTEM CONSIDERATIONS<br />
1. Introduction .................................................................................................................................... 124<br />
2. Impact of catches............................................................................................................................ 125<br />
3. Other fauna ..................................................................................................................................... 131<br />
4. Trophic interactions........................................................................................................................ 133<br />
5. Physical environment ..................................................................................................................... 138<br />
6. Aggregate indicators ...................................................................................................................... 139<br />
7. Ecological risk assessment ............................................................................................................. 142<br />
8. Ecosystem modeling ...................................................................................................................... 146<br />
9. Actions by the IATTC and the AIDCP addressing ecosystem considerations ................................ 147<br />
10. Future developments ...................................................................................................................... 150<br />
1. INTRODUCTION<br />
The 1995 FAO Code of Conduct for Responsible Fisheries stipulates that States and users of living<br />
aquatic resources should conserve aquatic ecosystems and it provides that management of fisheries should<br />
ensure the conservation not only of target species, but also of species belonging to the same ecosystem or<br />
associated with or dependent upon the target species. 5 In 2001, the Reykjavik Declaration on Responsible<br />
Fisheries in the Marine Ecosystem elaborated these principles with a commitment to incorporate an<br />
ecosystem approach into fisheries management.<br />
Consistent with these instruments, one of the functions of the IATTC under the 2003 Antigua Convention<br />
is to “adopt, as necessary, conservation and management measures and recommendations for species<br />
belonging to the same ecosystem and that are affected by fishing for, or dependent on or associated with,<br />
the fish stocks covered by this Convention, with a view to maintaining or restoring populations of such<br />
species above levels at which their reproduction may become seriously threatened”.<br />
Consequently, the IATTC has taken account of ecosystem issues in many of its decisions, and this report<br />
on the offshore pelagic ecosystem of the tropical and subtropical Pacific Ocean, which is the habitat of<br />
tunas and billfishes, has been available since 2003 to assist in making its management decisions. This<br />
section provides a coherent view, summarizing what is known about the direct impact of the fisheries<br />
upon various species and species groups of the ecosystem, and reviews what is known about the<br />
environment and about other species that are not directly impacted by the fisheries but may be indirectly<br />
impacted by means of predator-prey interactions in the food web.<br />
This review does not suggest objectives for the incorporation of ecosystem considerations into the<br />
management of tuna or billfish fisheries, nor any new management measures. Rather, its prime purpose is<br />
to offer the Commission the opportunity to ensure that ecosystem considerations are part of its agenda.<br />
It is important to remember that the view that we have of the ecosystem is based on the recent past;<br />
we have almost no information about the ecosystem before exploitation began. Also, the environment<br />
is subject to change on a variety of time scales, including the well-known El Niño fluctuations and<br />
more recently recognized longer-term changes, such as the Pacific Decadal Oscillation and other<br />
climate changes.<br />
In addition to reporting the catches of the principal species of tunas and billfishes, the staff has reported<br />
the bycatches of non-target species that are either retained or discarded. In this section, data on these<br />
bycatches are presented in the context of the effect of the fishery on the ecosystem. Unfortunately, while<br />
5 The Code also provides that management measures should ensure that biodiversity of aquatic habitats and<br />
ecosystems is conserved and endangered species are protected and that States should assess the impacts of<br />
environmental factors on target stocks and species belonging to the same ecosystem or associated with or<br />
dependent upon the target stocks, and assess the relationship among the populations in the ecosystem.
125<br />
relatively good information is available for the tunas and billfishes, information for the entire fishery is<br />
not available. The information is comprehensive for large (carrying capacity greater than 363 metric tons)<br />
purse seiners that carry observers under the Agreement on the International Dolphin Conservation<br />
Program (AIDCP), and information on retained catches is also reported for other purse seiners, pole-andline<br />
vessels, and much of the longline fleet. Some information is available on sharks that are retained by<br />
parts of the longline fleet. Information on retained and discarded non-target species is reported for large<br />
purse-seiners, and is available for very few trips of smaller ones. There is little information available on<br />
the bycatches and discards for other fishing vessels.<br />
2. IMPACT OF CATCHES<br />
2.1. Single-species assessments<br />
Current information on the effects of the tuna fisheries on the stocks of individual species in the eastern<br />
Pacific Ocean (EPO) and the detailed assessments are found in this document. An ecosystem perspective<br />
requires a focus on how the fishery may have altered various components of the ecosystem. Sections 2.2<br />
and 2.3 of this report refer to information on the current biomass of each stock considered, compared to<br />
estimates of what it might have been in the absence of a fishery. Furthermore, section 2.2 includes a<br />
summary of some recent research conducted on drifting fish aggregating device- (FAD) associated<br />
aggregations, including methods which may lead to solutions on how to reduce the fishing mortality on<br />
undesirable-sizes of bigeye and yellowfin tunas. There are no direct measurements of the stock size<br />
before the fishery began, and, in any case, the stocks would have varied from year to year. In addition, the<br />
unexploited stock size may be influenced by predator and prey abundance, which is not included in the<br />
single-species analyses.<br />
2.2. Tunas<br />
Information on the effects of the fisheries on yellowfin, bigeye, and skipjack tunas is found in Documents<br />
SAC-07-05b, 05a, and 05c, respectively, and an executive summary of Pacific bluefin tuna will be<br />
available at this meeting. The ISC Northern Albacore Working Group completed its stock assessment in<br />
2014 and the next assessment is scheduled for 2017.<br />
IATTC staff recently published two studies that focused on the potential reduction of fishing mortality by<br />
purse seine on undesirable sizes of bigeye and yellowfin tunas and other species of concern, while still<br />
capturing associated schools of skipjack tuna. The first of these studies evaluated the simultaneous<br />
behaviors of skipjack, bigeye, and yellowfin tunas within large multi-species aggregations associated with<br />
FADs. The researchers documented spatial and temporal differences in the schooling behavior of the<br />
three species of tunas, including depth distributions, and found that the differences did not appear<br />
sufficient such that modifications in purse seine fishing practices could effectively avoid the capture of<br />
small bigeye and yellowfin, while optimizing the capture of skipjack. The second study assessed a fishing<br />
captain’s ability to predict species composition, sizes, and quantities of tunas associated with drifting<br />
FADs, before encirclement with a purse-seine. The captain’s predictions were significantly related to the<br />
actual total catch and catch by species, but not to size categories by species. Predictions of species<br />
composition were most accurate when estimates of bigeye and yellowfin tuna were combined, indicating<br />
the captain was overestimating one species while underestimating the other.<br />
2.3. Billfishes<br />
Information on the effects of the tuna fisheries on swordfish, blue marlin, striped marlin, and sailfish is<br />
presented in Sections G-J of IATTC Fishery Status Report 13. Stock assessments and/or stock structure<br />
analyses for swordfish (2007, structure), eastern Pacific striped marlin (2010, assessment and structure),<br />
northeast Pacific striped marlin (2011, assessment), southeast Pacific swordfish (2012, assessment), and<br />
eastern Pacific sailfish (2013, assessment) were completed by the IATTC staff. Stock assessments for<br />
Pacific blue marlin (2013) and for north Pacific swordfish (2014) and striped marlin (2015) were<br />
completed by the billfish working group of the International Scientific Committee (ISC) for Tuna and
126<br />
Tuna-like Species in the North Pacific Ocean.<br />
2.3.1. Black marlin and shortbill spearfish<br />
No stock assessments have been made for these species, although there are some data published jointly by<br />
scientists of the National Research Institute of Far Seas Fisheries (NRIFSF) of Japan and the IATTC in<br />
the IATTC Bulletin series that show trends in catches, effort, and catches per unit of effort (CPUEs).<br />
2.4. Summary<br />
Preliminary estimates of the catches (including purse-seine discards), in metric tons, of tunas, bonitos, and<br />
billfishes during 2015 in the EPO are found in Tables A-2a and A-2b of Document SAC-07-03a.<br />
2.5. Marine mammals<br />
Marine mammals, especially spotted dolphins (Stenella attenuata), spinner dolphins (S. longirostris), and<br />
common dolphins (Delphinus delphis), are frequently found associated with yellowfin tuna in the size<br />
range of about 10 to 40 kg in the EPO. Purse-seine fishermen have found that their catches of yellowfin in<br />
the EPO can be maximized by setting their nets around herds of dolphins and the associated schools of<br />
tunas, and then releasing the dolphins while retaining the tunas. The estimated incidental mortality of<br />
dolphins in this operation was high during the early years of the fishery, and the populations of dolphins<br />
were reduced from their unexploited levels during the 1960s and 1970s. After the late 1980s the<br />
incidental mortality decreased precipitously, and there is now evidence that the populations are<br />
recovering. Preliminary mortality estimates of dolphins in the fishery in 2015 are shown in Table 1. The<br />
IATTC staff is responsible for the assessment of dolphin populations associated with the purse-seine<br />
fishery for tunas, as a basis for the dolphin mortality limits established by the Agreement on the<br />
International Dolphin Conservation Program (AIDCP).<br />
Studies of the association of tunas with dolphins have been an important component of the staff’s longterm<br />
approach to understanding key interactions in the ecosystem. The extent to which yellowfin tuna and<br />
dolphins compete for resources, whether either or both of them benefits from the interaction, why the tuna<br />
are most often found with spotted dolphins versus other dolphins, and why the species associate most<br />
strongly in the eastern tropical Pacific, remain critical pieces of information, given the large biomasses of<br />
both groups and their high rates of prey consumption. Three studies were conducted to address these<br />
hypotheses: a simultaneous tracking study of spotted dolphins and yellowfin tuna, a trophic interactions<br />
study comparing their prey and daily foraging patterns, and a spatial study of oceanographic features<br />
correlated with the tuna dolphin association. These studies demonstrated that the association is neither<br />
permanent nor obligatory, and that the benefits of the association are not based on feeding advantages.<br />
The studies support the hypothesis that one or both species reduce the risk of predation by forming large,<br />
mixed-species groups. The association is most prevalent where the habitat of the tuna is compressed to<br />
the warm, shallow, surface waters of the mixed layer by the oxygen minimum zone, a thick layer of<br />
oxygen-poor waters underlying the mixed layer. The association has been observed in areas with similar<br />
oceanographic conditions in other oceans, but it is most prevalent and consistent in the eastern tropical<br />
Pacific, where the oxygen minimum zone is the most hypoxic and extensive in the world.<br />
During August-December 2006, scientists of the U.S. National Marine Fisheries Service (NMFS)<br />
conducted the latest in a series of research cruises under the Stenella Abundance Research (STAR)<br />
project. The primary objective of the multi-year study is to investigate trends in population size of the<br />
dolphins that have been taken as incidental catch by the purse-seine fishery in the EPO. Data on cetacean<br />
distribution, herd size, and herd composition were collected from the large-scale line-transect surveys to<br />
estimate dolphin abundance. Oceanographic data are collected to characterize habitat and its variation
127<br />
over time. Data on distribution and abundance of prey fishes and squids, seabirds, and sea turtles further<br />
characterize the ecosystem in which these dolphins live. The 2006 survey covered the same areas and<br />
used the same methods as past surveys. Data from the 2006 survey produced new abundance estimates,<br />
and previous data were re-analyzed to produce revised estimates for 10 dolphin species and/or stocks in<br />
the EPO between 1986 and 2006. The 2006 estimates for northeastern offshore spotted dolphins were<br />
somewhat greater, and for eastern spinner dolphins substantially greater, than the estimates for 1998-<br />
2000. Estimates of population growth for these two depleted stocks and the depleted coastal spotted<br />
dolphin stock may indicate they are recovering, but the western-southern offshore spotted dolphin stock<br />
may be declining. The 1998-2006 abundance estimates for coastal spotted, whitebelly spinner, and roughtoothed<br />
(Steno bredanensis) dolphins showed an increasing trend, while those for the striped (S.<br />
coeruleoalba), short-beaked common (Delphinus delphis), bottlenose (Tursiops truncatus), and Risso’s<br />
(Grampus griseus) dolphins were generally similar to previous estimates obtained with the same methods.<br />
Because there have been no NMFS surveys since 2006, new modelling was conducted during 2014 and<br />
2015 on trends in dolphin relative abundance using purse-seine observer data. That research concluded<br />
that indices of relative abundance from purse-seine observer data for species such as dolphins in the EPO<br />
that are directly associated with the fishing process are unlikely to be reliable indicators. Not only are<br />
such indices susceptible to the usual problems of changes in fishing behavior, but there is not a clear<br />
distinction between indexing the dolphin-tuna association and indexing dolphin abundance. This research,<br />
as well as alternative means of monitoring dolphin stocks, was published in 2015.<br />
Scientists of the NMFS have made estimates of the abundances of several other species of marine<br />
mammals based on data from research cruises made between 1986 and 2000 in the EPO. Of the species<br />
not significantly affected by the tuna fishery, short-finned pilot whales (Globicephala macrorhynchus)<br />
and three stocks of common dolphins showed increasing trends in abundance during that 15-year period.<br />
The apparent increased abundance of these mammals may have caused a decrease in the carrying capacity<br />
of the EPO for other predators that overlap in diet, including spotted dolphins. Bryde’s whales<br />
(Balaenoptera edeni) also increased in estimated abundance, but there is very little diet overlap between<br />
these baleen whales and the upper-level predators impacted by the fisheries. The abundance estimates for<br />
sperm whales (Physeter<br />
macrocephalus) tended to decrease<br />
during 1986-2000.<br />
Some marine mammals are adversely<br />
affected by reduced food availability<br />
during El Niño events, especially in<br />
coastal ecosystems. Examples that<br />
have been documented include<br />
dolphins, pinnipeds, and Bryde’s<br />
whales off Peru, and pinnipeds around<br />
the Galapagos Islands. Large whales<br />
are able to move in response to<br />
changes in prey productivity and<br />
distribution.<br />
2.6. Sea turtles<br />
Sea turtles are caught on longlines<br />
when they take the bait on hooks, are<br />
snagged accidentally by hooks, or are<br />
entangled in the lines. Estimates of<br />
incidental mortality of turtles due to<br />
TABLE 1. Mortality of dolphins and other marine mammals<br />
caused by the fishery in the EPO during 2015<br />
Species and stock<br />
Incidental mortality<br />
Number Metric tons<br />
Offshore spotted dolphin<br />
Northeastern 191 12.5<br />
Western-southern 158 10.3<br />
Spinner dolphin<br />
Eastern 196 8.7<br />
Whitebelly 139 8.4<br />
Common dolphin<br />
Northern 43 3.0<br />
Central 21 1.5<br />
Southern 12 0.8<br />
Other mammals* 5 0.3<br />
Total 765 45.5<br />
*“Other mammals” includes the following species and stocks,<br />
whose observed mortalities were as follows: unidentified<br />
dolphins 5 (0.3 t).
128<br />
longline and gillnet fishing are few. At the 4th meeting of the IATTC Working Group on Bycatch in<br />
January 2004, it was reported that 166 leatherback (Dermochelys coriacea) and 6,000 other turtle species,<br />
mostly olive Ridley (Lepidochelys olivacea), were incidentally caught by Japan’s longline fishery in the<br />
EPO during 2000, and that, of these, 25 and 3,000, respectively, were dead. At the 6th meeting of the<br />
Working Group in February 2007, it was reported that the Spanish longline fleet targeting swordfish in<br />
the EPO averaged 65 interactions and 8 mortalities per million hooks during 1990-2005. The mortality<br />
rates due to longlining in the EPO are likely to be similar for other fleets targeting bigeye tuna, and<br />
possibly greater for those that set their lines at shallower depths for albacore and swordfish. About 23<br />
million of the 200 million hooks set each year in the EPO by distant-water longline vessels target<br />
swordfish with shallow longlines.<br />
In addition, there is a sizeable fleet of artisanal longline vessels that fish for tunas, billfishes, sharks, and<br />
dorado (Coryphaena spp.) in the EPO. Since 2005, staff members of the IATTC and some other<br />
organizations, together with the governments of several coastal Latin American nations, have been<br />
engaged in a program to reduce the hooking rates and mortalities of sea turtles in these fisheries.<br />
Additional information on this program can be found in Section 9.2.<br />
Sea turtles are occasionally caught in<br />
purse seines in the EPO tuna fishery.<br />
Most interactions occur when the turtles<br />
associate with floating objects, and are<br />
captured when the object is encircled. In<br />
other cases, nets set around unassociated<br />
schools of tunas or schools associated<br />
with dolphins may capture sea turtles that<br />
happen to be at those locations. The olive<br />
Ridley turtle is, by far, the species of sea<br />
turtle taken most often by purse seiners. It<br />
is followed by green sea turtles (Chelonia<br />
mydas), and, very occasionally, by<br />
loggerhead (Caretta caretta) and<br />
TABLE 2. Numbers of turtle mortalities caused by large<br />
purse-seine vessels in the EPO during 2015<br />
Set type<br />
OBJ NOA DEL<br />
Total<br />
Olive Ridley 2 - 1 3<br />
Eastern Pacific green - - - -<br />
Loggerhead - - - -<br />
Hawksbill - - - -<br />
Leatherback - - - -<br />
Unidentified - 4 - 4<br />
Total 2 4 1 7<br />
hawksbill (Eretmochelys imbricata) turtles. From 1990, when IATTC observers began recording this<br />
information, through 2015, only three mortalities of leatherback (Dermochelys coriacea) turtles have been<br />
recorded. Some of the turtles are unidentified because they were too far from the vessel or it was too dark<br />
for the observer to identify them. Sea turtles, at times, become entangled in the webbing under fishaggregating<br />
devices (FADs) and drown. In some cases, they are entangled by the fishing gear and may be<br />
injured or killed. Preliminary estimates of the mortalities (in numbers) of turtles caused by large purseseine<br />
vessels during 2015, by set type (on floating objects (OBJ), unassociated schools (NOA), and<br />
dolphins (DEL)), are shown in Table 2.<br />
The mortalities of sea turtles due to purse seining for tunas are probably less than those due to other types<br />
of human activity, which include exploitation of eggs and adults, beach development, pollution,<br />
entanglement in and ingestion of marine debris, and impacts of other fisheries.<br />
The populations of olive Ridley and loggerhead turtles are designated as vulnerable, those of green and<br />
loggerhead turtles are designated as endangered, and those of hawksbill and leatherback turtles as<br />
critically endangered, by the International Union for the Conservation of Nature (IUCN).<br />
2.7. Sharks and other large fishes<br />
Sharks and other large fishes are taken by both purse-seine and longline vessels. Silky sharks<br />
(Carcharhinus falciformis) are the most commonly-caught species of shark in the purse-seine fishery. The<br />
longline fisheries also take silky sharks. An analysis of longline and purse-seine fishing is necessary to<br />
estimate the impact of fishing on the stock(s).
129<br />
A project was conducted during May 2007-June 2008 by scientists of the IATTC and the NMFS to collect<br />
and archive tissue samples of sharks, rays, and other large fishes for genetics analysis. Data from the<br />
archived samples are being used in studies of large-scale stock structure of these taxa in the EPO,<br />
information that is vital for stock assessments and is generally lacking throughout the Pacific Ocean. The<br />
preliminary results of an analysis for silky sharks showed that for management purposes, silky sharks in<br />
the EPO should be divided into two stocks, one north and one south of the equator. In addition, the<br />
results of a mitochondrial-DNA study from 2013 show a slight genetic divergence between silky sharks in<br />
the western and eastern Pacific, which supports assessing and managing these two populations separately.<br />
Stock assessments are available for only four shark species in the EPO: silky, blue (Prionace glauca),<br />
mako (Isurus oxyrinchus) and common thresher sharks (Alopias vulpinus). The impacts of the bycatches<br />
on the stocks of other shark species in the EPO are unknown.<br />
A stock assessment for silky sharks covering the 1993-2010 period was attempted using the Stock<br />
Synthesis model. Unfortunately, the model was unable to fit the main index of abundance adequately, and<br />
therefore the results were not reliable since relative trends and absolute scale are compromised in the<br />
assessment. Results are presented in Document SAC-05 INF-F. The majority of the catches of silky<br />
sharks in the EPO is estimated to be taken by longliners, some of them targeting sharks. As an alternative<br />
to conventional stock assessment models, a suite of possible stock status (or stability) indicators (SSIs),<br />
which could be considered for managing the northern and southern stocks of silky sharks in the EPO, are<br />
provided in Document SAC-05-11a. Updated SSIs, based on standardized catch-per-unit effort (CPUE) in<br />
purse-seine sets on floating objects (CPUE-OBJ), for silky sharks from 1994-2014 are presented in<br />
Document SAC-06-08b. Results therein indicate an apparent reduction in bycatch rates for all size<br />
classes north of the equator. For the southern stock, there is a major decline in bycatch rates. No stock<br />
status target and limit reference points have been developed for silky sharks based on these indicators. No<br />
harvest control rules have been developed and tested. At this point, the indicators cannot be used directly<br />
for determining the status of the stock or for establishing catch limits.<br />
A stock assessment for blue sharks in the North Pacific Ocean was conducted by scientists of the ISC<br />
Shark Working Group in 2014. The report states, “Results of the reference case model showed that the<br />
stock biomass was near a time-series high in 1971, fell to its lowest level between the late 1980s and early<br />
1990s, and subsequently increased gradually and has leveled off at a biomass similar to that at the<br />
beginning of the time-series.”<br />
The ISC Shark Working Group conducted a new stock assessment of mako sharks in 2015. The<br />
report acknowledged the limited data available for this species and the lack of information on<br />
important fisheries. Thus, the stock status (overfishing and overfished) of mako sharks in the North<br />
Pacific Ocean is undetermined.<br />
Scientists at the NMFS conducted a stock assessment for common thresher sharks along the west coast of<br />
North America. Their results indicate, “this stock of common thresher sharks is unlikely to be in an<br />
overfished condition nor experiencing overfishing. The stock experienced a relatively large and quick<br />
decline in the late 1970s and early 1980s, soon after the onset of the USA swordfish/shark drift gillnet<br />
fishery, with spawning depletion dropping to 0.4 in 1985. The population appeared to have stabilized in<br />
the mid-1980s after substantial regulations were imposed. Over the past 15 years, the stock began<br />
recovering relatively quickly and is currently close to an unexploited level.”<br />
Preliminary estimates of the catches (including purse-seine discards), in metric tons, of sharks and<br />
other large fishes in the EPO during 2015, other than those mentioned above, by large purse-seine<br />
vessels are shown in Table 3. Complete data are not available for small purse-seine, longline, and<br />
other types of vessels.<br />
The catch rates of species other than tunas in the purse-seine fishery are different for each type of set.<br />
With a few exceptions, the bycatch rates are greatest in sets on floating objects, followed by unassociated
130<br />
sets and, at a much lower level, dolphin sets. Dolphin bycatch rates are greatest for dolphin sets, followed<br />
by unassociated sets and, at a much lower level, floating-object sets. In general, the bycatch rates of<br />
manta rays (Mobulidae), and stingrays (Dasyatidae) are greatest in unassociated sets, followed by dolphin<br />
sets, and lowest in floating-object sets, although in 2015 the bycatch rate was greater in dolphin sets than<br />
unassociated sets. Because of these differences, it is necessary to follow the changes in frequency of the<br />
different types of sets to interpret the changes in bycatch data. The estimated numbers of purse-seine sets<br />
of each type in the EPO during 1999-2015 are shown in Table A-7 of Document SAC-07-03a.<br />
The reduction of bycatches is a goal of ecosystem-based fisheries management. A recently-published<br />
study analyzed the ratio of bycatch to target catch across a range of set size-classes (in tons). The study<br />
demonstrated that the ratios of total bycatch to tuna catch and silky shark bycatch to tuna catch decreased<br />
as set size increased. The greatest bycatch ratios occurred in sets catching
131<br />
the IATTC staff so that solid scientific information is available for this purpose.<br />
The IATTC held its first technical meeting on dorado in 2014. That meeting had three objectives: 1) to<br />
promote synergy among the Members of the IATTC for a regional investigation of dorado in the EPO; 2)<br />
to review the current state of knowledge of dorado and identify available data sets across fisheries/regions<br />
in the EPO); and 3) to plan a future collaborative research plan. This collaborative effort thus far includes:<br />
analysis of available catch statistics and trade records, improvement of field data collection programs,<br />
investigation of seasonal trends, and identification of fishery units. In addition, available fishery data on<br />
dorado from IATTC Members and other nations are being analyzed to develop stock status indicators<br />
(SSIs) which could potentially provide a basis for advice for managing the species in the EPO (see SAC-<br />
05-11b). The work was continued in 2015 and a second technical meeting was held with the aim to<br />
address two important questions: 1) What are reasonable stock structure assumptions to consider for<br />
regional management of dorado in the EPO? and 2) Which indicators of stock status should be monitored<br />
to provide scientific advice for regional management?<br />
3. OTHER FAUNA<br />
3.1. Seabirds<br />
There are approximately 100 species of seabirds in the tropical EPO. Some seabirds associate with<br />
epipelagic predators near the sea surface, such as fishes (especially tunas) and marine mammals.<br />
Subsurface predators often drive prey to the surface to trap them against the air-water interface, where the<br />
prey becomes available to the birds. Most species of seabirds take prey within a half meter of the sea<br />
surface or in the air (flyingfishes (Exocoetidae) and squids (primarily Ommastrephidae)). In addition to<br />
driving the prey to the surface, subsurface predators make prey available to the birds by injuring or<br />
disorienting the prey, and by leaving scraps after feeding on large prey. Feeding opportunities for some<br />
seabird species are dependent on the presence of tuna schools feeding near the surface.<br />
Seabirds are affected by the variability of the ocean environment. During the 1982-1983 El Niño event,<br />
seabird populations throughout the tropical and northeastern Pacific Ocean experienced breeding failures<br />
and mass mortalities, or migrated elsewhere in search of food. Some species, however, are apparently not<br />
affected by El Niño episodes. In general, seabirds that forage in upwelling areas of the tropical EPO and<br />
Peru Current suffer reproductive failures and mortalities due to food shortage during El Niño events,<br />
while seabirds that forage in areas less affected by El Niño episodes may be relatively unaffected.<br />
According to the Report of the Scientific Research Program under the U.S. International Dolphin<br />
Conservation Program Act, prepared by the NMFS in September 2002, there were no significant<br />
temporal trends in abundance estimates over the 1986-2000 period for any species of seabird, except for a<br />
downward trend for the Tahiti petrel (Pseudobulweria rostrata), in the tropical EPO. Population status<br />
and trends are currently under review for waved (Phoebastria irrorata), black-footed (P. nigripes), and<br />
Laysan (P. immutabilis) albatrosses.<br />
Some seabirds, especially albatrosses and petrels, are susceptible to being caught on baited hooks in<br />
pelagic longline fisheries. Satellite tracking and at-sea observation data have identified the importance of<br />
the IATTC area for waved, black-footed, Laysan, and black-browed (Thalassarche melanophrys)<br />
albatrosses, plus several other species that breed in New Zealand, yet forage off the coast of South<br />
America. There is particular concern for the waved albatross because it is endemic to the EPO and nests<br />
only in the Galapagos Islands. Observer data from artisanal vessels show no interactions with waved<br />
albatross during these vessels’ fishing operations. Data from the US pelagic longline fishery in the<br />
northeastern Pacific Ocean indicate that bycatches of black-footed and Laysan albatrosses occur. Few<br />
comparable data for the longline fisheries in the central and southeastern Pacific Ocean are available. At<br />
the 6th meeting of the IATTC Working Group on Bycatch in February 2007, it was reported that the<br />
Spanish surface longline fleet targeting swordfish in the EPO averaged 40 seabird interactions per million<br />
hooks, virtually all resulting in mortality, during 1990-2005. In 2007, the IATTC Stock Assessment
132<br />
Working Group identified areas of vulnerability to industrial longline fishing for several species of<br />
albatross and proposed mitigation measures. See also section 9.3.<br />
3.2. Forage<br />
The forage taxa occupying the middle trophic levels in the EPO are obviously important components of<br />
the ecosystem, providing a link between primary producers at the base of the food web and the uppertrophic-level<br />
predators, such as tunas and billfishes. Indirect effects on those predators caused by<br />
environmental variability are transmitted to the upper trophic levels through the forage taxa. Little is<br />
known, however, about fluctuations in abundance of the large variety of prey species in the EPO.<br />
Scientists from the NMFS have recorded data on the distributions and abundances of common prey<br />
groups, including lantern fishes (Myctophidae), flyingfishes, and some squids, in the tropical EPO during<br />
1986-1990 and 1998-2000. Mean abundance estimates for all fish taxa and, to a lesser extent, for squids<br />
increased from 1986 through 1990. The estimates were low again in 1998, and then increased through<br />
2000. Their interpretation of this pattern was that El Niño events in 1986-1987 and 1997-1998 had<br />
negative effects on these prey populations. More data on these taxa were collected during the NMFS<br />
STAR 2003 and 2006 cruises.<br />
Recent research by a scientist at NMFS focused on assessing the habitat use of several mesopelagic fish<br />
families throughout various life stages in the EPO to aid in understanding their role in the ecosystem. The<br />
work also included describing ontogenetic changes in abundance and horizontal distribution of common<br />
species of mesopelagic fish larvae impacted by the El Niño event in 1997-1998 followed by the La Niña<br />
in the California Cooperative Oceanic Fisheries Investigations (CalCOFI) study area. Within the CalCOFI<br />
sampling region, mesopelagic fishes (2 species of Myctophidae and 1 species of Phosichthyidae) with an<br />
affinity for warm water conditions had a higher larval abundance, were closer to shore during the El Niño,<br />
and were less abundant and farther offshore during the La Niña. The opposite pattern was generally<br />
observed for mesopelagic fishes (3 species of Bathylagidae and 4 species of Myctophidae) with an<br />
affinity for cold water conditions.<br />
Cephalopods, especially squids, play a central role in many, if not most, marine pelagic food webs by<br />
linking the massive biomasses of micronekton, particularly myctophid fishes, to many oceanic predators.<br />
Given the high trophic flux passing through the squid community, a concerted research effort on squids is<br />
thought to be important for understanding their role as key prey and predators. In 2013, a special volume<br />
of the journal Deep Sea Research II, Topical Studies in Oceanography (Vol. 5) was focused on The Role<br />
of Squids in Pelagic Ecosystems. The volume covers six main research areas: squids as prey, squids as<br />
predators, the role of squids in marine ecosystems, physiology, climate change, and the Humboldt or<br />
jumbo squid (Dosidicus gigas) as a recent example of ecological plasticity in a cephalopod species.<br />
Humboldt squid populations in the EPO have increased in size and geographic range in recent years. For<br />
example, the Humboldt squid expanded its range to the north into waters off central California, USA from<br />
2002 to mid-2010. In addition, in 2002 observers on tuna purse-seine vessels reported increased<br />
incidental catches of Humboldt squid taken with tunas, primarily skipjack, off Peru. Juvenile stages of<br />
these squid are common prey for yellowfin and bigeye tunas, and other predatory fishes, and Humboldt<br />
squid are also voracious predators of small fishes and cephalopods throughout their range. Large<br />
Humboldt squid have been observed attacking skipjack and yellowfin inside a purse seine. Not only have<br />
these squid impacted the ecosystems that they have expanded into, but they are also thought to have the<br />
capacity to affect the trophic structure in pelagic regions. Changes in the abundance and geographic<br />
range of Humboldt squid could affect the foraging behavior of the tunas and other predators, perhaps<br />
changing their vulnerability to capture.<br />
Some small fishes, many of which are forage for the larger predators, are incidentally caught by purseseine<br />
vessels in the EPO. Frigate and bullet tunas (Auxis spp.), for example, are a common prey of many<br />
of the animals that occupy the upper trophic levels in the tropical EPO. In the tropical EPO ecosystem<br />
model (Section 8), frigate and bullet tunas comprise 10% or more of the diet of eight predator species or
133<br />
TABLE 4. Catches of small fishes, in tons, by large purse-seine vessels with observers aboard in the<br />
EPO, 2015<br />
Set type<br />
OBJ NOA DEL<br />
Total<br />
Triggerfishes (Balistidae) and filefishes (Monacanthidae) 141 4
134<br />
accurate information on the trophic links and biomass flows through the food web in open-ocean<br />
ecosystems, and a basic understanding of the natural variability forced by the environment.<br />
Knowledge of the trophic ecology of predatory fishes has historically been derived from stomach contents<br />
analysis, and more recently from chemical indicators. Large pelagic predators are considered efficient<br />
biological samplers of micronekton organisms, which are poorly sampled by nets and trawls. Diet studies<br />
have revealed many of the key trophic connections in the pelagic EPO, and have formed the basis for<br />
representing food-web interactions in an ecosystem model (IATTC Bulletin, Vol. 22, No. 3) to explore<br />
indirect ecosystem effects of fishing. For example, studies in the 1990s and 2000s revealed that the most<br />
common prey items of yellowfin tuna caught by purse seines offshore were frigate and bullet tunas, red<br />
crabs (Pleuroncodes planipes), Humboldt squid, a mesopelagic fish (Vinciguerria lucetia), and several<br />
epipelagic fishes. Bigeye tuna feed at greater depths than do yellowfin and skipjack, and consume<br />
primarily cephalopods and mesopelagic fishes. The most important prey of skipjack overall were reported<br />
to be euphausiid crustaceans during the late 1950s, whereas the small mesopelagic fish V. lucetia<br />
appeared dominant in the diet during the early 1990s. Tunas that feed inshore often utilize different prey<br />
than those caught offshore.<br />
Historical studies of tuna diets in the EPO were based on qualitative data from few samples, with little or<br />
no indication of relative prey importance. Contemporary studies, however, have used diet indices,<br />
typically volume or weight importance, numeric importance, and frequency of occurrence of prey items to<br />
quantify diet composition, often in conjunction with chemical indicators, such as stable-isotope and fattyacid<br />
analyses. A chapter entitled “Bioenergetics, trophic ecology, and niche separation of tunas” will be<br />
published in 2016 in the serial Advances in Marine Biology. It reviews current understanding of the<br />
bioenergetics and feeding dynamics of tunas on a global scale, with emphasis on yellowfin, bigeye,<br />
skipjack, albacore, and Atlantic bluefin tunas in seven oceans or ocean regions. Food consumption<br />
balances bioenergetics expenditures for respiration, growth (including gonad production), specific<br />
dynamic action, egestion, and excretion. Each species of tuna appears to have a generalized feeding<br />
strategy, in the sense that their diets were characterized by high prey diversity and overall low abundance<br />
of individual prey types. Ontogenetic and spatial diet differences are substantial, and significant interdecadal<br />
changes in prey composition have been observed. Diet shifts from larger to smaller prey taxa<br />
highlight ecosystem-wide changes in prey availability and diversity, and provide implications for<br />
changing bioenergetics requirements into the future. The lack of long-term data limits the ability to<br />
predict the impacts of climate change on tuna feeding behavior, and thus there is a need for systematic<br />
collection of feeding data as part of routine monitoring of these species.<br />
New statistical methods for analyzing complex, multivariate stomach-contents data have been developed<br />
through an international collaboration, Climate Impacts on Oceanic Top Predators-Integrated Marine<br />
Biogeochemistry and Ecosystem Research (CLIOTOP-IMBER), Working Group 3 (WG3: Trophic<br />
pathways in open-ocean ecosystems), to assess the trophodynamics of marine top predators. This<br />
methodology shows promise for analyzing broad-scale spatial, temporal, environmental, and biological<br />
relationships in a classification-tree modeling framework that predicts the prey compositions of predators.<br />
Two recent studies of yellowfin tuna and silky sharks in the EPO, discussed below, used the approach to<br />
infer changes in prey populations over space (yellowfin and silky sharks) and time (yellowfin) based on<br />
stomach contents data. In 2015, progress was made by WG3 on a global analysis of the diets of yellowfin,<br />
bigeye and albacore tunas, using the classification tree approach to assess whether spatial analyses can be<br />
used to hypothesize predation changes in a warming ocean. Diet data of yellowfin and bigeye tuna caught<br />
in the purse-seine fishery in the EPO was included in this global analysis.<br />
Stomach samples of ubiquitous generalist predators, such as the tunas, can be used to infer changes in<br />
prey populations by identifying changes in foraging habits over time. Prey populations that support upperlevel<br />
predators vary over time (see 3.2 Forage), and some prey impart considerable predation pressure on<br />
animals that occupy the lower trophic levels (including the early life stages of large fishes). A<br />
comprehensive analysis of predation by yellowfin tuna on a decadal scale in the EPO was completed in
135<br />
2013. Samples from 6,810 fish were taken from 433 purse-seine sets during two 2-year periods separated<br />
by a decade. Simultaneously, widespread reductions in biological production, changes in phytoplankton<br />
community composition, and a vertical expansion and intensification of the oxygen minimum zone<br />
appeared to alter the food webs in tropical and subtropical oceans (see 5. Physical environment). A<br />
modified classification tree approach, mentioned above, was used to analyze spatial, temporal,<br />
environmental, and biological covariates explaining the predation patterns of the yellowfin during 1992-<br />
1994 and 2003-2005. For the majority of the yellowfin stock in the EPO, a major diet shift was apparent<br />
during the decade. Fishes were more abundant (by weight) during the early 1990s, while cephalopods<br />
and crustaceans predominated a decade later. As a group, epipelagic fishes declined from 82% to 31% of<br />
the diet, while mesopelagic species increased from 9% to 29% over the decade. Spatial partial<br />
dependence plots revealed range expansions by Vinciguerria lucetia, Humboldt squid (Dosidicus gigas),<br />
and Pleuroncodes planipes, range contractions by Auxis spp. and a boxfish (Lactoria diaphana), and a<br />
near disappearance of driftfish (Cubiceps spp.) from the diet. Evidence from predation rates suggests that<br />
biomasses of V. lucetia and D. gigas have increased in the first half of the 2000s and that the distribution<br />
of D. gigas apparently expanded offshore as well as poleward (see 3.2 Forage).<br />
The food-web representations that form the basis of ecosystem models are usually highly generalized, and<br />
do not account for variability in space and time. To gain insight into the role of the silky shark in the<br />
ecosystem, in 2014 an analysis of spatial variability was carried out, based on the stomach contents of 289<br />
silky sharks captured as bycatch in sets on floating objects, primarily drifting fish-aggregating devices<br />
(FADs), by the tuna purse-seine fishery of the EPO. The dataset is novel because biological data for openocean<br />
carcharhinid sharks are difficult to collect, and it includes data for silky sharks caught over a broad<br />
region of the tropical EPO. Results from classification tree and quantile regression methodologies suggest<br />
that the silky shark is an opportunistic predator that forages on a variety of prey. Broad-scale spatial and<br />
shark size covariates explained the feeding habits of the silky sharks. A strong spatial shift in diet was<br />
revealed, with different foraging patterns in the eastern (inshore) and western (offshore) regions. Greater<br />
proportions of FAD-associated prey than non-FAD-associated prey were observed in the diet throughout<br />
the EPO, but especially in the offshore region. Yellowfin tuna and silky sharks shared some of the same<br />
prey resources during these same two 2-year periods separated by a decade, e.g., Humboldt squid,<br />
flyingfishes, jacks and pompanos, and Tetraodontiformes. As was the case for yellowfin tuna, spatial and<br />
temporal factors likely both have a role in determining silky shark predation habits, but the samples were<br />
inadequate to test whether the diet of the sharks had changed over time. The analysis provided a<br />
comprehensive description of silky shark predation in the EPO, while demonstrating the need for<br />
increased sampling coverage over space and time, and presents important information on the dynamic<br />
component of trophic interactions of silky sharks. This information can be used to improve future<br />
ecosystem models.<br />
Predator-prey interactions for yellowfin, bigeye and albacore tunas, collected over a 40-year period from<br />
the Pacific, Indian and Atlantic Oceans, were used to quantitatively assess broad, macro-scale trophic<br />
patterns in pelagic ecosystems. Collation of these data, representing more than 10,000 predators, in a<br />
global database, was a critical first step, and underpinned analyses. A modified classification tree<br />
approach showed significant spatial differences and partitioning in the principal prey items consumed by<br />
all three tuna species, reflecting regional distributions of micronekton. Ommastrephid squids were one of<br />
the most important prey groups in all oceans across tuna species. Generalized additive models revealed<br />
that diet diversity was mainly driven by regional-scale processes and tuna length (59-81% Deviance<br />
Explained). In regions of low primary productivity the diet diversity of yellowfin tuna was more than<br />
double the diversity values in regions of high productivity. Ontogenetic and spatial patterns in diet<br />
diversity were found for bigeye tuna, with diet diversity of larger fish less related to primary production<br />
levels. Diet diversity of albacore tuna was globally higher than that of the other tunas and was uniformly<br />
high in all oceans except in the oligotrophic Mediterranean Sea. These results suggest that the current<br />
expansion of warmer, less productive waters in the world’s oceans may alter foraging opportunities of<br />
yellowfin tuna due to changes in the regional abundance of prey resources. Due to the larger depth range
136<br />
across which bigeye and albacore tunas forage, these species are less likely to be affected by changes in<br />
temperature and other environmental processes at the surface and within the mixed layer. Well-planned,<br />
long-term diet studies for large pelagic ecosystems are needed to test these preliminary hypotheses.<br />
Trophic-ecology studies have become focused on understanding entire food webs, initially by describing<br />
the inter-specific connections among the predator communities, comprising tunas, sharks, billfishes,<br />
dorado, wahoo, rainbow runner, and others. In general, considerable resource partitioning is evident<br />
among the components of these communities, and researchers seek to understand the spatial scale of the<br />
observable trophic patterns, and also the role of climate variability in influencing the patterns. In 2012, an<br />
analysis of predation by a suite of apex predators (including sharks, billfishes, tunas, and other fishes and<br />
mammals) on yellowfin and skipjack tunas in the EPO was published. Predation rates on yellowfin and<br />
skipjack were high for sharks and billfishes, and those animals consumed a wide size range of tunas,<br />
including subadults capable of making a notable contribution to the reproductive output of tuna<br />
populations. The tropical tunas in the EPO act as mesopredators more than apex predators.<br />
While diet studies have yielded many insights, stable isotope analysis is a useful complement to stomach<br />
contents for delineating the complex structure of marine food webs. Stomach contents represent a sample<br />
of only the most-recent several hours of feeding at the time of day an animal is captured, and under the<br />
conditions required for its capture. Stable carbon and nitrogen isotopes, however, integrate information on<br />
all components of the entire diet into the animal’s tissues, providing a recent history of trophic<br />
interactions and information on the structure and dynamics of ecological communities. More insight is<br />
provided by compound-specific isotope analysis of amino acids (AA-CSIA). In samples of consumer<br />
tissues, “source” amino acids (e.g. phenylalanine, glycine) retained the isotopic values at the base of the<br />
food web, and “trophic” amino acids (e.g. glutamic acid) became enriched in 15 N by about 7.6‰ relative to the<br />
baseline. In AA-CSIA, predator tissues alone are adequate for trophic-position estimates, and separate analysis<br />
of the isotopic composition of organisms at the base of the food web is not necessary. An analysis of the spatial<br />
distribution of stable isotope values of yellowfin tuna in relation to those of copepods showed that the trophic<br />
position of yellowfin tuna increased from inshore to offshore in the EPO, a characteristic of the food web never<br />
detected in diet data. This is likely a result of differences in food-chain length due to phytoplankton species<br />
composition (species with small cell size) in offshore oligotrophic waters versus larger diatom species in the<br />
more productive eastern waters.<br />
CSIA was recently utilized in the EPO and other regions through a research grant from the Comparative<br />
Analysis of Marine Ecosystem Organization (CAMEO) program, which is implemented as a partnership<br />
between the NMFS and the U.S. National Science Foundation, Division of Ocean Sciences. The research<br />
collaboration among the IATTC, the University of Hawaii, Scripps Institution of Oceanography, and the<br />
Oceanic Institute, Hawaii, seeks to develop amino acid compound-specific isotopic analysis as a tool that<br />
can provide an unbiased evaluation of trophic position for a wide variety of marine organisms and to use<br />
this information to validate output from trophic mass-balance ecosystem models. To accomplish this<br />
goal, the research combines laboratory experiments and field collections in contrasting ecosystems that<br />
have important fisheries. The field component was undertaken in varying biogeochemical environments,<br />
including the equatorial EPO, to examine trophic position of a range of individual species, from<br />
macrozooplankton to large fishes, and to compare trophic position estimates derived from AA-CSIA for<br />
these species with ecosystem model output. The project began in 2010 and was extended into 2014.<br />
Most of the samples for the EPO portion of the study were collected and stored frozen by personnel of the<br />
NMFS, Protected Resources Division, Southwest Fisheries Science Center (SWFSC), aboard the research<br />
vessels David Starr Jordan and McArthur II during the Stenella Abundance Research Project (STAR) in<br />
2006. The samples for the study nearly span the food web in the EPO, and all were taken along an east-tosouthwest<br />
transect that appeared to span a productivity gradient. The components include macroplankton<br />
(two euphausiid crustaceans, Euphausia distinguenda and E. tenera), mesopelagic-micronekton (two<br />
myctophid fishes, Myctophum nitidulum and Symbolophorus reversus), cephalopods (two species of<br />
pelagic squids, Dosidicus gigas and Sthenoteuthis oualaniensis), and small and large micronektonivores
137<br />
and nektonivores (skipjack, yellowfin, and bigeye tunas collected aboard commercial purse-seine vessels<br />
fishing in the EPO during 2003-2005).<br />
Stable isotope analyses of bulk tissues and amino acids were conducted on several specimens each of the<br />
species listed above. Bulk δ 15 N values varied markedly across the longitude and latitude gradients. There<br />
were no distinct longitudinal trends, but the δ 15 N values increased consistently with increasing latitude.<br />
Trophic position estimates based on the amino-acid δ 15 N values, however, varied little intra-specifically<br />
across the sample transect. These two results suggest that the isotopic variability in the food web was<br />
likely due to biogeochemical variability at the base of the food web rather than differences in diets within<br />
the food web. Increasing δ 15 N values with latitude correspond to high rates of denitrification associated<br />
with the large oxygen minimum zone in the ETP. Among-species comparisons of absolute trophic<br />
positions based on AA-CSIA estimates with estimates based on diet from the EPO ecosystem model<br />
(IATTC Bulletin, Vol. 22, No. 3) showed underestimates for the predators occupying higher trophic<br />
levels, i.e. the three tunas and two squids. These underestimates are likely because the previouslyaccepted<br />
trophic enrichment factor of 7.6 ‰ for phenylalanine and glutamic acid, which was derived<br />
from laboratory experiments with primary producers and invertebrate consumers, is inadequate for<br />
higher-level predators. A Master of Science thesis was developed from this work, and a manuscript has<br />
been provisionally accepted for publication in 2016 6 .<br />
Previous studies suggest that differences in δ 15 N values of source and trophic amino acids can be used to<br />
examine historical changes in the trophic positions of archived samples, to investigate, for example, the<br />
potential effects of fisheries removals on system trophic dynamics. Where historical diet data are lacking<br />
or absent, AA-CSIA of archived specimens may be the only way to determine the past trophic status of<br />
key predator and prey species. Given the importance of retrospective ecosystem analyses, capabilities are<br />
being developed for conducting these analyses by thoroughly examining the possible artifacts of sample<br />
preservation methods on subsamples of key species. In this two-year study, muscle samples from 3<br />
yellowfin tuna and 3 Humboldt squid were collected, fixed in formalin, and stored long-term in ethanol.<br />
Paired samples were frozen for two years to compare with the preserved samples. The duration of<br />
preservation and freezing ranged from 1 week to 2 years, and all preserved samples showed a uniform<br />
increase in bulk δ 15 N values. δ 15 N values of several amino acids (threonine, phenylalanine, and valine)<br />
were significantly different between preserved and frozen samples. A follow-up experiment is underway<br />
to evaluate whether alteration of δ 15 N values was caused by formalin fixation or ethanol preservation.<br />
These data suggest that caution and further investigation be used for future studies that aim to conduct<br />
AA-CSIA on formalin-ethanol preserved tissues.<br />
In early 2016, a proposal by a task team of CLIOTOP WG3 members was accepted by the CLIOTOP<br />
Scientific Steering Committee. This work will be a companion paper to the global tuna diet analysis<br />
described above. The task team represents an international collaborative effort to move from regional<br />
trophic studies of top marine predators to a global comparative study of oceanic food webs using stable<br />
isotope compositions of the same three tuna species featured in the diet paper: yellowfin, bigeye, and<br />
albacore tunas. The team will assess isotopic differences among oceans, regions, and tuna species.<br />
Predictive models will be used to undertake an inter-ocean comparison of a proxy for trophic position<br />
based on stable isotope values. The proxy is based on δ 15 N values of the tunas minus known regional<br />
differences in baseline δ 15 N values derived from a coupled ocean circulation-biogeochemical-isotope<br />
model. A similar approach will be taken with lipid-corrected δ 13 C values to examine regional differences<br />
in carbon-based primary production origins. Environmental variables (SST, Chl-a, net primary<br />
productivity, and mixed layer depth) will be included to explore the influence of global oceanographic<br />
6<br />
Hetherington, E.D., R.J. Olson, J.C. Drazen, C.E. Lennert-Cody, L.T. Ballance, R.S. Kaufmann, and B.N. Popp.<br />
In revision. Spatial variability in food web structure in the eastern tropical Pacific Ocean using compound-specific<br />
nitrogen isotope analysis of amino acids. Limnology and Oceanography.
138<br />
processes on the isotopic compositions of the tuna species and food-chain length.<br />
5. PHYSICAL <strong>EN</strong>VIRONM<strong>EN</strong>T 7<br />
Environmental conditions affect marine ecosystems, the dynamics and catchability of tunas and billfishes,<br />
and the activities of fishermen. Tunas and billfishes are pelagic during all stages of their lives, and the<br />
physical factors that affect the tropical and sub-tropical Pacific Ocean can have important effects on their<br />
distribution and abundance. Environmental conditions are thought to cause considerable variability in the<br />
recruitment of tunas and billfishes. Stock assessments by the IATTC have often incorporated the<br />
assumption that oceanographic conditions might influence recruitment in the EPO.<br />
Different types of climate perturbations may impact fisheries differently. It is thought that a shallow<br />
thermocline in the EPO contributes to the success of purse-seine fishing for tunas, perhaps by acting as a<br />
thermal barrier to schools of small tunas, keeping them near the sea surface. When the thermocline is<br />
deep, as during an El Niño event, tunas seem to be less vulnerable to capture, and the catch rates have<br />
declined. Warmer- or cooler-than-average sea-surface temperatures (SSTs) can also cause these mobile<br />
fishes to move to more favorable habitats.<br />
The ocean environment varies on a variety of time scales, from seasonal to inter-annual, decadal, and<br />
longer (e.g. climate phases or regimes). The dominant source of variability in the upper layers of the EPO<br />
is known as the El Niño-Southern Oscillation (<strong>EN</strong>SO). The <strong>EN</strong>SO is an irregular fluctuation involving<br />
the entire tropical Pacific Ocean and global atmosphere. It results in variations of the winds, rainfall,<br />
thermocline depth, circulation, biological productivity, and the feeding and reproduction of fishes, birds,<br />
and marine mammals. El Niño events occur at 2- to 7-year intervals, and are characterized by weaker<br />
trade winds, deeper thermoclines, and abnormally-high SSTs in the equatorial EPO. El Niño’s opposite<br />
phase, often called La Niña (or anti-El Niño), is characterized by stronger trade winds, shallower<br />
thermoclines, and lower SSTs. Research has documented a connection between the <strong>EN</strong>SO and the rate of<br />
primary production, phytoplankton biomass, and phytoplankton species composition. Upwelling of<br />
nutrient-rich subsurface water is reduced during El Niño episodes, leading to a marked reduction in<br />
primary and secondary production. <strong>EN</strong>SO also directly affects animals at middle and upper trophic levels.<br />
Researchers have concluded that the 1982-1983 El Niño event, for example, deepened the thermocline<br />
and nutricline, decreased primary production, reduced zooplankton abundance, and ultimately reduced<br />
the growth rates, reproductive successes, and survival of various birds, mammals, and fishes in the<br />
EPO. In general, however, the ocean inhabitants recover within short periods because their life histories<br />
are adapted to respond to a variable habitat.<br />
The IATTC staff issues quarterly reports of the monthly average oceanographic and meteorological data<br />
for the EPO, including a summary of current <strong>EN</strong>SO conditions. The SSTs had been mostly below normal<br />
from October 2013 through March 2014, but during April 2014 through September 2015 they were<br />
virtually all above normal. By January 2015 the area of warm water off Mexico had expanded to the<br />
southwest, combining with an area of warm water along the equator that persisted through June. During<br />
the third quarter, the areas of warm water off Baja California and along the equator grew larger and<br />
warmer. During the fourth quarter, the SSTs were above normal over much of the area north of 10°S, and<br />
off Peru, but nearly normal over most of the rest of the area south of the equator. According to the<br />
Climate Diagnostics Bulletin of the U.S. National Weather Service for December 2015, “Most models<br />
indicate that a strong El Niño will weaken with a transition to…neutral [conditions] during the late spring<br />
or early summer…The forecasters are in agreement with the model consensus, though the exact timing of<br />
the transition is difficult to predict.”<br />
Variability on a decadal scale (i.e. 10 to 30 years) also affects the EPO. During the late 1970s there was a<br />
major shift in physical and biological states in the North Pacific Ocean. This climate shift was also<br />
7 Some of the information in this section is from Fiedler, P.C. 2002. Environmental change in the eastern tropical<br />
Pacific Ocean: review of <strong>EN</strong>SO and decadal variability. Mar. Ecol. Prog. Ser. 244: 265-283.
139<br />
detected in the tropical EPO by small increases in SSTs, weakening of the trade winds, and a moderate<br />
change in surface chlorophyll levels. Some researchers have reported another major shift in the North<br />
Pacific in 1989. Climate-induced variability in the ocean has often been described in terms of “regimes,”<br />
characterized by relatively stable means and patterns in the physical and biological variables. Analyses by<br />
the IATTC staff have indicated that yellowfin tuna in the EPO have experienced regimes of lower (1975-<br />
1982) and higher (1983-2001) recruitment, and possibly intermediate (2002-2012) recruitment. The<br />
recruitments for 2013 and 2014 have been estimated to be above average, but there is high uncertainty in<br />
the estimated values.The increased recruitment during 1983-2001 is thought to be due to a shift to a<br />
higher productivity regime in the Pacific Ocean. Decadal fluctuations in upwelling and water transport are<br />
simultaneous to the higher-frequency <strong>EN</strong>SO pattern, and have basin-wide effects on the SSTs and<br />
thermocline slope that are similar to those caused by <strong>EN</strong>SO, but on longer time scales.<br />
Recent peer-reviewed literature provides strong evidence that large-scale changes in biological production<br />
and habitat have resulted from physical forcing in the subtropical and tropical Pacific Ocean. These<br />
changes are thought to be capable of affecting prey communities. Primary production has declined over<br />
vast oceanic regions in the recent decade(s). A study published in 2008, using “Sea-viewing Wide Fieldof-view<br />
Sensor” (SeaWiFS) remote-sensed ocean color data, showed that, in the North and South Pacific,<br />
the most oligotrophic surface waters have increased in area by 2.2 and 1.4 % per year, respectively,<br />
between 1998 and 2006. These statistically-significant increases in the oligotrophic gyres occurred<br />
concurrently with significant increases in mean SSTs. In the North Pacific, the direction of expansion<br />
was northeast, reaching well into the eastern Pacific to about 120°W and as far south as about 15°N. Net<br />
primary productivity also has declined in the tropical and subtropical oceans since 1999. The mechanism<br />
is recognized as increased upper-ocean temperature and vertical stratification, influencing the availability<br />
of nutrients for phytoplankton growth. Evidence is also strong that primary producers have changed in<br />
community composition and size structure in recent decades. Phytoplankton cell size is relevant to<br />
predation dynamics of tunas because food webs that have small picophytoplankton at their base require<br />
more trophic steps to reach predators of a given size than do food webs that begin with larger<br />
nanophytoplankton (e.g. diatoms). Energy transfer efficiency is lower for picophytoplankton-based food<br />
webs than for nanophytoplankton-based food webs, i.e. for a given amount of primary production less<br />
energy will reach a yellowfin of a given size in the former than in the latter because mean annual trophic<br />
transfer efficiency at each step is relatively constant. A study published in 2012 used satellite remotelysensed<br />
SSTs and chlorophyll-a concentrations to estimate the monthly size composition of phytoplankton<br />
communities during 1998-2007. With the seasonal component removed, the median phytoplankton cell<br />
size estimated for the subtropical 10°-30°N and 10°-30°S Pacific declined by 2.2% and 2.3%,<br />
respectively, over the 9-year period. Expansion of the oxygen minimum zone (OMZ) is a third factor that<br />
demonstrates ecosystem change on a scale capable of affecting prey communities. The OMZ is a thick<br />
low-oxygen layer at intermediate depths, which is largely suboxic (
140<br />
recent years. Numerous objectives have been proposed to evaluate fishery impacts on ecosystems and to<br />
define over-fishing from an ecosystem perspective. Whereas reference points have been used primarily<br />
for single-species management of target species, applying performance measures and reference points to<br />
non-target species is believed to be a tractable first step. Current examples include incidental mortality<br />
limits for dolphins in the EPO purse-seine fishery under the AIDCP. Another area of interest is whether<br />
useful performance indicators based on ecosystem-level properties might be developed. Several<br />
ecosystem metrics or indicators, including community size structure, diversity indices, species richness<br />
and evenness, overlap indices, trophic spectra of catches, relative abundance of an indicator species or<br />
group, and numerous environmental indicators, have been proposed. Whereas there is general agreement<br />
that multiple system-level indicators should be used, there is concern over whether there is sufficient<br />
practical knowledge of the dynamics of such metrics and whether a theoretical basis for identifying<br />
precautionary or limit reference points based on ecosystem properties exists. Ecosystem-level metrics are<br />
not yet commonly used for managing fisheries.<br />
Ecological Metrics. Relationships between indices of species associations in the catch and environmental<br />
characteristics are viewed as potentially valuable information for bycatch mitigation. Preliminary work in<br />
2007-2008, based on novel methods of ordination developed by scientists at the Institute of Statistical<br />
Mathematics in Tokyo, Japan, showed clear large-scale spatial patterns in different groupings of target<br />
and bycatch species for floating-object sets in the EPO purse-seine fishery and relationships to<br />
environmental variables, such as SST, chlorophyll-a density, and mixed layer depth. More work is<br />
needed on this or similar approaches.<br />
A variety of ecological metrics were employed in a study published in 2012 8 to evaluate the ecological<br />
effects of purse-seine fishing in the EPO during 1993-2008. Comparisons of the catch of target and nontarget<br />
(bycatch) species, both retained and discarded, by types of purse-seine sets (on dolphins, floating<br />
objects, and unassociated tunas) were made on the basis of replacement time, diversity, biomass (weight),<br />
number of individuals, and trophic level. Previous comparisons considered only numbers of individuals<br />
and only discarded animals, without regard to body size, life-history characteristics, or position in the<br />
food web. During 1993-2008, the mean biomass removed was 17.0, 41.1 and 12.8 t/set for dolphin sets,<br />
floating-object sets, and unassociated sets, respectively. Of these amounts, bycatch was 0.3% for dolphin<br />
sets, 3.8% for floating-object sets, 1.4% for unassociated sets, and 2.1% for all methods combined. The<br />
discard rate was 0.7% for dolphin sets, 10.5% for floating-object sets, 2.2% for unassociated sets, and<br />
5.4% for all methods combined. With the addition of 0.7% estimated for smaller vessels, the overall<br />
discard rate was 4.8%. This rate is low compared with global estimates of 7.5% for tuna longlines, 30.0%<br />
for tuna mid-water trawls, and 8.0% for all fisheries combined.<br />
Replacement time is a measure of the length of time required for replacement of biomass removed by the<br />
fishery. Unsustainable levels of harvest may lead to greater decreases in probabilities of persistence of<br />
long-lived animals with low fecundity and late age of maturity than of fast-growing, highly fecund<br />
species. In contrast to trophic-level metrics, replacement-time metrics were sensitive to categories of<br />
animals with relatively high biomass to production-of-biomass (B/P) ratios, such as bigeye tunas, sharks,<br />
and cetaceans. Mean replacement time for total removals averaged over years was lowest for dolphin sets<br />
(mean 0.48 years), intermediate for unassociated sets (0.57 years), and highest for floating-object sets<br />
(0.74 years). There were no temporal trends in mean replacement time for landings, and mean<br />
replacement times for discards were more variable than those for landings. Mean replacement times for<br />
dolphin-set discards were approximately 7 times the mean replacement times for floating-object or<br />
unassociated-set discards because dolphins have a low reproductive rate.<br />
Diversity. Fishing alters diversity by selectively removing target species. The relationship between<br />
8 Gerrodette, T., R. Olson, S. Reilly, G. Watters, and W. Perrin. 2012. Ecological metrics of biomass removed by<br />
three methods of purse-seine fishing for tunas in the eastern tropical Pacific Ocean. Conservation Biology. 26 (2):<br />
248-256
141<br />
diversity of species removed and effects on the diversity and stability of the ecosystem from which they<br />
were removed may be complex. Higher diversity of catch may be associated with fewer undesirable<br />
effects on the ecosystem, although the complexity of competitive and trophic interactions among species<br />
makes the relationship between diversity of catch and diversity and stability of the ecosystem difficult to<br />
determine. The Shannon diversity index for total removals was lowest for dolphin sets (mean 0.62),<br />
intermediate for unassociated sets (1.22), and highest for floating-object sets (1.38). The diversity of<br />
dolphin-set landings increased by 0.023/year, on average, from 0.45 to 0.79, due primarily to an increase<br />
of the percentage of skipjack tuna in the catch from 7% and a concurrent decrease in the<br />
percentage of yellowfin tuna. The diversity of unassociated-set landings and discards both decreased, and<br />
diversity of total removals decreased by a mean of 0.024/year, from 1.40 to 1.04.<br />
Biomass. The relative amounts and characteristics of the biomass removed by each of the fishing methods<br />
varied as a function of how removal was measured. Landings from floating-object sets were greatest by<br />
all four measures of removal, but were particularly high when removal was measured on the basis of<br />
number of individuals or replacement time. The amount and composition of discards varied among the<br />
fishing methods. Discards of the target tuna species were the greatest proportion of removed animals<br />
whether measured in biomass, number of individuals, or trophic-level units. Discards of cetaceans in<br />
dolphin sets and sharks in floating-object and unassociated sets were greater when measured in<br />
replacement-time units than when measured in other units because of the low reproductive rates of these<br />
animals.<br />
Trophic structure and trophic levels of catches. Ecologically-based approaches to fisheries<br />
management place renewed emphasis on achieving accurate depictions of trophic links and biomass flows<br />
through the food web in exploited systems. The structure of the food web and the interactions among its<br />
components have a demonstrable role in determining the dynamics and productivity of ecosystems.<br />
Trophic levels (TLs) are used in food-web ecology to characterize the functional role of organisms, to<br />
facilitate estimates of energy or mass flow through communities, and for elucidating trophodynamics<br />
aspects of ecosystem functioning. A simplified food-web diagram, with approximate TLs, of the pelagic<br />
tropical EPO, is shown in Figure L-1. Toothed whales (Odontoceti, average TL 5.2), large squid predators<br />
(large bigeye tuna and swordfish, average TL 5.2), and sharks (average TL 5.0) are top-level predators.<br />
Other tunas, large piscivores, dolphins (average TL 4.8), and seabirds (average TL 4.5) occupy slightly<br />
lower TLs. Smaller epipelagic fishes (e.g. Auxis spp. and flyingfishes, average TL 3.2), cephalopods<br />
(average TL 4.4), and mesopelagic fishes (average TL 3.4) are the principal forage of many of the upperlevel<br />
predators in the ecosystem. Small fishes and crustaceans prey on two zooplankton groups, and the<br />
herbivorous micro-zooplankton (TL 2) feed on the producers, phytoplankton and bacteria (TL 1).<br />
In exploited pelagic ecosystems, fisheries that target large piscivorous fishes act as the system’s apex<br />
predators. Over time, fishing can cause the overall size composition of the catch to decrease, and, in<br />
general, the TLs of smaller organisms are lower than those of larger organisms. The mean TL of the<br />
organisms taken by a fishery is a useful metric of ecosystem change and sustainability because it<br />
integrates an array of biological information about the components of the system. There has been<br />
increasing attention to analyzing the mean TL of fisheries catches since a study demonstrated that,<br />
according to FAO landings statistics, the mean TL of the fishes and invertebrates landed globally had<br />
declined between 1950 and 1994, which was hypothesized by the authors of that study to be detrimental<br />
to the ecosystems. Some ecosystems, however, have changed in the other direction, from lower to higher<br />
TL communities. Given the potential utility of this approach, mean TLs were estimated for a time series<br />
of annual catches and discards by species from 1993 to 2014 for three purse-seine fishing modes and the<br />
pole-and-line fishery in the EPO. The estimates were made by applying the TL values from the EPO<br />
ecosystem model (see Section 8), weighted by the catch data by fishery and year for all model groups<br />
from the IATTC tuna, bycatch, and discard data bases. The TLs from the ecosystem model were based on<br />
diet data for all species groups and mass balance among groups. The weighted mean TLs of the summed<br />
catches of all purse-seine and pole-and-line fisheries were similar and fairly constant from year to year
142<br />
(Figure L-2: Average PS+LP). A slight downward trend for the unassociated sets, amounting to 0.05 TL<br />
over the 21-year period, resulted from increasing proportions of skipjack and decreasing proportions of<br />
yellowfin tuna in the catch, not from increasing catches of low trophic-level species. It is not, therefore,<br />
considered an ecologically-detrimental decline. In general, the TLs of the unassociated sets and the poleand-line<br />
fishery were below average and those of the dolphin sets were above average for most years<br />
(Figure L-2). The TLs of the floating-object sets varied more than those of the other set types and<br />
fisheries, primarily due to the inter-annual variability in the amounts of bigeye and skipjack caught in<br />
those sets. The TLs of floating-object sets were positively related to the percentage of the total catch<br />
comprised of large bigeye and negatively related to the percentage of the catch comprised of skipjack.<br />
Mean TLs were also estimated separately for the time series of retained and discarded catches of the<br />
purse-seine fishery each year from 1993 to 2014 (Figure L-3). The discarded catches were much less than<br />
the retained catches, and thus the TL patterns of the total (retained plus discarded) catches (Figure L-2)<br />
were determined primarily by the TLs of the retained catches (Figure L-3). The TLs of the discarded<br />
catches varied more year-to-year than those of the retained catches, due to the species diversity of the<br />
incidental catches. The considerable reduction in the mean TLs of the dolphin-set discards over the 21-<br />
year period (Figure L-3) was largely due to an increase in the proportions of discarded prey fishes (bullet<br />
and frigate tunas (Auxis spp.) and miscellaneous epipelagic fishes) and rays (Rajiformes, mostly manta<br />
rays, Mobulidae) with lower trophic levels. In 2014, the mean TLs of dolphin-set discards increased by<br />
about 0.2 TLs from those in 2013 primarily due to an increase in the proportions of discarded<br />
mesopelagic (TL 4.65) and spotted (TL 5.03) dolphins and a decrease in the proportions of discarded<br />
rays. For unassociated sets, marked inter-annual reductions in TL were due to increased bycatches of rays<br />
(TL 3.68), which feed on plankton and other small animals that occupy low TLs, a reduction in the<br />
catches of large sharks (TL 4.93-5.23), and an increase in prey fishes such as Auxis spp. (TL 3.86) in the<br />
bycatch. In 2014, the mean TLs of unassociated-set discards also increased by about 0.2 TLs from those<br />
in 2013, mostly due to an incease in the proportion of skipjack and a decrease in the proportion of<br />
discarded bullet and frigate tunas. For floating-object sets, the discards of bigeye were related to higher<br />
mean TLs of the discarded catches.<br />
7. ECOLOGICAL RISK ASSESSM<strong>EN</strong>T<br />
Long-term ecological sustainability is a requirement of ecosystem-based fisheries management. Fishing<br />
directly impacts the populations of not only target species, but also the species incidentally caught as<br />
bycatch. The vulnerability to overfishing of many of the stocks incidentally caught in the EPO tuna<br />
fisheries is unknown, and biological and fisheries data are severely limited for most of those stocks. Many<br />
fisheries managers and scientists are turning to risk assessments to evaluate vulnerability to fishing.<br />
Vulnerability is defined here as the potential for the productivity of a stock to be diminished by direct and<br />
indirect fishing pressure. The IATTC staff has applied a version of productivity and susceptibility<br />
analysis (PSA 9 ), used to evaluate fisheries in other ocean regions in recent years, to estimate the<br />
vulnerability of data-poor, non-target species caught by the purse-seine fishery in the EPO. PSA<br />
considers a stock’s vulnerability as a combination of its productivity and its susceptibility to the fishery.<br />
Stock productivity is the capacity of a stock to recover if it is depleted, and is a function of the species’<br />
life history traits. Stock susceptibility is the degree to which a fishery can negatively impact a stock, i.e.<br />
the propensity of a species to be captured by, and incur mortality from, a fishery. Productivity and<br />
susceptibility indices of a stock are determined by deriving a score ranging from 1 (low) to 3 (high) for a<br />
standardized set of attributes related to each index. The individual attribute scores are then averaged for<br />
each factor and graphically displayed on an x-y scatter plot. The scale of the x-axis on the scatter plot is<br />
reversed because species/stocks with a high productivity score and a low susceptibility score (i.e. at the<br />
9 Patrick, W.S., P. Spencer, J. Link, J. Cope, J. Field, D. Kobayashi, P. Lawson, T. Gedamke, E. Cortés, O. Ormseth,<br />
K. Bigelow, and W. Overholtz. 2010. Using productivity and susceptibility indices to assess the vulnerability of<br />
United States fish stocks to overfishing. Fish. Bull. U.S. 108: 305-322.
143<br />
origin of the plots) are considered to be the least vulnerable. When scoring the attributes, the data quality<br />
associated with each attribute score is assessed, and the attributes are weighted by the data-quality score.<br />
Stocks that receive a low productivity score (p) and high susceptibility score (s) are considered to be at a<br />
high risk of becoming depleted, while stocks with a high productivity score and low susceptibility score<br />
are considered to be at low risk. Vulnerability scores (v) are calculated from the p and s scores as the<br />
Euclidean distance from the origin of the x-y scatter plot and the datum point:<br />
To examine the utility of productivity and susceptibility indices for assessing the vulnerability of<br />
incidentally-caught fishes, mammals, and turtles to overfishing in the EPO, a preliminary evaluation of<br />
three purse-seine “fisheries” in the EPO was made in 2010, using 26 species that comprise the majority of<br />
the biomass removed by Class-6 purse-seine vessels (carrying capacity greater than 363 metric tons)<br />
during 2005-2009. Nine productivity and eight susceptibility attributes, based on established PSA<br />
methodology 4 , were used in the preliminary PSA, and some were modified for greater consistency with<br />
data from the tuna fisheries in the EPO. Information corresponding to the productivity attributes for each<br />
species was compiled from a variety of published and unpublished sources and EPO fisheries data (i.e.<br />
not adopted from previous PSAs) to better approximate the distribution of life history characteristics<br />
observed in the species found in the EPO. Scoring thresholds for productivity attributes were derived by<br />
dividing the compiled data into equal thirds. Scoring criteria for the susceptibility attributes were taken<br />
from the example PSA 4 and modified where appropriate to better fit the EPO fisheries. However,<br />
problems arose when trying to compare susceptibility estimates for species across the different fisheries<br />
(Fishery Status Report 8). In 2012, the PSA was revised to include seven additional species, based on<br />
data from 2005-2011 (Fishery Status Report 10).<br />
The staff of the Biology and Ecosystem Program had planned to finalize and publish the PSA analysis<br />
during 2014, but the retirement of one staff member and budget constraints have prevented the work from<br />
being finished. In 2015 a vacancy announcement for an Ecosystem Specialist was posted. The selected<br />
appointee, a senior scientist and recognized expert in developing ERAs, will join the IATTC staff in<br />
August of 2016. He will lead the ERA effort for the EPO. Substantial progress on this work will be made<br />
during the latter half of 2016 and a report on the advancement will be available at the 2017 SAC meeting.<br />
Meanwhile, in response to requests made by SAC participants at the 2015 meeting, an effort was made<br />
by the IATTC staff to describe available catch data for the purposes of including gear types in addition<br />
to large purse seiners, in an ERA (described in SAC-07-INF C(d)). This effort will assist the new<br />
appointee in choosing the appropriate type of ERA for the EPO fisheries. Here we review the<br />
modifications made to the PSA presented at the 2015 SAC meeting.<br />
Three modifications of the analysis were made to the PSA for the SAC meeting in May 2015: 1) the<br />
procedures for determining which species to include in the analysis were modified; 2) the susceptibility<br />
values for each fishery were combined to produce one overall susceptibility value for each species; and 3)<br />
the use of bycatch and catch information in the formulation of s was modified. The list of productivity<br />
attributes remains unchanged (Table L-1) while the list of susceptibility attributes has been revised due to<br />
this 3 rd modification (Table L-2). These three modifications are described briefly below. For the<br />
remainder of this section, the term “catch” will be used to refer to bycatch for non-tuna species and catch<br />
for tuna species.<br />
The first modification was to establish a two-step procedure to identify and exclude rare species, based on<br />
the biomass caught per fishery. However, as a precautionary measure, rare species classified as<br />
“vulnerable,” “endangered,” or “near threatened” on the IUCN Red List were retained, or are now<br />
included, in the analysis. Currently, the PSA includes 32 species (Table L-3a); an additional eight<br />
sensitive species, two rays and six sharks, will be included in the future.<br />
The second modification was to combine the susceptibility values for each species across fisheries to
R<br />
144<br />
produce one overall species-specific purse-seine susceptibility. A preliminary combined susceptibility<br />
score for a species, s j 1 , was calculated as the weighted sum of the individual fishery susceptibility values<br />
for that species (Table L-3a), with weights equal to the proportion of sets in each fishery:<br />
where<br />
s j<br />
1<br />
is the combined susceptibility for species j<br />
s j 1 = s jj p k<br />
k<br />
s jk is the susceptibility for species j in set type k, computed using only the attributes in Table L-2. s jk<br />
ranges from 1 (lowest) to 3 (highest). For a species with catches < 5% in set type k, s jk ≡ 1, unless a s jk<br />
was computed for one of the previous PSAs (Fishery Status Reports 8 and 10), in which case this s jk was<br />
used; otherwise it was assumed that if catches were less than 5% in a fishery, the species was only<br />
minimally susceptible to that fishery. A previous PSA (Fishery Status Report 10) used catch trend<br />
information as an additional attribute to calculate the s jk , however, the catch trend information was<br />
removed from the s jk here because, following the established PSA 4 methodology, the other susceptibility<br />
attributes are time-invariant (but see below).<br />
p k = N k<br />
and N<br />
∑ k N k is the total number of sets (class-6) of set type k in 2013<br />
k<br />
1<br />
s j takes into account fishing effort by set type, even for set types with little or no catch of a species. A<br />
1 1<br />
preliminary PSA plot using s j is shown in Figure L-4a, and the values of s jk , s j and v 1 are shown<br />
in Table L-3a. A concern with regard to s 1 j for some species is that the variation in the s jk computed from<br />
the attributes in Table L-2 does not correlate well with differences observed among catch rates by set<br />
type, suggesting the attributes in Table L-2 do not capture the full susceptibility of species j; in general it<br />
is assumed that higher catch rates should reflect higher overall susceptibility. In addition, the s jk do not<br />
account for long-term trends.<br />
The third modification, the use of catch information in the formulation of s, was made to try to account<br />
for differences in observed catch rates among set types, by species, and to account for long-term trends in<br />
abundance. Two preliminary alternate susceptibility formulations were computed as “proof of concept”<br />
for these ideas. The first, s 2 1<br />
j , modifies s j to take into consideration current catch rates, which are<br />
assumed to be an alternate proxy for susceptibility and to reflect the actual integrated effects of the<br />
susceptibility attributes in Table L-2:<br />
where<br />
s 2 j = s ∗ jj p k<br />
s j<br />
2<br />
is the combined susceptibility for species j, adjusted for recent catch rates<br />
s ∗<br />
jj<br />
is the average of s jk and of the catch rate susceptibility: s ∗<br />
jj<br />
s jk is as defined for s j<br />
1<br />
k<br />
= 1 2 s jj + s ccc_jj <br />
s ccs_jj is the catch rate susceptibility and takes a value of 1, 2 or 3, assigned as follows. If the species is<br />
not a target tuna species, catch-per set, in number of animals per set, is used to assign a value to s ccc_jj :<br />
1 for cps jk = 0<br />
2 for 0 < cps jj < 1.0<br />
3 for cps jj ≥ 1.0<br />
If the species is a target tuna species, then the following values are assigned to s ccc_jj :
145<br />
Dolphin sets Unassociated sets Floating-object sets<br />
Bigeye 1 2 3<br />
Yellowfin 3 3 3<br />
Skipjack 2 3 3<br />
cps _jk is the catch-per-set for species j in set type k (= class-6 catch (in numbers of animals) divided by<br />
number of class-6 sets), for the most recent year (2013). Catch-per-set was used instead of total catch in<br />
order to control for differences in effort among set types.<br />
p k is as defined for s j<br />
1<br />
A preliminary PSA plot using s 2 j is shown in Figure L-4b and the values of s ∗ jj , s 2 j and v 2 are shown<br />
in Table L-3b. s 2 j could be affected by differences in abundance among species because catch-per-set is<br />
affected by abundance. Ranking cps jk may help to minimize this problem. The present rules for ranking<br />
cps jk for non-target tuna species were based on the idea that no catch equates to minimal susceptibility,<br />
catch that increases at a rate of less than one animal per set equates to moderate susceptibility, and catch<br />
that increases at an effort rate of one or more animals per set equates to high susceptibility. However,<br />
these rules are a “proof of concept” and could be modified.<br />
The second alternate susceptibility formulation, computed for species other than target tunas and<br />
dolphins, s j 3 , adjusts for long-term trends:<br />
where<br />
s 3 j = s ∗∗ jj p k<br />
s j<br />
3<br />
is the combined susceptibility for species j, adjusted for long-term trends<br />
∗∗<br />
s jj is the average of s jk and the trend susceptibility: s ∗∗ jj = 1 s 2<br />
jj + s ttttt_jj ;<br />
s jk is as defined for s j<br />
1<br />
S trend_jk is the trend susceptibility for species j in set type k, obtained as follows:<br />
1.0 if species j does not occur in set type k<br />
1.5 if ttttt jj is not significant or is significant but increasing<br />
3.0 if ttttt jj is significant and decreasing<br />
k<br />
trend jk is the slope of the regression of cps jk,y and year y, from the start of the data collection (which may<br />
vary by species). trend jk was computed for species for which full assessments (or management indicators)<br />
do not exist and for which the fishery data have not been determined to be unsuitable for trend estimation;<br />
i.e., for species other than the three target tuna species and the dolphin species (but see below) . A<br />
significant trend was any slope with a p-value < 0.05.<br />
cps ,jk,y is the catch-per-set of species j of set type k in year y<br />
A preliminary PSA plot using s 3 j for species other than the three target tuna species and dolphin species is<br />
∗∗ 3 3<br />
shown in Figure L-4c, and the values of s jj , s j and v 3 are shown in Table L-3c. For the future, s j could<br />
be expanded to include the three target tuna species by estimating trends from spawning biomass, and<br />
could be expanded to dolphin species by using trends estimated from historical line-transect abundance<br />
3<br />
estimates. A concern with regards to s j is that trends estimated from catch-per-set may not reliably track<br />
changes in abundance (as was shown for dolphins in Document SAC-05-11d).<br />
The three susceptibility measures, s j 1 , s j 2 , and s j 3 , are considered preliminary and represent “proof of<br />
concept” ideas to illustrate several options for computing susceptibility tailored to the EPO purse-seine
146<br />
fishery. These measures along with the available catch data for non-target species by gear type will be<br />
reviewed with the new Ecosystem Specialist in August 2016. This work will help to facilitate future<br />
improvements to the existing PSA in the EPO and/or assist in the development of a new ERA.<br />
8. ECOSYSTEM MODELING<br />
It is clear that the different components of an ecosystem interact. Ecosystem-based fisheries management<br />
is facilitated through the development of multi-species ecosystem models that represent ecological<br />
interactions among species or guilds. Our understanding of the complex maze of connections in openocean<br />
ecosystems is at an early stage, and, consequently, the current ecosystem models are most useful as<br />
descriptive devices for exploring the effects of a mix of hypotheses and established connections among<br />
the ecosystem components. Ecosystem models must be compromises between simplistic representations<br />
on the one hand and unmanageable complexity on the other.<br />
The IATTC staff has developed a model of the pelagic ecosystem in the tropical EPO (IATTC<br />
Bulletin, Vol. 22, No. 3) to explore how fishing and climate variation might affect the animals at middle<br />
and upper trophic levels. The ecosystem model has 38 components, including the principal exploited<br />
species (e.g. tunas), functional groups (e.g. sharks and flyingfishes), and sensitive species (e.g. sea<br />
turtles). Some taxa are further separated into size categories (e.g. large and small marlins). The model has<br />
finer taxonomic resolution at the upper trophic levels, but most of the system’s biomass is contained in<br />
the middle and lower trophic levels. Fisheries landings and discards were estimated for five fishing<br />
“gears”: pole-and-line, longline, and purse-seine sets on tunas associated with dolphins, with floating<br />
objects, and in unassociated schools. The model focuses on the pelagic regions; localized, coastal<br />
ecosystems are not adequately described by the model.<br />
Most of the information describing inter-specific interactions in the model came from a joint IATTC-<br />
NMFS project, which included studies of the food habits of co-occurring yellowfin, skipjack, and bigeye<br />
tuna, dolphins, pelagic sharks, billfishes, dorado, wahoo, rainbow runner, and others. The impetus of the<br />
project was to contribute to the understanding of the tuna-dolphin association, and a community-level<br />
sampling design was adopted.<br />
The ecosystem model has been used to evaluate the possible effects of variability in bottom-up forcing by<br />
the environment on the middle and upper trophic levels of the pelagic ecosystem. Predetermined time<br />
series of producer biomasses were put into the model as proxies for changes in primary production that<br />
have been documented during El Niño and La Niña events, and the dynamics of the remaining components<br />
of the ecosystem were simulated. The model was also used to evaluate the relative contributions of fishing and<br />
the environment in shaping ecosystem structure in the tropical pelagic EPO. This was done by using the model<br />
to predict which components of the ecosystem might be susceptible to top-down effects of fishing, given the<br />
apparent importance of environmental variability in structuring the ecosystem. In general, animals with<br />
relatively low turnover rates were influenced more by fishing than by the environment, and animals with<br />
relatively high turnover rates more by the environment than by fishing.<br />
The structure of marine ecosystems is generally thought to be controlled by one of two mechanisms:<br />
‘bottom-up’ control (resource-driven) where the dynamics of primary producers (e.g. phytoplankton)<br />
controls the production and biomass at higher trophic levels, or ‘top-down’ control (consumer-driven)<br />
where predation by high trophic-level predators controls the abundance and composition of prey at lower<br />
trophic levels. In relatively recent years, ‘wasp-waist’ control of marine ecosystems has also been<br />
recognized. ‘Wasp-waist’ control is a combination of bottom-up and top-down forcing by a small number<br />
of abundant, highly productive, and short-lived species at intermediate trophic levels (e.g. sardines and<br />
anchovies) that form a narrow ‘waist’ through which energy flow in the system is regulated. These<br />
species exert top-down predatory control of energy flows from zooplankton, but also have bottom-up<br />
control by providing energy for high trophic-level predators. It has been assumed that wasp-waist control<br />
occurs primarily in highly productive and species-poor coastal systems (e.g. upwelling regions), which<br />
can be highly unstable and undergo rapid natural regime shifts in short periods of time. The ecosystem
147<br />
model for the tropical EPO was used in conjunction with a model for a region off the east coast of<br />
Australia where tunas and billfishes are caught to examine possible forcing dynamics of these systems.<br />
These two large species-rich pelagic ecosystems also showed wasp-waist-like structure, in that short-lived<br />
and fast-growing cephalopods and fishes in intermediate trophic levels comprise the vast majority of the<br />
biomass. The largest forcing effects were seen when altering the biomasses of mid trophic-level<br />
epipelagic and mesopelagic fishes in the models, whereby dramatic trophic cascades occurred both<br />
upward and downward in the system. These tropical pelagic ecosystems appear to possess a complex<br />
structure whereby several waist groups and alternate trophic pathways from primary producers to apex<br />
predators can cause unpredictable effects when the biomasses of particular functional groups are altered.<br />
Such models highlight the possible structuring mechanisms in pelagic systems, which have implications<br />
for fisheries that exploit these groups, such as squid fisheries, as well as for fisheries of top predators such<br />
as tunas and billfishes that prey upon wasp-waist species.<br />
9. ACTIONS <strong>BY</strong> THE IATTC AND THE AIDCP ADDRESSING ECOSYSTEM<br />
CONSIDERATIONS<br />
Both the IATTC convention and the AIDCP have objectives that address the incorporation of ecosystem<br />
considerations into the management of the tuna fisheries in the EPO. Actions taken in the past include:<br />
9.1. Dolphins<br />
a. For many years, the impact of the fishery on the dolphin populations has been assessed, and<br />
programs to reduce or eliminate that impact have met with considerable success.<br />
b. The incidental mortalities of all stocks of dolphins have been limited to levels that are<br />
insignificant relative to stock sizes.<br />
9.2. Sea turtles<br />
a. A data base on all sea turtle sightings, captures, and mortalities reported by observers has been<br />
compiled.<br />
b. In June 2003 the IATTC adopted a Recommendation on Sea Turtles, which contemplates “the<br />
development of a three-year program that could include mitigation of sea turtle bycatch,<br />
biological research on sea turtles, improvement of fishing gears, industry education and other<br />
techniques to improve sea turtle conservation.” In January 2004, the Working Group on Bycatch<br />
drew up a detailed program that includes all these elements, and urges all nations with vessels<br />
fishing for tunas in the EPO to provide the IATTC with information on interactions with sea<br />
turtles in the EPO, including both incidental and direct catches and other impacts on sea turtle<br />
populations. Resolution C-04-07 on a three-year program to mitigate the impact of tuna fishing<br />
on sea turtles was adopted by the IATTC in June 2004; it includes requirements for data<br />
collection, mitigation measures, industry education, capacity building, and reporting.<br />
c. Resolution C-04-05 REV 2, adopted by the IATTC in June 2006, contains provisions on releasing<br />
and handling of sea turtles captured in purse seines. The resolution also prohibits vessels from<br />
disposing of plastic containers and other debris at sea, and instructs the Director to study and<br />
formulate recommendations regarding the design of FADs, particularly the use of netting attached<br />
underwater to FADs.<br />
d. Resolution C-07-03, adopted by the IATTC in June 2007, contains provisions on implementing<br />
observer programs for fisheries under the purview of the Commission that may have impacts on<br />
sea turtles and are not currently being observed. The resolution requires fishermen to foster<br />
recovery and resuscitation of comatose or inactive hard-shell sea turtles before returning them to<br />
the water. CPCs with purse-seine and longline vessels fishing for species covered by the IATTC<br />
Convention in the EPO are directed to avoid encounters with sea turtles, to reduce mortalities<br />
using a variety of techniques, and to conduct research on modifications of FAD designs and
148<br />
longline gear and fishing practices.<br />
e. In response to a request made by the Subsecretaría de Recursos Pesqueros of Ecuador, a program<br />
was established by the World Wildlife Fund, the IATTC, and the government of the United States<br />
to mitigate the incidental capture and reduce the mortality of sea turtles due to longline fishing. A<br />
key element of this program is the comparison of catch rates of tunas, billfishes, sharks, and<br />
dorado caught with J hooks to the catch rates using circle hooks. Circle hooks do not hook as<br />
many turtles as the J hooks, which are traditionally used in the longline fishery, and the chance of<br />
serious injury to the sea turtles that bite the circle hooks is reduced because the hooks are wider<br />
and they tend to hook the lower jaw, rather than the more dangerous deep hookings in the<br />
esophagus and other areas, which are more common with the J hooks. Improved procedures and<br />
instruments to release hooked and entangled sea turtles have also been disseminated to the<br />
longline fleets of the region.<br />
By the end of 2008 the hook-exchange and observer program, which began in Ecuador in 2003, was<br />
active in Colombia, Costa Rica, Ecuador, El Salvador, Guatemala, Mexico, Nicaragua, Panama, and Peru<br />
and under development in Chile, with workshops taking place in many ports. The program in Ecuador is<br />
being carried out in partnership with the government and the Overseas Fishery Cooperation Foundation of<br />
Japan, while those in other countries are currently funded by U.S. agencies. Initial results show that, in<br />
the fisheries that target tunas, billfishes, and sharks, there was a significant reduction in the hooking rates<br />
of sea turtles with the circle hooks, and fewer hooks lodged in the esophagus or other areas detrimental to<br />
the turtles. The catch rates of the target species are, in general, similar to the catch rates with the J-hooks.<br />
An experiment was also carried out in the dorado fishery using smaller circle hooks. There were<br />
reductions in turtle hooking rates, but the reductions were not as great as for the fisheries that target tunas,<br />
billfishes, and sharks. In addition, workshops and presentations were conducted by IATTC staff members<br />
and others in all of the countries participating in the program.<br />
9.3. Seabirds<br />
a. Recommendation C-10-02 adopted by the IATTC in October 2010, reaffirmed the importance<br />
that IATTC Parties and cooperating non-Parties, fishing entities, and regional economic<br />
integration organizations implement, if appropriate, the FAO International Plan of Action for<br />
Reducing the Incidental Catch of Seabirds in Longline Fisheries (“IPOA-Seabirds”). The<br />
governments listed on the Recommendation agreed to report to the IATTC on their<br />
implementation of the IPOA-Seabirds, including, as appropriate, the status of their National Plans<br />
of Action for reducing incidental catches of seabirds in longline fisheries. It was also agreed that<br />
the governments would require their longline vessels that fish for species covered by the IATTC<br />
in specific areas (specified in Annex 1 of the Recommendation) to use at least two of a set of<br />
eight mitigation measures listed. In addition, members and cooperating non-members of the<br />
IATTC were encouraged to establish national programs to place observers aboard longline<br />
vessels flying their flags or fishing in their waters, and to adopt measures aimed at ensuring that<br />
seabirds captured alive during longline fishing operations are released alive and in the best<br />
condition possible.<br />
b. Resolution C-11-02, adopted by the IATTC in July 2011, reaffirmed the importance of<br />
implementing the IPOA-Seabirds (see 9.3.a) and provides that Members and cooperating non-<br />
Members (CPCs) shall require their longline vessels of more than 20 meters length overall and<br />
that fish for species covered by the IATTC in the EPO to use at least two of the specified<br />
mitigation measures, and establishes minimum technical standards for the measures. CPCs are<br />
encouraged to work, jointly and individually, to undertake research to further develop and refine<br />
methods for mitigating seabird bycatch, and to submit to the IATTC any information derived<br />
from such efforts. Also, CPCs are encouraged to establish national programs to place observers<br />
aboard longline vessels flying their flags or fishing in their waters, for the purpose of, inter alia,
149<br />
gathering information on the interactions of seabirds with the longline fisheries.<br />
9.4. Other species<br />
a. In June 2000, the IATTC adopted a resolution on live release of sharks, rays, billfishes, dorado,<br />
wahoo, and other non-target species.<br />
b. Resolution C-04-05, adopted by the IATTC in June 2006, instructs the Director to seek funds for<br />
reduction of incidental mortality of juvenile tunas, for developing techniques and equipment to<br />
facilitate release of billfishes, sharks, and rays from the deck or the net, and to carry out<br />
experiments to estimate the survival rates of released billfishes, sharks, and rays.<br />
c. Resolution C-11-10, adopted by the IATTC in July 2011, prohibits retaining onboard,<br />
transhipping, landing, storing, selling, or offering for sale any part or whole carcass of oceanic<br />
whitetip sharks in the fisheries covered by the Antigua Convention, and to promptly release<br />
unharmed, to the extent practicable, oceanic whitetip sharks when brought alongside the vessel.<br />
d. Resolution C-15-04, adopted by the IATTC in July 2015, prohibits retaining onboard,<br />
transhipping, landing, storing, selling, or offering for sale any part or whole carcass of manta rays<br />
(Mobulidae) (which includes Manta birostris and Mobula spp.) and requires vessels to release all<br />
mobulid rays alive wherever possible. The requirements set forth in the resolution do not apply to<br />
small-scale and artisanal fisheries exclusively for domestic consumption. The number of discards<br />
and releases of mobulid rays and the status (dead or alive) will be reported to the IATTC via the<br />
observer programs.<br />
9.5. Fish-aggregating devices (FADs)<br />
a. Resolution C-15-03, adopted by the IATTC in July 2015, requires all purse-seine vessels, when<br />
fishing on FADs in the IATTC Convention Area, to collect and report FAD information including<br />
an inventory of the FADs present on the vessel, specifying, for each FAD, identification, type,<br />
and design characteristics. In addition to this information, for each FAD activity, the position,<br />
date, hour, type of activity, and results of any set in terms of catch and by-catch must be reported.<br />
Data may be collected through a dedicated logbook, modifications to regional logsheets, or other<br />
domestic reporting procedures. The IATTC staff will analyze the data collected to identify any<br />
additional elements for data collection and reporting formats necessary to evaluate the effects of<br />
FAD use on the ecosystem, and provide initial recommendations for the management of FADs in<br />
the EPO. Recommendations shall include methods for limiting the capture of small bigeye and<br />
yellowfin tuna associated with fishing on FADs. CPCs shall require owners and operators of their<br />
applicable flagged purse-seine fishing vessels to identify all FADs deployed or modified by such<br />
vessels in accordance with a Commission identification scheme. To reduce entanglement of<br />
sharks, sea turtles, or any other species, principles for the design and deployment of FADs are<br />
specified. Setting a purse seine on tuna associated with a live whale shark is prohibited, if the<br />
animal is sighted prior to the set. A working group on FADs is established and its objectives are<br />
to collect and compile information on FADs, review data collection requirements, compile<br />
information regarding developments in other tuna-RFMOs on FADs, compile information<br />
regarding developments on the latest scientific information on FADs, including information on<br />
non-entangling FADs, and prepare a preliminary report for the SAC.<br />
9.6. All species<br />
a. Data on the bycatches of large purse-seine vessels are being collected, and governments are urged<br />
to provide bycatch information for other vessels.<br />
b. Data on the spatial distributions of the bycatches and the bycatch/catch ratios have been collected<br />
for analyses of policy options to reduce bycatches.<br />
c. Information to evaluate measures to reduce the bycatches, such as closures, effort limits, etc., has
150<br />
been collected.<br />
d. Assessments of habitat preferences and the effect of environmental changes have been made.<br />
e. Requirements have been adopted for the CPCs to ensure that, from 1 January 2013, at least 5% of<br />
the fishing effort made by its longline vessels greater than 20 m length overall carry a scientific<br />
observer.<br />
10. FUTURE DEVELOPM<strong>EN</strong>TS<br />
It is unlikely, in the near future at least, that there will be stock assessments for most of the bycatch<br />
species. In lieu of formal assessments, it may be possible to develop indices to assess trends in the status<br />
of these species. The IATTC staff’s experience with dolphins suggests that the task is not trivial if<br />
relatively high precision is required.<br />
An array of measures has been proposed to study changes in ecosystem properties. This could include<br />
studies of average trophic level, size spectra, dominance, diversity, etc., to describe the ecosystem in an<br />
aggregate way.<br />
The distributions of the fisheries for tunas and billfishes in the EPO are such that several regions with<br />
different ecological characteristics may be included. Within them, water masses, oceanographic or<br />
topographic features, influences from the continent, etc., may generate heterogeneity that affects the<br />
distributions of the different species and their relative abundances in the catches. It would be desirable to<br />
increase our understanding of these ecological strata so that they can be used in our analyses.<br />
It is important to continue studies of the ecosystems in the EPO. The power to resolve issues related to<br />
fisheries and the ecosystem will increase with the number of habitat variables, taxa, and trophic levels<br />
studied and with longer time series of data.<br />
FIGURE L-1. Simplified food-web diagram of the pelagic ecosystem in the tropical EPO. The numbers<br />
inside the boxes indicate the approximate trophic level of each group.<br />
FIGURA L-1. Diagrama simplificado de la red trófica del ecosistema pelágico en el OPO tropical. Los<br />
números en los recuadros indican el nivel trófico aproximado de cada grupo.
FIGURE L-2. Yearly mean trophic level estimates of the catches (retained and discarded) by the purseseine<br />
and pole-and-line fisheries in the tropical EPO, 1993-2014. Pole-and-line catches were not reported<br />
separately in 2014, instead they were combined with other gears.<br />
FIGURA L-2. Estimaciones anuales del nivel trófico de las capturas (retenidas y descartadas) de las<br />
pesquerías cerquera y cañera en el OPO tropical, 1993-2014. Las capturas cañeras no fueron reportadas<br />
por separado en 2014, sino que fueron combinadas con otras artes.<br />
151
152<br />
FIGURE L-3. Trophic level estimates of the retained catches and discarded catches by purse-seine<br />
fisheries in the tropical EPO, 1993-2014.<br />
FIGURA L-3. Estimaciones del nivel trófico de las capturas retenidas y descartadas por las pesquerías<br />
cerqueras en el OPO tropical, 1993-2014.
FIGURE L-4a. Productivity and susceptibility x-y plot for target and bycatch species caught by the<br />
purse-seine fishery of the EPO during 2005-2013, based on s j 1 . The pie charts show the proportion of<br />
bycatch (non-tuna species) or proportion of catch (tuna species), by set type, for those set types with<br />
bycatch or catch ≥ 5% for the species. The 3-alpha species codes next to each pie chart are defined in<br />
Table L-3a.<br />
FIGURA L-4a. Gráfica x-y de productividad y susceptibilidad de especies objetivo y de captura<br />
incidental capturadas por la pesquería de cerco del OPO durante 2005-2013, basada en s j 1 . Las gráficas de<br />
sectores ilustran la proporción de captura incidental (especies aparte de los atunes) o proporción de la<br />
captura (especies de atunes), por tipo de lance, en aquellos tipos de lance con captura incidental o captura<br />
≥ 5% de esa especie. En la Tabla L-3a se definen los códigos de tres letras al lado de cada gráfica de<br />
sectores.<br />
153
154<br />
FIGURE L-4b. Productivity and susceptibility x-y plot for target and bycatch species caught by the<br />
purse-seine fishery of the EPO during 2005-2013, based on s j 2 . The pie charts show the proportion of<br />
bycatch (non-tuna species) or proportion of catch (tuna species), by set type, for those set types with<br />
bycatch or catch ≥ 5% for the species. The 3-alpha species codes next to each pie chart are defined in<br />
Table L-3b.<br />
FIGURA L-4b. Gráfica x-y de productividad y susceptibilidad de especies objetivo y de captura<br />
incidental capturadas por la pesquería de cerco del OPO durante 2005-2013, basada en s j 2 . Las gráficas de<br />
sectores ilustran la proporción de captura incidental (especies aparte de los atunes) o proporción de la<br />
captura (especies de atunes), por tipo de lance, en aquellos tipos de lance con captura incidental o captura<br />
≥ 5% de esa especie. En la Tabla L-3b se definen los códigos de tres letras al lado de cada gráfica de<br />
sectores.
FIGURE L-4c. Productivity and susceptibility x-y plot for bycatch species caught by the purse-seine<br />
fishery of the EPO during 2005-2013, based on s j 3 . s j<br />
3<br />
was not computed for species for which full<br />
assessments (or management indicators) exist or for which the fishery data have been determined to be<br />
unsuitable for trend estimation; i.e., for the three target tuna species and the dolphin species. The pie<br />
charts show the proportion of bycatch (non-tuna species), by set type, for those set types with bycatch ≥<br />
5% for the species. The 3-alpha species codes next to each pie chart are defined in Table L-3c.<br />
FIGURA L-4c. Gráfica x-y de productividad y susceptibilidad de especies objetivo y de captura<br />
incidental capturadas por la pesquería de cerco del OPO durante 2005-2013, basada en s j 3 . No se computó<br />
s j<br />
3<br />
para especies para las cuales existen evaluaciones completas (o indicadores de ordenación), o para las<br />
cuales se determinó que los datos de pesca no son adecuados para la estimación de tendencias; es decir,<br />
para las tres especies de atunes objetivo y las especies de delfines. Las gráficas de sectores ilustran la<br />
proporción de captura incidental (especies aparte de los atunes), por tipo de lance, en aquellos tipos de<br />
lance con captura incidental ≥ 5% de esa especie. En la Tabla L-3c se definen los códigos de tres letras al<br />
lado de cada gráfica de sectores.<br />
155
156<br />
TABLE L-1. Productivity attributes and scoring thresholds used in the IATTC PSA.<br />
TAB<strong>LA</strong> L-1. Atributos de productividad y umbrales de puntuación usados en el APS de la CIAT.<br />
Ranking – Clasificación<br />
Productivity attribute<br />
Atributo de productividad<br />
Low –<br />
Bajo (1)<br />
Moderate –<br />
Moderado (2)<br />
High –<br />
Alto (3)<br />
Intrinsic rate of population growth (r)<br />
Tasa intrínseca de crecimiento de la población (r) ≤ 0.1 > 0.1, ≤ 1.3 >1.3<br />
Maximum age (years)<br />
Edad máxima (años) ≥ 20 > 11, < 20 ≤ 11<br />
Maximum size (cm)<br />
Talla máxima (cm) > 350 > 200, ≤ 350 ≤ 200<br />
von Bertalanffy growth coefficient (k)<br />
Coeficiente de crecimiento de von Bertalanffy (k) < 0.095 0.095 – 0.21 > 0.21<br />
Natural mortality (M)<br />
Mortalidad natural (M) < 0.25 0.25 – 0.48 > 0.48<br />
Fecundity (measured)<br />
Fecundidad (medida) < 10 10 – 200,000 > 200,000<br />
Breeding strategy<br />
Estrategia de reproducción ≥ 4 1 to-a 3 0<br />
Age at maturity (years)<br />
Edad de madurez (años) ≥ 7.0 ≥ 2.7, < 7.0 < 2.7<br />
Mean trophic level<br />
Nivel trófico medio > 5.1 4.5 – 5.1 < 4.5
157<br />
TABLE L-2. Susceptibility attributes and scoring thresholds used in the IATTC PSA.<br />
Susceptibility attribute<br />
Management strategy<br />
Areal overlap -<br />
geographical<br />
concentration index<br />
Ranking<br />
Low (1) Moderate (2) High (3)<br />
Stocks specifically named in No management<br />
conservation resolutions; measures; stocks<br />
closely monitored<br />
closely<br />
Management and<br />
proactive<br />
accountability<br />
measures in place<br />
Greatest<br />
bycatches outside<br />
areas with the<br />
most sets and<br />
stock not<br />
concentrated (or<br />
not rare)<br />
Vertical overlap with gear < 25% of stock<br />
occurs at the<br />
depths fished<br />
Seasonal migrations<br />
Schooling/Aggregation<br />
and other behavioral<br />
responses to gear<br />
Potential survival after<br />
capture and release under<br />
current fishing practices<br />
Desirability/value of<br />
catch<br />
(percent retention)<br />
Seasonal<br />
migrations<br />
decrease overlap<br />
with the fishery<br />
Behavioral<br />
responses<br />
decrease the<br />
catchability of the<br />
gear<br />
Probability of<br />
survival > 67%<br />
Stock is not<br />
highly valued or<br />
desired by the<br />
fishery (< 33%<br />
retention)<br />
Greatest bycatches outside areas<br />
with the most sets and stock<br />
concentrated (or rare), OR<br />
Greatest bycatches in areas with<br />
the most sets and stock not<br />
concentrated (or not rare)<br />
Between 25% and 50% of the<br />
stock occurs at the depths fished<br />
Seasonal migrations do not<br />
substantially affect the overlap<br />
with the fishery<br />
Behavioral responses do not<br />
substantially affect the<br />
catchability of the gear<br />
33% < probability of survival ≤<br />
67%<br />
Stock is moderately valued or<br />
desired by the fishery (33-66%<br />
retention)<br />
monitored<br />
Greatest<br />
bycatches in<br />
areas with the<br />
most sets and<br />
stock<br />
concentrated (or<br />
rare)<br />
> 50% of the<br />
stock occurs in<br />
the depths fished<br />
Seasonal<br />
migrations<br />
increase<br />
overlap with the<br />
fishery<br />
Behavioral<br />
responses<br />
increase the<br />
catchability of<br />
the gear<br />
Probability of<br />
survival < 33%<br />
Stock is highly<br />
valued or desired<br />
by the fishery (><br />
66% retention)
158<br />
TABLE L-3a. Preliminary productivity and susceptibility scores used to compute the overall vulnerability measure v 1 . Dolphin=DEL,<br />
unassociated=NOA, and floating-object sets=OBJ. Individual susceptibility scores, s jk, are shown for each fishery and as a weighted combination<br />
of the individual fishery values, s 1 j ; see text for details. Productivity, p, and vulnerability, v 1 , scores are provided. These values are preliminary as<br />
this year’s PSA is considered a proof of concept.<br />
s jk scores by fishery<br />
GROUP Scientific name Common name<br />
3-alpha<br />
species code<br />
IUCN* DEL NOA OBJ p<br />
1<br />
s j v 1<br />
Tunas Thunnus albacares Yellowfin tuna YFT NT 2.38 2.38 2.38 2.78 2.38 1.40<br />
Thunnus obesus Bigeye tuna BET VU 1.00 2.23 2.38 2.33 1.70 0.97<br />
Katsuwonus pelamis Skipjack tuna SKJ LC 1.00 2.38 2.38 2.78 1.73 0.76<br />
Billfishes Makaira nigricans Blue marlin BUM VU 2.23 2.23 2.69 2.00 2.39 1.71<br />
Istiompax indica Black marlin BLM DD 2.23 2.23 2.69 2.00 2.39 1.71<br />
Kajikia audax Striped marlin MLS NT 2.54 2.54 2.54 2.33 2.54 1.68<br />
Istiophorus platypterus Indo-Pacific sailfish SFA LC 2.54 2.54 2.54 2.44 2.54 1.64<br />
Dolphins Stenella longirostris Unidentified spinner dolphin DSI DD 1.77 1.00 1.00 1.22 1.36 1.82<br />
Stenella attenuata Unidentified spotted dolphin DPN LC 1.77 1.00 1.00 1.33 1.36 1.71<br />
Delphinus delphis Common dolphin DCO LC 1.62 1.00 1.00 1.33 1.29 1.70<br />
Large fishes Coryphaena hippurus Common dolphinfish DOL LC 1.00 2.00 2.31 2.78 1.64 0.68<br />
Coryphaena equiselis Pompano dolphinfish CFW LC 1.00 1.00 2.38 2.89 1.48 0.50<br />
Acanthocybium solandri Wahoo WAH LC 1.00 1.00 2.62 2.67 1.57 0.66<br />
Elagatis bipinnulata Rainbow runner RRU NA 1.00 1.00 2.31 2.78 1.46 0.51<br />
Mola mola Ocean sunfish, Mola MOX NA 1.00 1.92 1.92 1.78 1.49 1.31<br />
Caranx sexfasciatus Bigeye trevally CXS LC 1.00 2.38 1.00 2.56 1.25 0.51<br />
Seriola lalandi Yellowtail amberjack YTC NA 1.00 2.08 1.85 2.44 1.49 0.75<br />
Rays Manta birostris Giant manta RMB VU 1.92 2.08 1.77 1.22 1.90 1.99<br />
Mobula japanica Spinetail manta RMJ NT 1.92 2.08 1.77 1.78 1.90 1.51<br />
Mobula thurstoni Smoothtail manta RMO NT 1.92 2.08 1.77 1.67 1.90 1.60<br />
Sharks Carcharhinus falciformis Silky shark FAL NT 2.08 2.08 2.15 1.44 2.10 1.91<br />
Carcharhinus longimanus Oceanic whitetip shark OCS VU 1.69 1.00 2.08 1.67 1.70 1.50<br />
Sphyrna zygaena Smooth hammerhead shark SPZ VU 1.77 1.92 2.08 1.33 1.91 1.90<br />
Sphyrna lewini Scalloped hammerhead shark SPL <strong>EN</strong> 1.77 1.92 2.08 1.33 1.91 1.90<br />
Sphyrna mokarran Great hammerhead shark SPK <strong>EN</strong> 2.08 1.77 1.92 1.33 1.97 1.93<br />
Alopias pelagicus Pelagic thresher shark PTH VU 1.92 1.92 1.77 1.22 1.87 1.98<br />
Alopias superciliosus Bigeye thresher shark BTH VU 1.77 2.08 1.46 1.11 1.72 2.02<br />
Alopias vulpinus Common thresher shark ALV VU 1.92 1.92 1.77 1.67 1.87 1.59<br />
Isurus oxyrinchus Short fin mako shark SMA VU 2.23 2.23 1.92 1.22 2.12 2.10<br />
Small fishes Canthidermis maculatus Ocean triggerfish CNT NA 1.00 1.00 2.00 2.33 1.35 0.76<br />
Sectator ocyurus Bluestriped chub ECO NA 1.00 1.00 2.08 2.22 1.38 0.87<br />
Turtles Lepidochelys olivacea Olive ridley turtle LKV VU 1.62 2.23 1.62 1.89 1.73 1.33<br />
*IUCN listings are defined as: <strong>EN</strong>=endangered, NT=near threatened, VU=vulnerable, LC=least concern, DD=data deficient, NA=not assessed
159<br />
TABLE L-3b. Preliminary productivity and susceptibility scores used to compute the overall vulnerability measure v 2 . Dolphin=DEL,<br />
∗<br />
unassociated=NOA, and floating-object sets=OBJ. Individual susceptibility scores, s jj R, are shown for each fishery and as a weighted combination of the<br />
individual fishery values, s 2 j ; see text for details. Productivity, p, and vulnerability, v 2 , scores are provided. These values are preliminary as this year’s<br />
PSA is considered a proof of concept.<br />
s jj , scores by fishery<br />
GROUP Scientific name Common name<br />
3-alpha<br />
species code<br />
IUCN* DEL NOA OBJ p<br />
2<br />
s j v 2<br />
Tunas Thunnus albacares Yellowfin tuna YFT NT 2.38 2.38 2.38 2.78 2.69 1.70<br />
Thunnus obesus Bigeye tuna BET VU 1.00 2.23 2.38 2.33 1.79 1.04<br />
Katsuwonus pelamis Skipjack tuna SKJ LC 1.00 2.38 2.38 2.78 2.13 1.15<br />
Billfishes Makaira nigricans Blue marlin BUM VU 2.23 2.23 2.69 2.00 2.20 1.56<br />
Istiompax indica Black marlin BLM DD 2.23 2.23 2.69 2.00 2.20 1.56<br />
Kajikia audax Striped marlin MLS NT 2.54 2.54 2.54 2.33 2.27 1.44<br />
Istiophorus platypterus Indo-Pacific sailfish SFA LC 2.54 2.54 2.54 2.44 2.27 1.39<br />
Dolphins Stenella longirostris Unidentified spinner dolphin DSI DD 1.77 1.00 1.00 1.22 1.42 1.83<br />
Stenella attenuata Unidentified spotted dolphin DPN LC 1.77 1.00 1.00 1.33 1.42 1.72<br />
Delphinus delphis Common dolphin DCO LC 1.62 1.00 1.00 1.33 1.38 1.71<br />
Large fishes Coryphaena hippurus Common dolphinfish DOL LC 1.00 2.00 2.31 2.78 1.99 1.02<br />
Coryphaena equiselis Pompano dolphinfish CFW LC 1.00 1.00 2.38 2.89 1.92 0.92<br />
Acanthocybium solandri Wahoo WAH LC 1.00 1.00 2.62 2.67 1.96 1.01<br />
Elagatis bipinnulata Rainbow runner RRU NA 1.00 1.00 2.31 2.78 1.67 0.70<br />
Mola mola Ocean sunfish, Mola MOX NA 1.00 1.92 1.92 1.78 1.74 1.43<br />
Caranx sexfasciatus Bigeye trevally CXS LC 1.00 2.38 1.00 2.56 1.56 0.72<br />
Seriola lalandi Yellowtail amberjack YTC NA 1.00 2.08 1.85 2.44 1.51 0.76<br />
Rays Manta birostris Giant manta RMB VU 1.92 2.08 1.77 1.22 1.95 2.02<br />
Mobula japanica Spinetail manta RMJ NT 1.92 2.08 1.77 1.78 1.95 1.55<br />
Mobula thurstoni Smoothtail manta RMO NT 1.92 2.08 1.77 1.67 1.95 1.63<br />
Sharks Carcharhinus falciformis Silky shark FAL NT 2.08 2.08 2.15 1.44 2.23 1.98<br />
Carcharhinus longimanus Oceanic whitetip shark OCS VU 1.69 1.00 2.08 1.67 1.62 1.47<br />
Sphyrna zygaena Smooth hammerhead shark SPZ VU 1.77 1.92 2.08 1.33 1.95 1.92<br />
Sphyrna lewini Scalloped hammerhead shark SPL <strong>EN</strong> 1.77 1.92 2.08 1.33 1.95 1.92<br />
Sphyrna mokarran Great hammerhead shark SPK <strong>EN</strong> 2.08 1.77 1.92 1.33 1.98 1.94<br />
Alopias pelagicus Pelagic thresher shark PTH VU 1.92 1.92 1.77 1.22 1.93 2.01<br />
Alopias superciliosus Bigeye thresher shark BTH VU 1.77 2.08 1.46 1.11 1.86 2.08<br />
Alopias vulpinus Common thresher shark ALV VU 1.92 1.92 1.77 1.67 1.93 1.63<br />
Isurus oxyrinchus Short fin mako shark SMA VU 2.23 2.23 1.92 1.22 2.06 2.07<br />
Small fishes Canthidermis maculatus Ocean triggerfish CNT NA 1.00 1.00 2.00 2.33 1.18 0.69<br />
Sectator ocyurus Bluestriped chub ECO NA 1.00 1.00 2.08 2.22 1.19 0.80<br />
Turtles Lepidochelys olivacea Olive ridley turtle LKV VU 1.62 2.23 1.62 1.89 1.63 1.28<br />
*IUCN listings are defined as: <strong>EN</strong>=endangered, NT=near threatened, VU=vulnerable, LC=least concern, DD=data deficient, NA=not assessed
160<br />
TABLE L-3c. Preliminary productivity and susceptibility scores used to compute the overall vulnerability measure v 3 . Dolphin=DEL,<br />
∗∗<br />
unassociated=NOA, and floating-object sets=OBJ. Individual susceptibility scores, s jj R, are shown for each fishery and as a weighted combination of the<br />
individual fishery values, s 3 j ; see text for details. Productivity, p, and vulnerability, v 3 , scores are provided. These values are preliminary as this year’s<br />
PSA is considered a proof of concept.<br />
GROUP Scientific name Common name<br />
3-alpha<br />
species code<br />
∗∗<br />
s jj scores by fishery<br />
IUCN* DEL NOA OBJ p<br />
*IUCN listings are defined as: <strong>EN</strong>=endangered, NT=near threatened, VU=vulnerable, LC=least concern, DD=data deficient, NA=not assessed<br />
s j<br />
3 v 3<br />
Tunas Thunnus albacares Yellowfin tuna YFT NT 2.38 2.38 2.38 2.78<br />
Thunnus obesus Bigeye tuna BET VU 1.00 2.23 2.38 2.33<br />
Katsuwonus pelamis Skipjack tuna SKJ LC 1.00 2.38 2.38 2.78<br />
Billfishes Makaira nigricans Blue marlin BUM VU 2.23 2.23 2.69 2.00 1.95 1.38<br />
Istiompax indica Black marlin BLM DD 2.23 2.23 2.69 2.00 2.34 1.67<br />
Kajikia audax Striped marlin MLS NT 2.54 2.54 2.54 2.33 2.28 1.45<br />
Istiophorus platypterus Indo-Pacific sailfish SFA LC 2.54 2.54 2.54 2.44 2.16 1.28<br />
Dolphins Stenella longirostris Unidentified spinner dolphin DSI DD 1.77 1.00 1.00 1.22<br />
Stenella attenuata Unidentified spotted dolphin DPN LC 1.77 1.00 1.00 1.33<br />
Delphinus delphis Common dolphin DCO LC 1.62 1.00 1.00 1.33<br />
Large fishes Coryphaena hippurus Common dolphinfish DOL LC 1.00 2.00 2.31 2.78 1.67 0.70<br />
Coryphaena equiselis Pompano dolphinfish CFW LC 1.00 1.00 2.38 2.89 1.33 0.35<br />
Acanthocybium solandri Wahoo WAH LC 1.00 1.00 2.62 2.67 1.63 0.71<br />
Elagatis bipinnulata Rainbow runner RRU NA 1.00 1.00 2.31 2.78 1.32 0.39<br />
Mola mola Ocean sunfish, Mola MOX NA 1.00 1.92 1.92 1.78 1.38 1.28<br />
Caranx sexfasciatus Bigeye trevally CXS LC 1.00 2.38 1.00 2.56 1.26 0.51<br />
Seriola lalandi Yellowtail amberjack YTC NA 1.00 2.08 1.85 2.44 1.64 0.85<br />
Rays Manta birostris Giant manta RMB VU 1.92 2.08 1.77 1.22 1.70 1.91<br />
Mobula japanica Spinetail manta RMJ NT 1.92 2.08 1.77 1.78 1.70 1.41<br />
Mobula thurstoni Smoothtail manta RMO NT 1.92 2.08 1.77 1.67 1.70 1.50<br />
Sharks Carcharhinus falciformis Silky shark FAL NT 2.08 2.08 2.15 1.44 2.55 2.20<br />
Carcharhinus longimanus Oceanic whitetip shark OCS VU 1.69 1.00 2.08 1.67 2.35 1.90<br />
Sphyrna zygaena Smooth hammerhead shark SPZ VU 1.77 1.92 2.08 1.33 1.70 1.81<br />
Sphyrna lewini Scalloped hammerhead shark SPL <strong>EN</strong> 1.77 1.92 2.08 1.33 1.70 1.81<br />
Sphyrna mokarran Great hammerhead shark SPK <strong>EN</strong> 2.08 1.77 1.92 1.33 2.00 1.94<br />
Alopias pelagicus Pelagic thresher shark PTH VU 1.92 1.92 1.77 1.22 1.68 1.91<br />
Alopias superciliosus Bigeye thresher shark BTH VU 1.77 2.08 1.46 1.11 1.61 1.99<br />
Alopias vulpinus Common thresher shark ALV VU 1.92 1.92 1.77 1.67 1.68 1.50<br />
Isurus oxyrinchus Short fin mako shark SMA VU 2.23 2.23 1.92 1.22 1.81 1.96<br />
Small fishes Canthidermis maculatus Ocean triggerfish CNT NA 1.00 1.00 2.00 2.33 1.26 0.72<br />
Sectator ocyurus Bluestriped chub ECO NA 1.00 1.00 2.08 2.22 1.28 0.83<br />
Turtles Lepidochelys olivacea Olive ridley turtle LKV VU 1.62 2.23 1.62 1.89 2.36 1.76
161<br />
L. CONSIDERACIONES ECOSISTÉMICAS<br />
1. Introducción .................................................................................................................................... 161<br />
2. Impacto de las capturas ................................................................................................................... 162<br />
3. Otra fauna ....................................................................................................................................... 169<br />
4. Interacciones tróficas ...................................................................................................................... 171<br />
5. Ambiente físico............................................................................................................................... 176<br />
6. Indicadores agregados..................................................................................................................... 178<br />
7. Evaluación de riesgos ecológicos ................................................................................................... 181<br />
8. Modelado de ecosistemas ............................................................................................................... 185<br />
9. Acciones de la CIAT y el APICD relativas a consideraciones ecosistémicas ................................. 186<br />
10. Acontecimientos futuros ................................................................................................................. 190<br />
1. INTRODUCCIÓN<br />
El Código de Conducta para la Pesca Responsable de la FAO (1995) estipula que los Estados y los<br />
usuarios de los recursos acuáticos vivos deberían conservar los ecosistemas acuáticos y establece que. las<br />
medidas de ordenación deberían asegurar la conservación no sólo de las especies objetivo, sino también<br />
de aquellas especies pertenecientes al mismo ecosistema 1<br />
10. En 2001, la Declaración de Reikiavik sobre<br />
Pesca Responsable en el Ecosistema Marino elaboró esos principios con un compromiso de incorporar un<br />
enfoque ecosistémico en la ordenación de la pesca.<br />
En consonancia con esos instrumentos, una de las funciones de la CIAT de acuerdo a la Convención de<br />
Antigua de 2003 es “adoptar, en caso necesario, medidas y recomendaciones para la conservación y<br />
administración de las especies que pertenecen al mismo ecosistema y que son afectadas por la pesca de<br />
especies de peces abarcadas por la presente Convención, o que son dependientes de estas especies o están<br />
asociadas con ellas, con miras a mantener o restablecer las poblaciones de dichas especies por encima de<br />
los niveles en que su reproducción pueda verse gravemente amenazada”.<br />
Por consiguiente, la CIAT ha tomado cuestiones de ecosistema en cuenta en muchas de sus<br />
decisiones, y el presente informe sobre el ecosistema pelágico de alta mar del Océano Pacífico<br />
tropical y subtropical, que constituye el hábitat de los atunes y peces picudos, ha estado disponible<br />
desde 2003 para ayudar en la toma de decisiones de ordenación. Esta sección brinda un panorama<br />
coherente, resumiendo los conocimientos del impacto directo de la pesca sobre varias especies y<br />
grupos de especies en el ecosistema, y presenta los conocimientos del medio ambiente y de otras<br />
especies que no son afectadas directamente por la pesca, pero podrían ser afectadas indirectamente<br />
mediante interacciones depredador-preso en la red alimenticia.<br />
Este análisis no sugiere objetivos para la incorporación de consideraciones de ecosistema en la ordenación de<br />
las pesquerías de atunes o peces picudos ni nuevas medidas de ordenación. Su propósito principal es más bien<br />
brindar a la Comisión la oportunidad de asegurar que dichas consideraciones formen parte de su agenda.<br />
Es importante tener en cuenta que la perspectiva que tenemos del ecosistema se basa en el pasado<br />
reciente; disponemos de muy poca información sobre el ecosistema antes de que comenzara la<br />
explotación. Además, el medio ambiente está sujeto a cambios en varias escalas temporales, entre ellas las<br />
conocidas fluctuaciones de El Niño y cambios a mayor plazo recientemente reconocidos, tales como la<br />
Oscilación Decadal del Pacífico y otros cambios climáticos.<br />
Además de reportar las capturas de las especies principales de atunes y peces picudos, el personal reporta<br />
1 El Código también dispone que las medidas de ordenación deberían asegurar que se mantenga la biodiversidad de<br />
los ecosistemas acuáticos y se protejan las especies en peligro y que los Estados deberían evaluar los impactos de<br />
factores ambientales sobre las poblaciones y especies objetivo que pertenecen al mismo ecosistema o estén<br />
asociados a las poblaciones objetivo, o sean dependientes de las mismas, y evaluar la relación entre las<br />
poblaciones en el ecosistema.
162<br />
las capturas incidentales de especies no objetivo que son o retenidas o descartadas. En la presente<br />
sección, se presentan datos sobre dichas capturas incidentales en el contexto del efecto de la pesca<br />
sobre el ecosistema. Desgraciadamente, mientras que se cuenta con información relativamente buena<br />
para los atunes y peces picudos, no se dispone de información para la pesquería entera. La<br />
información es completa para los buques cerqueros grandes (de más de 363 toneladas de capacidad<br />
de acarreo) que llevan observadores bajo el Acuerdo sobre el Programa Internacional para la<br />
Conservación de los Delfines (APICD), y se registra información sobre capturas retenidas también<br />
para otros buques cerqueros, barcos cañeros, y gran parte de la flota palangrera. Se dispone de cierta<br />
información sobre tiburones retenidos por partes de la flota palangrera. Se incluye información sobre<br />
especies no objetivo retenidas y descartadas en el caso de los cerqueros grandes, y se cuenta con esta<br />
información para unos pocos viajes por buques de menor tamaño. Se dispone de poca información<br />
sobre las capturas incidentales y descartes de otros buques pesqueros.<br />
2. IMPACTO DE <strong>LA</strong>S CAPTURAS<br />
2.1. Evaluaciones de especies individuales<br />
En otros documentos preparados para esta reunión se presenta información sobre el efecto de la pesca<br />
atunera sobre las poblaciones de especies individuales en el Océano Pacífico oriental (OPO) y<br />
evaluaciones detalladas. Una perspectiva ecosistémica requiere un enfoque en cómo la pesca puede haber<br />
cambiado varios componentes del ecosistema. Las secciones 2.2 y 2.3 del presente informe presentan<br />
información sobre la biomasa actual de cada población considerada comparada con lo que hubiera sido en<br />
ausencia de la pesca. Además, la sección 2.2 incluye un resumen de investigaciones recientes de<br />
comunidades asociadas a dispositivos agregadores de peces (plantados), incluyendo métodos que<br />
podrían conducir a soluciones acerca de cómo reducir la mortalidad por pesca de atunes aleta<br />
amarilla y patudo de tamaños no deseados. No hay medidas directas del tamaño de la población antes de<br />
que comenzara la pesca y, en todo caso, las poblaciones hubiesen variado entre años. Además, el tamaño<br />
de la población sin explotación podría ser afectado por la abundancia de los depredadores y las presas, la<br />
cual no es incluida en los análisis de las especies individuales.<br />
2.2. Atunes<br />
En los Documentos SAC-07-05b, 05a, y 05c se presenta información sobre los efectos de la pesca sobre los<br />
atunes aleta amarilla, patudo, y barrilete, respectivamente, y se dispondrá d se trata el atún aleta azul del<br />
Pacífico. El Grupo de Trabajo sobre el atún albacora del norte del ISC terminó su evaluación completa de la<br />
población en 2014; la próxima evaluación está programada para 2017.<br />
El personal de la CIAT publicó recientemente dos estudios enfocados en la reducción potencial de la<br />
mortalidad por pesca en la pesquería cerquera de atunes patudo y aleta amarilla de tamaños no<br />
deseados y otras especies motivo de preocupación, pero al mismo tiempo seguir capturando los<br />
cardúmenes asociados de atún barrilete. El primer estudio evaluó el comportamiento simultáneo de<br />
barrilete, patudo, y aleta amarilla en grandes agrupaciones multiespecíficas asociadas a plantados. En<br />
el primer estudio, los investigadores documentaron diferencias espaciales y temporales en el<br />
comportamiento de la agrupación de cada una de las tres especies de atunes, incluyendo la<br />
distribución de profundidades, pero las diferencias no parecen ser suficientes para que<br />
modificaciones de las prácticas de pesca con red de cerco puedan evitar de forma efectiva la captura<br />
de atunes patudo y aleta amarilla pequeños y optimizar simultáneamente la captura de barrilete en los<br />
lances sobre plantados. El segundo evaluó la capacidad de un capitán de pesca de predecir la<br />
composición por especies, los tamaños, y las cantidades de atunes asociados a plantados flotando a la<br />
deriva, antes de encerrarlos con la red de cerco. Las predicciones del capitán estaban relacionadas de<br />
forma significativa con la captura real total y por especies, pero no con las categorías de tamaño por<br />
especie, indicando que estaba sobreestimando una especie y subestimando la otra.
163<br />
2.3. Peces picudos<br />
En las secciones G a J del Informe de la situación de la pesquería 13 de la CIAT se presenta información<br />
sobre los efectos de la pesca atunera sobre el pez espada, marlín azul, marlín rayado, y pez vela. El<br />
personal de la CIAT realizó evaluaciones de poblaciones y/o análisis de la estructura de la población para<br />
el pez espada (2007, estructura), marlín rayado del Pacífico oriental (2010, evaluación y estructura),<br />
marlín rayado el Pacífico noreste (2011, evaluación), pez espada del Pacífico sudeste (2012, evaluación),<br />
y pez vela del Pacífico oriental (2013, evaluación). El grupo de trabajo sobre peces picudos del Comité<br />
Científico Internacional (ISC) para los atunes y especies afines en el Océano Pacífico norte realizó<br />
evaluaciones de las poblaciones de marlín azul del Pacífico (2013) y pez espada (2014) y marlín rayado<br />
(2015) del Pacífico norte.<br />
2.3.1. Marlín negro y marlín trompa corta<br />
No se han realizado evaluaciones de las poblaciones de estas especies, pero existen ciertos datos,<br />
publicados conjuntamente por científicos del Instituto Nacional de Investigación de Pesquerías de<br />
Ultramar (NRIFSF) del Japón y la CIAT en la serie de Boletines de la CIAT, que indican tendencias en<br />
las capturas, el esfuerzo, y la captura por unidad de esfuerzo (CPUE).<br />
2.4. Resumen<br />
En las Tablas A-2a y A-2b del Documento SAC-07-03a se presentan las estimaciones preliminares de las<br />
capturas (incluyendo descartes de la pesca de cerco), en toneladas, de atunes, bonitos, y peces picudos en<br />
el OPO durante 2015.<br />
2.5. Mamíferos marinos<br />
En el OPO, se encuentran frecuentemente mamíferos marinos, especialmente delfines manchados<br />
(Stenella attenuata), tornillo (S. longirostris), y comunes (Delphinus delphis), asociados con atunes aleta<br />
amarilla de entre unos 10 y 40 kg. Los pescadores con red de cerco descubrieron que podían lograr las<br />
capturas máximas de aleta amarilla en el OPO si cercaran manadas de delfines asociadas con atunes, y<br />
luego liberaran los delfines sin dejar al pescado escapar. La mortalidad incidental de delfines en esta<br />
operación fue alta en los primeros años de la pesquería, y las poblaciones de delfines fueron reducidas de<br />
sus niveles sin explotación durante las décadas de 1960 y 1970. A partir de fines de la década de los 1980<br />
la mortalidad incidental disminuyó precipitadamente, y ahora hay evidencias de una recuperación de las<br />
poblaciones. En la Tabla 1 se detallan las estimaciones preliminares de la mortalidad de delfines<br />
ocasionada por la pesca en 2015. El personal de la CIAT es responsable de la evaluación de las<br />
poblaciones de delfines asociadas a la pesquería atunera de cerco, como base para los límites de<br />
mortalidad de delfines establecidos por el Acuerdo sobre el Programa Internacional para la Conservación<br />
de los Delfines (APICD).<br />
Los estudios de la asociación de atunes con delfines forman un componente importante del enfoque a<br />
largo plazo del personal para comprender las interacciones clave en el ecosistema. El grado al cual los<br />
atunes aleta amarilla y los delfines compiten por recursos, o si uno u otro se beneficia de la interacción,<br />
por qué los atunes se encuentran con mayor frecuencia asociados a delfines manchados y no con otros<br />
delfines, y por qué las especies se asocian más fuertemente en el Pacífico oriental tropical, constituyen<br />
información crítica, en vista de la gran biomasa de ambos grupos, y su altas tasas de consumo de presas.<br />
Se realizaron tres estudios para tratar estas hipótesis: un estudio de rastreo simultáneo de delfines<br />
manchados y atunes aleta amarilla, un estudio de interacciones tróficas que compara sus presas y patrones<br />
diarios de alimentación, y un estudio espacial de las características oceanográficas correlacionadas con la<br />
asociación atún-delfín. Estos estudios demostraron que la asociación no es ni permanente ni obligatoria, y<br />
que los beneficios de la asociación no se basan en ventajas alimenticias. Apoyan la hipótesis que una<br />
especie, o ambas, reducen el riesgo de depredación mediante la formación de grupos grandes de especies<br />
mixtas. La asociación es más prevalente donde el hábitat de los atunes se encuentra comprimido a las<br />
aguas superficiales someras y cálidas de la capa de mezcla por la zona de oxígeno mínimo, una capa
164<br />
gruesa de aguas pobres en oxígeno debajo de la capa de mezcla. La asociación ha sido observada en áreas<br />
con condiciones oceanográficas similares en otros océanos, pero es más prevalente y consistente en el<br />
Pacífico oriental tropical, donde la zona de oxígeno mínimo es la más hipóxica y extensa del mundo.<br />
Durante agosto-diciembre de 2006, científicos del Servicio Nacional de Pesquerías Marinas (NMFS) de<br />
EE.UU. realizaron un crucero de investigación como parte del proyecto STAR (Stenella Abundance<br />
Research). La meta principal de este estudio plurianual es investigar tendencias en el tamaño de las<br />
poblaciones de delfines que son capturadas incidentalmente en la pesquería de cerco en el OPO. Se<br />
tomaron datos de los estudios de transectos lineales a gran escala sobre la distribución y el tamaño y<br />
composición de manadas de cetáceos para estimar la abundancia de los delfines. Los datos oceanográficos<br />
son recolectados para caracterizar el hábitat y su variación a lo largo del tiempo. Los datos de la<br />
distribución y abundancia de los peces presa y los calamares, las aves marinas, y las tortugas marinas<br />
caracterizan todavía más el ecosistema en el que viven estos delfines. El estudio de 2006 cubrió las<br />
mismas zonas y usó los mismos métodos que los estudios anteriores. Los datos del estudio de 2006<br />
produjeron nuevas estimaciones de abundancia, y se analizaron de nuevo los datos previos para producir<br />
estimaciones revisadas, para 10 especies y/o poblaciones de delfines en el OPO entre 1986 y 2006. Las<br />
estimaciones de 2006 para el delfín manchado nordeste de altamar fueron algo mayores, y para el delfín<br />
tornillo oriental sustancialmente mayores, que aquéllas de los estudios previos en 1998-2000. Las<br />
estimaciones de incremento de estas dos poblaciones mermadas, y del delfín manchado costero mermado,<br />
podrían indicar que se están recuperando, pero la población del delfín manchado de altamar occidentalsureño<br />
podría estar disminuyendo. Las estimaciones de abundancia de 1998-2006 de los delfines<br />
manchado costero, tornillo panza blanca, y de dientes rugosos (Steno bredanensis) mostraron una<br />
tendencia creciente, mientras que aquéllas de los delfines listado (S. coeruleoalba), común de hocico<br />
corto (Delphinus delphis), tonina (Tursiops truncatus), y de Risso (Grampus griseus), fueron<br />
generalmente similares a estimaciones previas obtenidas con los mismos métodos. Ya que NMFS no ha<br />
realizado más estudios desde 2006, durante 2014 y 2015 se realizó un modelado de las tendencias de la<br />
abundancia relativa de delfines usando datos de observadores a bordo de buques cerqueros. Se concluyó<br />
que es poco probable que los índices de abundancia relativa derivados de estos datos sean fiables para<br />
especies directamente asociadas al proceso de pesca (como los delfines en el OPO). Son no sólo<br />
susceptibles a los problemas usuales de cambios en el comportamiento de pesca, sino que también no<br />
existe una distinción clara entre un índice de la asociación atún-delfín y de la abundancia de delfines. Esta<br />
investigación, así como formas<br />
alternativas de dar seguimiento a las<br />
poblaciones de delfines, fue publicada<br />
en 2015.<br />
Científicos del NMFS han calculado<br />
estimaciones de la abundancia de varias<br />
otras especies de mamíferos marinos a<br />
partir de datos de cruceros de<br />
investigación realizados entre 1986 y<br />
2000 en el OPO. De las especies no<br />
afectadas significativamente por la<br />
pesquería atunera, las ballenas piloto de<br />
aletas cortas (Globicephala<br />
macrorhynchus) y tres poblaciones de<br />
delfines comunes presentaron<br />
tendencias crecientes en abundancia<br />
durante esos 15 años. La mayor<br />
abundancia aparente de estos mamíferos<br />
podría haber causado una disminución<br />
en la capacidad de carga del OPO para<br />
TAB<strong>LA</strong> 1. Mortalidad de delfines y otros mamíferos<br />
marinos ocasionada por la pesca en el OPO durante 2015.<br />
Especie y población<br />
Mortalidad incidental<br />
número toneladas<br />
Delfín manchado de altamar<br />
Nororiental 191 12.5<br />
Occidental/sureño 158 10.3<br />
Delfín tornillo<br />
Oriental 196 8.7<br />
Panza blanca 139 8.4<br />
Delfín común<br />
Norteño 43 3.0<br />
Central 21 1.5<br />
Sureño 12 0.8<br />
Otros mamíferos* 5 0.3<br />
Total 765 45.5<br />
*“Otros mamíferos" incluye las siguientes especies y poblaciones, con las<br />
mortalidades observadas correspondientes: delfines no identificados 5<br />
(0.3 t).
165<br />
otros depredadores que comparten su dieta, entre ellos el delfín manchado. La abundancia estimada de la<br />
ballena de Bryde (Balaenoptera edeni) también aumentó, pero coinciden muy poco las dietas de estas<br />
ballenas barbadas y de los depredadores de alto nivel afectados por las pesquerías. La abundancia<br />
estimada del delfín listado (Stenella coeruleoalba) no demostró ninguna tendencia clara a lo largo del<br />
tiempo, y las estimaciones de abundancia del cachalote (Physeter macrocephalus) tendieron a disminuir<br />
durante 1986-2000.<br />
Ciertos mamíferos marinos son afectados adversamente por la reducción en la disponibilidad de<br />
alimento durante eventos de El Niño, especialmente en ecosistemas costeros. Ejemplos<br />
documentados incluyen delfines y pinnípedos frente a Perú, pinnípedos en las Islas Galápagos, y<br />
ballenas de Bryde frente a Perú. Las ballenas grandes pueden desplazarse en reacción a cambios en la<br />
productividad y distribución de sus presas.<br />
2.6. Tortugas marinas<br />
Las tortugas marinas son capturadas en los palangres cuando toman el cebo en los anzuelos, se traban al<br />
dar accidentalmente con un anzuelo, o se enredan en una línea. Hay pocas estimaciones de la mortalidad<br />
incidental de tortugas causada por la pesca con palangre o red de trasmalle. En la cuarta reunión del<br />
Grupo de Trabajo sobre Captura Incidental de la CIAT en enero de 2004 se informó que la captura<br />
incidental de tortugas en la pesquería palangrera japonesa en el OPO en 2000 consistió de 166 tortugas<br />
laúd (Dermochelys coriacea), de las cuales 25 estaban muertas, y unas 6,000 tortugas de todas las otras<br />
especies, principalmente golfinas (Lepidochelys olivacea), de las cuales aproximadamente la mitad estaba<br />
muerta. En la sexta reunión del Grupo de Trabajo en febrero de 2007, se informó que la flota española de<br />
palangre de superficie que pesca pez espada en el OPO tuvo en promedio 65 interacciones y 8 mortalidades<br />
por millón de anzuelos durante 1990-2005. Es probable que las tasas de mortalidad sean similares para otras<br />
flotas que pescan atún patudo, y posiblemente mayores que aquéllas flotas que pescan albacora y pez espada a<br />
menor profundidad. Unos 23 millones de los 200 millones de anzuelos calados cada año en el OPO por buques<br />
palangreros de aguas lejanas están dirigidos hacia el pez espada en palangres poco profundos.<br />
Además, hay una flota considerable de buques palangreros artesanales que pescan atunes, peces picudos,<br />
tiburones y dorado (Coryphaena spp.) en el OPO. Desde 2005, miembros del personal de la CIAT y de<br />
otras organizaciones, junto con los gobiernos de varias naciones costeras de Latinoamérica, han<br />
participado en un programa para reducir las tasas de enganche y la mortalidad de tortugas marinas en<br />
estas pesquerías. En la sección 8.2 se presenta información adicional sobre este programa.<br />
Las tortugas marinas son capturadas ocasionalmente en redes de cerco en la pesquería atunera del OPO.<br />
La mayoría de las interacciones ocurren cuando las tortugas se asocian con objetos flotantes, y son<br />
capturados cuando el objeto es cercado; en otros casos, una red calada alrededor de un cardumen de<br />
atunes no asociados, o un cardumen asociado con delfines, captura tortugas marinas que están presentes.<br />
La tortuga golfina es, por mucho, la especie de tortuga marina capturada con mayor frecuencia por buques<br />
cerqueros; la siguen la tortuga verde (Chelonia mydas), y, muy ocasionalmente, las tortugas caguama<br />
(Caretta caretta) y carey (Eretmochelys<br />
imbricata). Desde 1990, cuando los<br />
observadores de la CIAT comenzaron a<br />
registrar esta información, hasta 2015,<br />
inclusive, se ha registrado mortalidad de<br />
solamente tres tortugas laúd. Algunas<br />
tortugas no son identificadas por estar<br />
demasiado lejos del buque o porque no<br />
había suficiente luz para permitir al<br />
observador identificarla. A veces las<br />
tortugas marinas se enredan en malla<br />
debajo de dispositivos agregadores de<br />
TAB<strong>LA</strong> 2. Mortalidades de tortugas ocasionadas por buques<br />
cerqueros grandes en el OPO en 2015.<br />
Tipo de lance Total<br />
OBJ NOA DEL<br />
Golfina 2 - 1 3<br />
Verde del Pacífico oriental - - - -<br />
Caguama - - - -<br />
Carey - - - -<br />
Laúd - - - -<br />
No identificada - 4 - 4<br />
Total 2 4 1 7
166<br />
peces (plantados) y se ahogan. En unos pocos casos, son sacadas del agua por el aparejo de pesca<br />
mientras están enmalladas, y pueden caer de la red de alturas considerables y ser heridas, o ser pasadas<br />
por la pasteca hidráulica. En la Tabla 2 se presentan las estimaciones preliminares de la mortalidad de<br />
tortugas, en número, causada por buques cerqueros grandes durante 2015, por tipo de lance (sobre objetos<br />
flotantes (OBJ), atunes no asociados (NOA), y delfines (DEL)).<br />
La pesca atunera de cerco es probablemente una causa de mortalidad de tortugas marinas menos<br />
importante que otros tipos de actividad humana, entre ellas el aprovechamiento de huevos y adultos,<br />
utilización de playas, contaminación, enmalle en detritos en el mar, ingestión de los mismos, y los<br />
impactos de otras pesquerías.<br />
Las poblaciones de tortugas golfina y caguama son clasificadas como vulnerables, las de las tortugas<br />
verde y caguama están designadas como en peligro, y las de carey y laúd como en peligro crítico, por la<br />
Unión Mundial para la Conservación de la Naturaleza (IUCN).<br />
2.7. Tiburones y otros peces grandes<br />
Los tiburones y otros peces grandes son capturados por buques cerqueros y palangreros. El tiburón sedoso<br />
o jaquetón (Carcharhinus falciformis) es la especie de tiburón capturada con mayor frecuencia en la<br />
pesquería de cerco. Las pesquerías palangreras también capturan tiburones sedosos. Es necesario un<br />
análisis de la pesca palangrera cerquera para estimar el impacto de la pesca sobre las poblaciones.<br />
Entre mayo de 2007 y junio de 2008 científicos de la CIAT y del NMFS realizaron un proyecto para<br />
obtener y archivar muestras de tejido de tiburones, rayas y otros peces grandes, para análisis genéticos. Se<br />
están usando los datos de las muestras archivadas en estudios de la estructura de las poblaciones de estos<br />
grupos a gran escala, información esencial para las evaluaciones de las poblaciones y que falta<br />
generalmente en todo el Océano Pacífico. Los resultados preliminares de un análisis del tiburón sedoso<br />
indicaron que, para los fines de la ordenación, los tiburones sedosos en el OPO deberían ser divididos en<br />
dos poblaciones, una al norte y la otra al sur de la línea ecuatorial. Además, los resultados de un estudio<br />
de ADN mitocondrial en 2013 señalan una ligera divergencia genética entre los tiburones sedosos del<br />
Pacífico occidental y oriental, lo cual apoya una ordenación separada de estas dos poblaciones.<br />
Existen evaluaciones de las poblaciones de tan sólo cuatro especies de tiburones en el OPO: sedoso, azul<br />
(Prionace glauca), marrajo (Isurus oxyrinchus) y zorro común (Alopias vulpinus). Se ignoran los<br />
impactos de las capturas incidentales sobre las poblaciones de otras especies de tiburones en el OPO. Se<br />
intentó realizar una evaluación de la población del tiburón sedoso durante el período de 1993-2010<br />
usando el modelo Stock Synthesis. Desgraciadamente, el modelo no pudo ajustar el índice principal de<br />
abundancia adecuadamente, y por lo tanto los resultados no fueron fiables, ya que las tendencias relativas<br />
y la escala absoluta están comprometidas en la evaluación. Se presentan los resultados en el<br />
Documento SAC-05 INF-F. Se estima que la mayoría de las capturas de tiburones sedosos en el OPO son<br />
realizadas por palangreros, algunos de los cuales dirigen su esfuerzo hacia los tiburones. Como alternativa<br />
a los modelos convencionales de evaluación de poblaciones, en el Documento SAC-05-11a se presenta<br />
una serie de posibles indicadores de condición (o estabilidad) de población (SSI) que podrían ser<br />
considerados para la ordenación de las poblaciones del norte y del sur del tiburón sedoso en el OPO. En el<br />
documento SAC-06-08b se presentan SSI basados en la captura de tiburones sedosos por unidad de<br />
esfuerzo (CPUE) estandarizada en lances cerqueros sobre objetos flotantes (CPUE-OBJ) durante 1994-<br />
2014. Los resultados en el documento señalan una reducción aparente de las tasas de captura incidental en<br />
todas las clases de tamaño al norte de la línea ecuatorial. En el caso de la población del sur, las tasas de<br />
captura disminuyeron de forma importante. No se han desarrollado puntos de referencia objetivo y límite<br />
para el tiburón sedoso con base en estos indicadores. Tampoco se han desarrollado y probado reglas de<br />
control de extracción. En este momento, los indicadores no pueden ser usados directamente para<br />
determinar la para determinar condición de la población ni para establecer límites de captura.
167<br />
Una evaluación de la población del tiburón azul en el Océano Pacífico norte fue realizada por científicos<br />
del grupo de trabajo sobre tiburones del ISC en 2014. El informe manifiesta que “Los resultados del<br />
modelo de caso de referencia señalaron que la biomasa de la población estaba cerca de la máxima de la<br />
serie de tiempo en 1971, disminuyó a su nivel mínimo entre fines de los años 1980 y principios de los<br />
1990, y subsecuentemente aumentó paulatinamente y se estabilizó en una biomasa similar a aquella del<br />
principio de la serie de tiempo.”<br />
El grupo de trabajo sobre tiburones del ISC realizó una nueva evaluación de los tiburones zorro en<br />
2015. El informe reconoció las limitaciones de los datos disponibles para esta especie y la falta de<br />
información de pesquerías importantes. Por lo tanto, la condición de la población (padeciendo<br />
sobrepesca y sobrepescada) de los tiburones zorro en el Océano Pacífico norte queda por determinar.<br />
Científicos de NMFS realizaron una evaluación de la población del tiburón zorro común a lo largo del<br />
litoral occidental de Norteamérica. Sus resultados indican que es poco probable que esta población esté<br />
sobrepescada ni padeciendo sobrepesca. La población pasó por una reducción relativamente grande y<br />
rápida a fines de los años 1970 y principios de los 1980, poco después del comienzo de la pesquería<br />
estadounidense de pez espada y tiburón con redes agalleras a la deriva, con la reducción del desove<br />
decayendo a 0.4 en 1985. La población pareció haberse estabilizado a mediados de los años 1980 tras la<br />
imposición de reglamentos sustanciales. Durante los últimos 15 años, la población empezó a recuperarse<br />
relativamente rápidamente y se encuentra actualmente cerca de un nivel no explotado.<br />
En la Tabla 3 se presentan las estimaciones preliminares de las capturas (incluidos los descartes de la<br />
pesquería de cerco), en toneladas, de tiburones y otros peces grandes en el OPO durante 2015 (aparte de<br />
aquéllos mencionados en lo anterior) por buques cerqueros grandes. No se dispone de datos completos de<br />
buques cerqueros pequeños, palangreros y otros.<br />
Las tasas de captura de especies aparte de los atunes en la pesquería cerquera son diferentes para cada tipo<br />
de lance. Con unas pocas excepciones, las tasas de captura incidental son máximas en lances sobre objetos<br />
flotantes, seguidos por lances no asociados y, en un nivel mucho más bajo, lances sobre delfines. Las tasas<br />
de captura incidental de delfines son máximas en lances sobre delfines, seguidos por lances no asociados y,<br />
en un nivel mucho más bajo, lances sobre objetos flotantes. En general, las tasas de captura incidental de<br />
rayas (Mobulidae), y mantarrayas (Dasyatidae) son máximas en lances no asociados, seguidos por lances<br />
sobre delfines, y mínimas en lances sobre objetos flotantes, aunque 2014 es una excepción. Debido a estas<br />
diferencias, es necesario seguir los cambios en la frecuencia de los distintos tipos de lance para poder<br />
interpretar los cambios en los datos de captura incidental. En la Tabla A-7 del Documento SAC-06-03 se<br />
detalla el número estimado de lances cerqueros de cada tipo realizados durante 1999-2014 en el OPO.<br />
TAB<strong>LA</strong> 3. Capturas, en toneladas, de tiburones y otros peces grandes, por buques cerqueros grandes con<br />
observador a bordo en el OPO, 2015<br />
Tipo de lance<br />
OBJ NOA DEL<br />
Total<br />
Tiburón sedoso o jaquetón (Carcharhinus falciformis) 541 133 48 722<br />
Tiburón oceánico punta blanca (C. longimanus) 3
168<br />
La reducción de la captura incidental es una meta de la ordenación pesquera ecosistémica. Un estudio<br />
publicado recientemente analizó la proporción de captura incidental a captura objetivo, en una gama de<br />
tamaños de lance. El estudio demostró que la proporción de captura incidental total a captura de atún y<br />
captura incidental de tiburón sedoso disminuyó a medida que aumentó el tamaño de lance. La proporción<br />
de captura incidental fue máxima en lances que capturan menos de 20 t.<br />
En octubre de 2006, el NMFS convocó una reunión técnica sobre la reducción de la captura incidental en<br />
la pesquería de cerco en el OPO. Los asistentes apoyaron una propuesta de investigación de métodos para<br />
reducir la captura incidental de los tiburones, alejándolos de los objetos flotantes antes de calar la red.<br />
Apoyaron también una serie de experimentos de campo sobre aparejos y técnicas para reducir la captura<br />
incidental; incluirían modificación y manipulación de los plantados, una evaluación de indicadores de<br />
comportamiento y fisiológicos de estrés, y sacar los animales vivos de la red y de la cubierta (por<br />
ejemplo, rejas clasificadoras, puertas de burbujas, y bombas de vacío). Una tercera idea fue usar los datos<br />
de la CIAT para determinar si los factores espaciales, temporales, y ambientales pueden ser usados para<br />
predecir las capturas incidentales en los lances sobre plantados y para determinar en cuál grado las vedas<br />
de temporada o zona serían eficaces para reducir dichas capturas incidentales.<br />
Científicos en la Universidad de Washington realizaron un análisis de la frecuencia temporal de zonas de<br />
captura incidental elevada del tiburón sedoso en los lances cerqueros sobre objetos flotantes, el cual será<br />
útil para determinar la eficacia de las vedas de tiempo y zona como método de reducción de la captura<br />
incidental de tiburones. Los resultados señalan que tanto las predicciones del modelo como los datos<br />
observados suelen indicar que la frecuencia de estas capturas incidentales fue máxima al norte de 4°N y al<br />
oeste de 100-105°O. Sin embargo, debido a las grandes capturas de atún al sur de 5°N, se lograría la<br />
mayor reducción de esta captura incidental con la menor pérdida de captura de atún al norte de<br />
aproximadamente 6°N.<br />
El dorado (Coryphaena hippurus) es una de las especies más importantes capturadas en las pesquerías<br />
artesanales de las naciones costeras del OPO. Es también capturado incidentalmente en la pesquería<br />
atunera de cerco en el OPO. Bajo la Convención de Antigua y su enfoque ecosistémico a la pesca, es por<br />
lo tanto apropiado que el personal de la CIAT estudie la especie, con miras a determinar el impacto de la<br />
pesca, y recomendar medidas de conservación apropiadas para este importante recurso en caso necesario.<br />
En este contexto, algunos Miembros de la CIAT costeros de la región han solicitado que se realice una<br />
investigación colaborativa con el personal de la CIAT para poder contar con información científica sólida<br />
para este propósito.<br />
La CIAT celebró su primera reunión técnica sobre el dorado en 2014. La reunión tuvo tres objetivos: 1)<br />
promover la sinergia en los Miembros de la CIAT para una investigación regional del dorado en el OPO;<br />
2) revisar la situación actual con respecto a los conocimientos del dorado e identificar los conjuntos de<br />
datos disponibles en las pesquerías/regiones del OPO; y 3) formular un plan de investigación colaborativa<br />
futura. Hasta la fecha, este esfuerzo colaborativo incluye: análisis de las estadísticas de captura<br />
comerciales disponibles, mejora de los programas de recolección de datos de campo, investigación de<br />
tendencias estacionales, e identificación de unidades de pesca. Además, se está analizando los datos de<br />
pesca de dorado disponibles de los Miembros de la CIAT y otras naciones a fin de desarrollar indicadores<br />
de condición de población (SSI) que potencialmente podrían formar una base para un asesoramiento sobre<br />
la ordenación de la especie en el OPO (ver SAC-05-11b). Se continuó el trabajo en 2015, y se celebró una<br />
segunda reunión técnica con el objetivo de abordar dos preguntas importantes: 1) ¿cuáles supuestos<br />
acerca de la estructura de la población es razonable considerar para la ordenación regional del dorado en<br />
el OPO? y 2) ¿cuáles indicadores de condición de población deberían ser vigilados para proporcionar<br />
asesoramiento científico para una ordenación regional?
169<br />
3. OTRA FAUNA<br />
3.1. Aves marinas<br />
Hay aproximadamente 100 especies de aves marinas en el OPO tropical. Algunas aves marinas se asocian<br />
a depredadores epipelágicos cerca de la superficie del agua, tales como peces (especialmente atunes) y<br />
mamíferos marinos. Estos depredadores arrean a las presas a la superficie para atraparles en la interfaz<br />
entre el agua y el aire, donde las aves las pueden alcanzar. La mayoría de las especies de aves marinas<br />
capturan sus presas a menos de medio metro de la superficie del mar o en el aire (peces voladores<br />
(Exocoetidae) y calamares (principalmente Ommastrephidae)). Los depredadores subsuperficiales causan<br />
que las aves puedan conseguir las presas más fácilmente no sólo al arrearlas a la superficie, sino también<br />
al herirlas o desorientarlas y al dejar restos después de alimentarse de presas grandes. Las oportunidades<br />
de alimentación de algunas especies de aves marinas dependen de la presencia de cardúmenes de atunes<br />
alimentándose cerca de la superficie.<br />
Las aves marinas son afectadas por la variabilidad del ambiente oceánico. Durante el Niño de 1982-1983,<br />
las poblaciones de aves marinas en todo el Océano Pacífico tropical y noreste padecieron fracasos de<br />
reproducción y mortalidades masivas, o migraron a otros lugares en busca de alimento. Algunas especies,<br />
empero, aparentemente no son afectadas por eventos de El Niño. En general, las aves marinas que se<br />
alimentan en las zonas de afloramiento del OPO tropical y la Corriente de Perú padecen fracasos de<br />
reproducción y mortalidades debido a falta de alimento durante eventos de El Niño, mientras que aquéllas<br />
que se alimentan en zonas menos afectadas por El Niño podrían resultar relativamente ilesas.<br />
Según el Report of the Scientific Research Program under the U.S. International Dolphin Conservation<br />
Program Act (Informe del Programa de Investigación Científica bajo la Ley sobre el Programa Internacional<br />
para la Conservación de los Delfines de EE.UU.), preparado por el NMFS en septiembre de 2002, no hubo<br />
tendencias temporales significativas en las estimaciones de abundancia del período de 1986-2000 de ninguna<br />
especie de ave marina en el OPO tropical, excepto una tendencia decreciente en caso del petrel de Tahití<br />
(Pseudobulweria rostrata). Se están revisando la condición y las tendencias de las poblaciones de albatros de<br />
las Galápagos (Phoebastria irrorata), patinegro (P. nigripes), y de Laysan (P. immutabilis).<br />
Algunas aves marinas, especialmente los albatros y petreles, son susceptibles a la captura en los anzuelos<br />
cebados en las pesquerías palangreras pelágicas. Datos de rastreo por satélite y de observaciones en el<br />
mar han identificado la importancia del Área de la CIAT para los albatros de las Galápagos, de Laysan, y<br />
ojeroso (Thalassarche melanophrys), más varias especies que se crían en Nueva Zelanda pero que se<br />
alimentan frente a Sudamérica. El albatros de las Galápagos es motivo de preocupación especial, por ser<br />
endémico del OPO y anidar únicamente en Galápagos. Los datos de observadores en buques artesanales<br />
no indicaron interacciones del albatros de Galápagos con las faenas de pesca de estos buques. Los datos<br />
de la pesquería palangrera pelágica de EE.UU. in el Pacífico nordeste indican que ocurren capturas<br />
incidentales de albatros patinegro y de Laysan. Se dispone de pocos datos comparables de las pesquerías<br />
palangreras en el Pacífico central y sudeste. En la sexta reunión del Grupo de Trabajo en febrero de 2007,<br />
se informó que la flota española de palangre de superficie que pesca pez espada en el OPO tuvo en<br />
promedio 40 interacciones con aves marinas por millón de anzuelos durante 1990-2005, casi todas de las<br />
cuales resultaron en mortalidad. En 2007, el Grupo de Trabajo sobre Evaluaciones de Poblaciones de la<br />
CIAT identificó áreas de vulnerabilidad a la pesca industrial de palangre para varias especies de albatros,<br />
y propuso medidas de mitigación. Ver también la sección 9.3.<br />
3.2. Alimento<br />
Los grupos taxonómicos de alimento que ocupan los niveles tróficos medios en el OPO son obviamente<br />
componentes importantes del ecosistema, formando un vínculo entre los productores primarios en la base<br />
de la red trófica y los depredadores de nivel trófico superior, como los atunes y peces picudos. Los efectos<br />
indirectos sobre estos depredadores causados por la variabilidad ambiental son transmitidos a los niveles<br />
tróficos superiores por medio de los grupos taxonómicos de alimento. Sin embargo, se sabe poco acerca
170<br />
de las fluctuaciones en abundancia de la gran variedad de especies de presas en el OPO. Científicos del<br />
NMFS registraron datos sobre la distribución y abundancia de grupos de presas comunes, entre ellos<br />
peces linterna (Myctophidae), peces voladores, y ciertos calamares, en el OPO tropical durante 1986-1990<br />
y 1998-2000. Las estimaciones de abundancia media de todos los grupos taxonómicos de peces, y en<br />
menor grado los calamares, aumentaron durante 1986-1990; fueron bajas de nuevo en 1998, y luego<br />
aumentaron hasta 2000. Su interpretación de este patrón fue que los eventos de El Niño en 1986-1987 y<br />
1997-1998 ejercieron efectos negativos sobre estas poblaciones de presas. Durante los cruceros STAR de<br />
NMFS en 2003 y 2006 se obtuvieron más datos sobre estos grupos taxonómicos.<br />
Una investigación reciente por un científico de NMFS se enfocó en la evaluación del uso de hábitat de<br />
varias familias de peces mesopelágicos en varias etapas de vida en el OPO para ayudar a comprender su<br />
rol en el ecosistema. El trabajo incluyó también una descripción de cambios ontogénicos en abundancia y<br />
distribución horizontal de larvas de especies mesopelágicas comunes los afectados por el evento de El<br />
Niño en 1997-1998, seguida por una Niña en el área del estudio de la California Cooperative Oceanic<br />
Fisheries Investigations (CalCOFI). Dentro de la región de muestreo de CalCOFI, los peces<br />
mesopelágicos (dos especies de mictófidos y una de fosictíidos) con una afinidad para condiciones de<br />
agua cálida tenían una abundancia larval mayor y estuvieron más cerca de la costa durante el Niño, y<br />
fueron menos abundantes y estuvieron más lejos de la costa durante la Niña. El patrón contrario fue<br />
observado generalmente para los peces mesopelágicos (tres especies de capellanes y cuatro especies de<br />
mictófidos) con afinidad para condiciones de agua fría.<br />
Los cefalópodos, especialmente los calamares, desempeñan un papel central en la mayoría de las redes<br />
alimenticias pelágicas marinas al conectar las biomasas masivas de micronecton, particularmente los<br />
peces mictófidos, con muchos depredadores oceánicos. En vista del alto flujo trófico que pasa por la<br />
comunidad de calamares, se cree importante un esfuerzo investigativo concertado sobre los calamares<br />
para comprender su papel como presa y depredador clave. En 2013, se dedicó un volumen especial de la<br />
revista Deep Sea Research II, Topical Studies in Oceanography (Vol. 5) al papel de los calamares en los<br />
ecosistemas pelágicos. El volumen cubre cinco áreas principales de investigación: calamares como presas,<br />
calamares como depredadores, el papel de los calamares en los ecosistemas marinos, fisiología, cambio<br />
climático, y el calamar de Humboldt o gigante (Dosidicus gigas) como ejemplo reciente de plasticidad<br />
ecológica en una especie de cefalópodo.<br />
El tamaño y la distribución geográfica de las poblaciones del calamar de Humboldt en el OPO han<br />
aumentado en los últimos años. Por ejemplo, extendió su distribución geográfica al norte a las aguas<br />
frente a Alta California central desde 2002 hasta mediados de 2010. Además, en 2002 los observadores en<br />
buques atuneros de cerco reportaron incrementos de las capturas incidentales de la especie con los atunes,<br />
principalmente el barrilete, frente al Perú. Las etapas juveniles de este calamar constituyen una presa<br />
común de los atunes aleta amarilla y patudo, y de otros peces depredadores, y el calamar de Humboldt es<br />
también un depredador voraz de peces pequeños y de cefalópodos en toda su zona de distribución. Han<br />
sido observados atacando a los atunes aleta amarilla y barrilete en una red de cerco. Estos calamares no<br />
sólo han afectado los ecosistemas a los cuales se han expandido, sino que se piensa que son capaces de<br />
afectar la estructura trófica en las regiones pelágicas. Cambios en la abundancia y distribución geográfica<br />
del calamar de Humboldt podrían afectar el comportamiento de alimentación de los atunes y otros<br />
depredadores, cambiando quizá su vulnerabilidad a la captura.<br />
Algunos peces pequeños, muchos de los cuales son alimento para los depredadores más grandes, son<br />
capturados por buques cerqueros en el OPO. Las melvas (Auxis spp.), por ejemplo, son presas comunes<br />
de muchos de los animales que ocupan los niveles tróficos superiores en el OPO tropical. En el modelo<br />
del ecosistema del OPO tropical (Sección 7), las melvas forman el 10% a más de la dieta de ocho especies<br />
o grupos de depredadores. Pequeñas cantidades de melvas son capturadas por buques cerqueros en alta<br />
mar, y por pesquerías artesanales locales en algunas regiones costeras de América Central y del Sur. La<br />
gran mayoría de las melvas capturadas por buques atuneros de cerco es descartada en el mar. En la Tabla<br />
4 se presentan las estimaciones preliminares de las capturas (incluidos los descartes de la pesca de cerco),
171<br />
TAB<strong>LA</strong> 4. Capturas de peces pequeños, en toneladas, por buques cerqueros grandes con observador a<br />
bordo en el OPO, 2015<br />
Tipo de lance<br />
OBJ NOA DEL<br />
Total<br />
Peces ballesta (Balistidae) y cachúas (Monacanthidae) 141 4
172<br />
Históricamente, los conocimientos de la ecología trófica de los peces depredadores se basaron en análisis<br />
del contenido de los estómagos y, más recientemente, en indicadores químicos. Los depredadores<br />
pelágicos grandes son considerados muestreadores eficaces de los organismos micronécticos, que son mal<br />
muestreados por redes y arrastres. Los estudios de las dietas han descubierto muchos de los vínculos<br />
tróficos clave en el OPO pelágico, y han formado la base para la representación de las interacciones de las<br />
red de alimentación en un modelo de ecosistema (Boletín de la CIAT, Vol. 22, No. 3) para explorar los<br />
efectos indirectos de la pesca sobre el ecosistema. Por ejemplo, estudios en las décadas de 1990 y 2000<br />
descubrieron que la presa más común de los atunes aleta amarilla capturados por buques cerqueros en alta<br />
mar fue las melvas (Auxis spp.), el cangrejo rojo (Pleuroncodes planipes), calamares de Humboldt, un pez<br />
mesopelágico (Vinciguerria lucetia), y varios peces epipelágicos. El atún patudo se alimenta a mayor<br />
profundidad que el aleta amarilla y barrilete, y consume principalmente cefalópodos y peces<br />
mesopelágicos. Se informó, a fines de los años 1950, que la presa más importante del barrilete fue, en<br />
general, los crustáceos eufásidos mientras que a principios de los 1990 el pequeño pez mesopelágico<br />
Vinciguerria lucetia pareció predominar en la dieta. Los atunes que se alimentan cerca de la costa utilizan<br />
a menudo presas diferentes a aquéllos capturados mar afuera.<br />
Los estudios históricos de la dieta de los atunes en el OPO se basaban en datos cualitativos de pocas<br />
muestras, con poca o ninguna indicación de la importancia relativa de las presas. Los estudios<br />
contemporáneos, en cambio, usan índices de dieta, típicamente importancia por volumen o peso,<br />
importancia numérica, y frecuencia de presencia de presas, para cuantificar la composición de la dieta, a<br />
menudo en conjunto con indicadores químicos, tales como análisis de isótopos estables y ácidos grasos.<br />
Un capítulo titulado “Bioenergética, ecología trófica, y separación por nichos de los atunes” será<br />
publicado en 2016 en el serial Advances in Marine Biology. Resume los conocimientos actuals de la<br />
bioenergética y dinámica alimenticia de los atunes a escala global, con énfasis en los atunes aleta<br />
amarilla, patudo, barrilete, albacora, y aleta azul del Atlántico en siete océanos o regiones oceánicas. El<br />
consumo de alimento contrapesa los gastos bioenergéticos de la respiración, crecimiento (incluida la<br />
producción de gónadas), acción dinámica específica, egestión, y excreción. Cada especie de atún parece<br />
tener una estrategia de alimentación generalizada, en el sentido que sus dietas fueron caracterizadas por<br />
una alta diversidad de presas y una baja abundancia general de tipos de presa individual. Las diferencias<br />
ontogenéticas y espaciales en las dietas son sustanciales, y se han observado cambios interdecadales<br />
importantes en la composición de las presas. Cambios de dieta de presas grandes a pequeñas subrayan<br />
cambios a escala ecosistémica en la disponibilidad y diversidad de presas, y tienen implicaciones para<br />
cambios en los requisitos bioenergéticos a futuro. La falta de datos a largo plazo limita la capacidad de<br />
predecir los impactos del cambio climático sobre el comportamiento de alimentación de los atunes, y<br />
existe por lo tanto la necesidad de una recolección sistemática de datos de alimentación como parte del<br />
monitoreo rutinario de estas especies.<br />
Se han desarrollado nuevos métodos estadísticos para analizar datos complejos y multivariables de<br />
contenido de estómagos mediante una colaboración internacional, Climate Impacts on Oceanic Top<br />
Predators-Integrated Marine Biogeochemistry and Ecosystem Research (CLIOTOP-IMBER), grupo de<br />
trabajo 3 (Rutas tróficas en ecosistemas del océano abierto), para evaluar la trofodinámica de los<br />
depredadores ápice marinos. Esta metodología parece prometedora para el análisis de relaciones<br />
biológicas, medioambientales, temporales, y espaciales en un marco de modelado de árbol de<br />
clasificación que predice la composición de las presas de los depredadores. Dos estudios recientes del<br />
atún aleta amarilla y el tiburón sedoso en el OPO, comentados a continuación, usaron esta metodología<br />
para inferir cambios espaciales (aleta amarilla y tiburón sedoso) y temporales (aleta amarilla) basados en<br />
datos de contenido de estómagos. En 2015, el grupo de trabajo logró avances en un análisis global de las<br />
dietas de los atunes aleta amarilla, patudo, y albacora, usando el método de árbol clasificador para evaluar<br />
si se pueden usar análisis espaciales para formar hipótesis sobre la depredación en un océano más cálido.<br />
Se incluyeron en este análisis datos de dieta de atunes aleta amarilla y patudo capturados en la pesquería<br />
de cerco en el OPO.
173<br />
Las muestras de estómago de un depredador generalista ubicuo, como el atún aleta amarilla, pueden ser<br />
usadas para inferir cambios en las poblaciones de presas mediante la identificación de cambios en el<br />
comportamiento de alimentación a lo largo del tiempo. Las poblaciones de presas que soportan<br />
depredadores de alto nivel varían a lo largo del tiempo (ver 3.2 Alimento), y algunas presas ejercen una<br />
presión de depredación considerable sobre los animales que ocupan los niveles tróficos más bajos<br />
(incluyendo las primeras etapas de vida de peces grandes). Un análisis exhaustivo de la depredación por<br />
el atún aleta amarilla a escala decadal en el OPO fue completado en 2013. Se tomaron muestras de 6,810<br />
peces capturados en 433 lances cerqueros durante dos periodos de dos años separados por una década.<br />
Simultáneamente, reducciones generalizadas de la producción biológica, cambios en la composición de<br />
las comunidades de fitoplancton, y una expansión vertical e intensificación de la zona de oxígeno mínimo<br />
parecieron modificar las redes alimenticias en los océanos tropicales y subtropicales (ver 5. Ambiente<br />
físico). Se usó un enfoque de árbol de clasificación modificado, antes mencionado, para analizar<br />
covariables espaciales, temporales, ambientales, y biológicas que explican los patrones de depredación<br />
del aleta amarilla durante 1992-1994 y 2003-2005. En el caso de la mayoría de la población de aleta<br />
amarilla en el OPO fue aparente un cambio importante en la dieta durante la década. Los peces fueron<br />
más abundantes (en peso) a principios de los años 1990, mientras que los cefalópodos y crustáceos<br />
predominaron una década más tarde. Como grupo, los peces epipelágicos disminuyeron del 82% de la<br />
dieta en 31%, mientras que las especies mesopelágicas aumentaron de 9% a 29% durante la década.<br />
Gráficas espaciales de dependencia parcial señalaron expansiones de la distribución de Vinciguerria<br />
lucetia, el calamar de Humboldt (Dosidicus gigas), y el cangrejo Pleuroncodes planipes, reducciones de<br />
la distribución de melvas (Auxis spp.) y Lactoria diaphana, y una desaparición casi completa de Cubiceps<br />
spp. de la dieta. Los datos de las tasas de depredación sugiere que las biomasas de V. lucetia y D. gigas<br />
aumentaron en la primera mitad de la década de 2000 y que la distribución de D. gigas aparentemente se<br />
extendió mar afuera además de hacia el norte y el sur (ver 3.2 Alimento).<br />
Las representaciones de la red alimenticia que forman la base de los modelos ecosistémicos son<br />
generalmente altamente generalizados, y no toman en cuenta la variabilidad espacial y temporal. A fin de<br />
mejorar los conocimientos del papel del tiburón sedoso en el ecosistema, se realizó en 2014 un análisis de<br />
la variabilidad especial, basado en el contenido de los estómagos de 289 tiburones sedosos capturados<br />
incidentalmente en lances sobre objetos flotantes, principalmente dispositivos agregadores de peces<br />
(plantados) flotando a la deriva, en la pesquería atunera de cerco en el OPO. El conjunto de datos es<br />
novedoso porque es difícil obtener datos biológicos de tiburones carcarínidos del océano abierto, y porque<br />
incluye datos de tiburones sedosos capturados en una región amplia del OPO tropical. Los resultados de<br />
las metodologías de árbol de clasificación y la regresión de cuantiles sugieren que el tiburón sedoso es un<br />
depredador oportunista que se alimenta de una variedad de presas. Las covariables a escala amplia<br />
espaciales y de tamaño de tiburón explicaron los hábitos alimenticios del tiburón sedoso. Se descubrió un<br />
cambio espacial fuerte en la dieta, con patrones de alimentación distintos en las regiones oriental (costera)<br />
y occidental (alta mar). Se observaron proporciones mayores de presas asociadas a plantados que de<br />
presas no asociadas a plantados en la dieta en todo el OPO, pero especialmente en la región de alta mar.<br />
Los atunes aleta amarilla y tiburones sedosos compartieron algunos de los mismos recursos de presas<br />
durante los dos bienios separados por una década, por ejemplo, calamar de Humboldt, peces voladores,<br />
Jacques y pampanos, y tetraodontiformes. Al igual que en el caso del aleta amarilla, es probable que los<br />
factores espaciales y temporales jueguen un papel en la determinación de los hábitos de depredación del<br />
tiburón sedoso, pero las muestras fueron insuficientes para comprobar si la dieta de los tiburones ha<br />
cambiado a lo largo del tiempo. El análisis produjo una descripción exhaustiva de la depredación por el<br />
tiburón sedoso en el OPO, al mismo tiempo que demostró la necesidad de una mayor cobertura de<br />
muestreo espacial y temporal, y presente información importante sobre el componente dinámico de las<br />
interacciones tróficas del tiburón sedoso, que puede ser usada para mejorar los modelos ecosistémicos en<br />
el futuro.
174<br />
Se usan datos de interacciones depredador-presa de atunes aleta amarilla, patudo, y albacora, reunidos<br />
durante un periodo de 40 años de los océanos Pacífico, Índico, y Atlántico, para evaluar de forma<br />
cuantitativa los patrones tróficos amplios a macro escala en los ecosistemas pelágicos. La compilación de<br />
estos datos, que representan más de 10,000 depredadores, en una base de datos global fue un primer paso<br />
crítico y sustentó los análisis. Un método de árbol clasificador modificado señaló diferencias espaciales<br />
significativas y partición de las presas principales consumidas por las tres especies de atún, reflejando<br />
distribuciones regionales de micronecton. Los calamares omastréfidos fueron uno de los grupos de presas<br />
más importantes en todos los océanos para las tres especies de atunes. Modelos aditivos generalizados<br />
mostraron que la diversidad en las dietas fue impulsada principalmente por procesos a escala regional y la<br />
talla de los atunes (59 a 81% de la desviación explicada). En regiones de productividad primaria baja, la<br />
diversidad de la dieta del atún aleta amarilla fue más que el doble de los valores de diversidad en regiones<br />
de productividad alta. Se descubrieron patrones ontogenéticos y espaciales en la diversidad de dietas del<br />
atún patudo, con la diversidad de la dieta de los peces más grandes menos relacionada con los niveles de<br />
producción primaria. La diversidad de la dieta del atún albacora fue globalmente mayor que aquella de los<br />
otros atunes y fue uniformemente alta en todos los océanos excepto en el Mar Mediterráneo oligotrófico.<br />
Estos resultados sugieren que la expansión actual de aguas más cálidas y menos productivas en los<br />
océanos del mundo podría cambiar las oportunidades de alimentación del atún aleta amarilla debido a<br />
cambios en la abundancia regional de los recursos de presas. Debido a la mayor amplitud de<br />
profundidades en las cuales se alimentan los atunes patudo y albacora, es menos probable que estas<br />
especies sean afectadas por cambios en temperatura y otros procesos ambientales en la superficie y en la<br />
capa mixta. Son necesarios estudios de dietas bien diseñados a largo plazo para ecosistemas pelágicos<br />
grandes para probar estas hipótesis preliminares.<br />
Los estudios de ecología trófica se han enfocado en entender redes de alimentación enteras, inicialmente<br />
con descripciones de las conexiones interespecíficas entre las comunidades de depredadores, formadas<br />
por los atunes, tiburones, peces picudos, el dorado, peto, salmón, y otros. En general, es evidente una<br />
repartición considerable de recursos entre los componentes de estas comunidades, y los investigadores<br />
buscan comprender la escala espacial de los patrones tróficos que se pueden observar, así como la<br />
influencia de la variabilidad climática sobre estos patrones. En 2012 se publicó un análisis de la<br />
depredación por un grupo de depredadores ápice (incluyendo tiburones, peces picudos, atunes, y otros<br />
peces y mamíferos) sobre los atunes aleta amarilla y barrilete en el OPO. Las tasas de depredación sobre<br />
el aleta amarilla y barrilete fueron altas para los tiburones y peces picudos, y esos animales consumieron<br />
atunes de una amplia gama de tamaños, incluyendo subadultos capaces de hacer una contribución<br />
importante a la producción reproductora de las poblaciones de atunes. Los atunes tropicales en el OPO<br />
actúan más como mesodepredadores que no depredadores ápice.<br />
Mientras que los estudios de la dieta han contribuido mucho a los conocimientos de la materia, los<br />
análisis de isótopos estables son un complemento útil al contenido de los estómagos para delinear la<br />
estructura compleja de las redes de alimentación marinas. El contenido de los estómagos representa una<br />
muestra de solamente las horas más recientes de alimentación en el momento en el que fue capturado el<br />
animal, y bajo las condiciones necesarias para su captura. Los isótopos estables de carbono y nitrógeno,<br />
en cambio, integran información sobre todos los componentes de la dieta entera en el tejido del animal,<br />
brindando así un historial reciente de las interacciones tróficas e información sobre la estructura y<br />
dinámica de las comunidades ecológicas. AA-CSIA (compound-specific stable isotope analysis, o análisis<br />
de isótopos estables por compuesto) de los aminoácidos brinda una mayor comprensión. En muestras de<br />
tejido de consumidores, los aminoácidos “fuente” (por ejemplo, fenilalanina, glicina) retuvieron los<br />
valores isotópicos en la base de la red de alimentación, y los aminoácidos “tróficos” (por ejemplo, ácido<br />
glutámico) fueron enriquecidos en 15 N aproximadamente un 7.6‰ con respecto a la línea de referencia.<br />
En AA-CSIA, el tejido de los depredadores por sí mismo es suficiente para estimaciones de la posición<br />
trófica, y no es necesario un análisis separado de la composición isotópica de la base de la red de<br />
alimentación. Un análisis reciente de la distribución espacial de los valores de los isótopos estables del<br />
atún aleta amarilla en relación con aquéllos de los copépodos indicó que la posición trófica del atún aleta
175<br />
amarilla aumentó con distancia de la costa en el OPO, una característica de la red de alimentación nunca<br />
detectada en la dieta. Esto es probablemente resultado de diferencias en la longitud de la cadena<br />
alimentaria debidas a la composición por especies del fitoplancton (especies de tamaño de célula<br />
pequeño) en las aguas oligotróficas de alta mar comparada con las especies de diátomas más grandes en<br />
las aguas orientales más productivas.<br />
CSIA fue utilizado recientemente en el OPO y otras regiones mediante una beca de investigación del<br />
programa CAMEO (Comparative Analysis of Marine Ecosystem Organization), implementado<br />
conjuntamente por NMFS y la División del Ciencias Oceánicas de la Fundación Nacional para la Ciencia<br />
de EE.UU. La investigación colaborativa entre la CIAT, la Universidad de Hawai, la Institución Scripps<br />
de Oceanografía, y el Instituto Oceánico de Hawai busca desarrollar el análisis isotópico de aminoácidos<br />
por compuesto como herramienta capaz de producir una evaluación insesgada de posición trófica para una<br />
amplia variedad de organismos marinos, y usar esta información para validar los resultados de modelos<br />
ecosistémicos de balance de masas trófico. Y para lograr este objetivo, la investigación combina<br />
experimentos de laboratorio y recolecciones de campo en ecosistemas contrastantes con pesquerías<br />
importantes. El componente de campo fue realizado en distintos ambientes biogeoquímicos, incluyendo el<br />
OPO ecuatorial, a fin de examinar la posición trófica de una variedad de especies individuales, desde<br />
macrozooplancton hasta peces grandes, y comparar las estimaciones de posición trófica derivadas de AA-<br />
CSIA para esas especies con los resultados del modelo ecosistémico. El proyecto comenzó en 2010 y fue<br />
extendido hasta 2014.<br />
La mayor parte de las muestras de la porción del OPO del estudio fueron obtenidas y almacenadas<br />
congeladas por el personal de la División de Recursos Protegidos del Centro Sudoeste de Ciencia<br />
Pesquera de NMFS, a bordo de los buques de investigación David Starr Jordan y McArthur II durante el<br />
proyecto STAR (Stenella Abundance Research Project) en 2006. Las muestras para el estudio abarcan<br />
casi la red alimentaria en el OPO, y todas fueron tomadas a lo largo de un transecto este-sudoeste que<br />
aparentemente abarcaba una pendiente de productividad. Los componentes incluyen macroplancton (dos<br />
crustáceos eufásidos, Euphausia distinguenda y E. tenera), micronectón mesopelágico (dos peces<br />
myctófidos, Myctophum nitidulum y Symbolophorus reversus), cefalópodos (dos especies de calamares<br />
pelágicos, Dosidicus gigas y Sthenoteuthis oualaniensis), y micronectonívoros y nectonívoros pequeños y<br />
grandes (atunes barrilete, aleta amarilla, y patudo capturados a bordo de buques cerqueros comerciales<br />
que pescaron en el OPO durante 2003-2005).<br />
Se realizaron análisis de isótopos estables de tejidos inertes y aminoácidos en varios especímenes de cada<br />
una de las especies arriba detalladas. Los valores δ 15 N del tejido inerte variaron marcadamente en función<br />
de las pendientes de longitud y latitud. No hubo tendencias longitudinales marcadas, pero los valores δ 15 N<br />
aumentaron consistentemente con aumentos de latitud. En cambio, las estimaciones de posición trófica<br />
basadas en los valores δ 15 N de los aminoácidos variaron poco intraespecíficamente a través del transecto<br />
muestreado. Estos dos resultados sugieren que la variabilidad en la red alimentaria se debe probablemente<br />
a variabilidad biogeoquímica en la base de la red alimentaria más que a diferencias en las dietas dentro de<br />
la red alimentaria. Valores de δ 15 N crecientes con latitud corresponden a altas tasas de denitrificación<br />
asociadas a la gran zona de oxígeno minimo en el OPO. Comparaciones entre especies de posición trófica<br />
absoluta basadas en estimaciones de AA-CSIA con estimaciones basadas en dieta del modelo del<br />
ecosistema del OPO (Boletín de la CIAT, Vol. 22, No. 3) señalaron subestimaciones para los<br />
depredadores que ocupan los niveles trófico más altos, es decir, los tres atunes y dos calamares. Estas<br />
subestimaciones se deben probablemente a que el enriquecimiento trófico previamente aceptado de 7.6 ‰<br />
para fenilalanina y ácido glutámico, derivado de experimentos de laboratorio con productores primarios y<br />
consumidores inverterbrados, no es adecuado para los depredadores de niveles más altos.<br />
Se desarrolló una tesis de maestría de este trabajo, y un manuscrito ha sido aceptado provisionalmente
176<br />
para publicación en 2016 11 .<br />
Estudios previos sugieren que las diferencias en los valores de δ 15 N de aminoácidos fuente y tróficos<br />
pueden ser usados para examinar cambios históricos en la posición trófica de muestras archivadas, para<br />
investigar, por ejemplo, los efectos potenciales de extracciones pesqueras sobre la dinámica trófica del<br />
sistema. Cuando los datos históricos de dieta son insuficientes o ausentes, AA-CSIA de especímenes<br />
archivados podría ser la única forma de determinar el estatus trófico pasado de especies clave de<br />
depredadores y presas. Dada la importancia de análisis ecosistémicos retrospectivos, se está desarrollando<br />
la capacidad de realizar estos análisis mediante un examen a fondo de los posibles artefactos de métodos<br />
de conservación de muestras sobre submuestras de especies clave. En este estudio de dos años, se<br />
obtuvieron, fijaron en formol, y almacenaron a largo plazo en etanol muestras musculares de tres atunes<br />
aleta amarilla y tres calamares de Humboldt. Se congelaron durante dos años muestras emparejadas para<br />
comparar con las muestras conservadas. La duración de la conservación y congelación varió de una<br />
semana a dos años, y todas las muestras conservadas presentaron un aumento uniforme de los valores de<br />
bulk δ 15 N. Los valores de δ 15 N de varios aminoácidos (treonina, fenilalanina, y valina) fueron<br />
significativamente diferentes entre las muestras conservadas y congeladas. Se está realizando un<br />
experimento de seguimiento para evaluar si el cambio de los valores de δ 15 N fue causado por la fijación<br />
en formol o la conservación en etanol. Estos datos sugieren cautela e investigaciones adicionales en<br />
estudios futuros que pretendan realizar AA-CSIA en tejido conservado en formol-etanol.<br />
A principios de 2016, el Comité Científico Directivo de CLIOTOP aceptó una propuesta por un equipo de<br />
tarea de miembros del grupo de trabajo 3 de CLIOTOP. Este trabajo acompañará el análisis global de<br />
dietas de atunes antes descrito. El equipo de tarea representa un esfuerzo colaborativo internacional para<br />
avanzar de estudios tróficas regionales de depredadores marinos tope a un estudio global comparativo de<br />
las redes alimenticias oceánicas que usan la composición de isótopes estables de las tres mismas especies<br />
de atunes que aparecen en el estudio de dietas: aleta amarilla, patudo, y albacora. El equipo evaluará<br />
trabajo, diferencias isotópicas entre océanos, regiones, y especies de atunes. Se usarán modelos<br />
predictivos para emprender una comparación interoceánica de un sustituto de posición trófica basado en<br />
valores de isótopos estables. El sustituto se basa en los valores de δ 15 N de los atunes menos las diferencias<br />
regionales conocidas en los valores base de δ 15 N derivados de un modelo acoplado circulación oceánicabiogeoquímico-isótopo.<br />
Se adoptará un método similar con los valores de δ 13 C corregidos por lípidos para<br />
examinar diferencias regionales en los orígenes de producción primaria basada en carbono. Se incluirán<br />
variables ambientales (TSM, Chl-a, productividad primaria neta, y profundidad de la capa mixta) para<br />
explorar el efecto de procesos oceanográficos globales sobre la composición isotópica de las especies de<br />
atunes y la longitud de la cadena alimenticia.<br />
5. AMBI<strong>EN</strong>TE FÍSICO<br />
12<br />
2<br />
Las condiciones ambientales afectan a los ecosistemas marinos, la dinámica y capturabilidad de los atunes<br />
y peces picudos, y las actividades de los pescadores. Los atunes y peces picudos son pelágicos durante<br />
todas las etapas de la vida, y los factores físicos que afectan al Océano Pacífico tropical y subtropical<br />
pueden ejercer efectos importantes sobre su distribución y abundancia. Se cree que las condiciones<br />
ambientales causan una variabilidad considerable en el reclutamiento de los atunes y peces picudos. Las<br />
evaluaciones de las poblaciones realizadas por la CIAT a menudo han incorporado el supuesto que las<br />
condiciones oceanográficas podrían afectar el reclutamiento en el OPO.<br />
Distintos tipos de perturbaciones climáticas podrían afectar la pesca de distintas formas. Se cree que una<br />
termoclina poco profunda en el OPO contribuye al éxito de la pesca atunera de cerco, actuando tal vez de<br />
11<br />
Hetherington, E.D., R.J. Olson, J.C. Drazen, C.E. Lennert-Cody, L.T. Ballance, R.S. Kaufmann, and B.N. Popp.<br />
In revision. Spatial variability in food web structure in the eastern tropical Pacific Ocean using compound-specific<br />
nitrogen isotope analysis of amino acids. Limnology and Oceanography.<br />
2 Parte de la información en esta sección proviene de Fiedler, P.C. 2002. Environmental change in the eastern<br />
tropical Pacific Ocean: review of <strong>EN</strong>OS and decadal variability. Mar. Ecol. Prog. Ser. 244: 265-283.
177<br />
barrera térmica para los cardúmenes de atunes pequeños, manteniéndolos cerca de la superficie del agua.<br />
Cuando la termoclina se hunde, como durante un evento de El Niño, los atunes parecen ser menos<br />
vulnerables a la captura, y las tasas de captura disminuyen. Temperaturas superficiales del mar (TSM)<br />
cálidas o frías pueden asimismo causar que estos peces móviles se desplacen a un hábitat más favorable.<br />
El ambiente oceánico varía en una variedad de escalas temporales, de estacional a interanual, decadal, y<br />
mayores (por ejemplo, fases o regímenes climáticos). La causa dominante de variabilidad en las capas<br />
superiores del OPO es conocida como El Niño-Oscilación del Sur (<strong>EN</strong>OS). El <strong>EN</strong>OS es una fluctuación<br />
irregular que afecta al Océano Pacífico tropical entero y la atmósfera global. Resulta en variaciones de los<br />
vientos, la precipitación, profundidad de la termoclina, circulación, productividad biológica, y la<br />
alimentación y reproducción de peces, aves y mamíferos marinos. Los eventos de El Niño ocurren a<br />
intervalos de entre 2 y 7 años, y son caracterizados por vientos alisios más débiles, una termoclina más<br />
profunda, y TSM anormalmente elevadas en el OPO ecuatorial. La fase contraria de El Niño, denominado<br />
comúnmente La Niña, es caracterizada por vientos alisios más fuertes, una termoclina menos profunda, y TSM<br />
más bajas. La investigación ha documentado una conexión entre el <strong>EN</strong>OS y la tasa de producción primaria, la<br />
biomasa de fitoplancton, y la composición por especies del fitoplancton. Durante los episodios de El Niño<br />
disminuye el afloramiento de agua subsuperficial, rica en nutrientes, lo cual lleva a una reducción notoria en la<br />
producción primaria y secundaria. El <strong>EN</strong>OS también afecta directamente a los animales en los niveles tróficos<br />
medianos y altos. Los investigadores han concluido que el Niño de 1982-1983, por ejemplo, incrementó la<br />
profundidad de la termoclina y nutriclina, redujo la producción primaria, redujo la abundancia de zooplancton,<br />
y al final redujo las tasas de crecimiento, el éxito reproductivo, y la supervivencia de varias aves, mamíferos, y<br />
peces en el OPO. Sin embargo, en general los moradores del océano se recuperan en períodos cortos, porque<br />
su ciclo vital está adaptado para responder a un hábitat variable.<br />
El personal de la CIAT emite informes trimestrales de los datos oceanográficos y meteorológicos<br />
mensuales medios del OPO, incluyendo un resumen de las condiciones actuales del <strong>EN</strong>OS. Los TSM<br />
fueron principalmente inferiores a lo normal desde octubre de 2013 hasta marzo de 2014, pero durante<br />
abril de 2014 hasta septiembre de 2015 fueron casi todas superiores a lo normal. Para enero de 2015 el<br />
área de agua cálida frente a México se había extendido al suroeste, combinándose con el área de agua<br />
cálida lo largo de la línea ecuatorial que persistió hasta julio. Durante el tercer trimestre, las áreas de agua<br />
cálida frente a Baja California y a lo largo de la línea ecuatorial se hicieron más grandes y más cálidos.<br />
Durante el cuarto trimestre, las TSM fueron superiores a lo normal en gran parte del área al norte de 10°S,<br />
y frente a Perú, pero casi normales en la mayor parte del resto del área al sur de la línea ecuatorial. Según<br />
el Climate Diagnostics Bulletin del Servicio Meteorológico Nacional de Estados Unidos de diciembre de<br />
2015, la mayoría de los modelos indican que un Niño fuerte se debilitará con una transición a condiciones<br />
neutras hacia fines de la primavera o principios del verano. Los meteorólogos están de acuerdo con el<br />
consenso del modelo, aunque es difícil predecir el momento exacto de la transición.<br />
La variabilidad a escala decadal (o sea, de 10 a 30 años) también afecta al OPO. A fines de la década de<br />
1970 ocurrió en el Pacífico Norte un cambio importante en las condiciones físicas y biológicas. Este<br />
cambio de clima fue detectado en el OPO tropical también, mediante pequeños aumentos de las TSM, un<br />
debilitamiento de los vientos alisios, y un cambio moderado en los niveles de clorofila en la superficie.<br />
Algunos investigadores han reportado otro cambio importante en el Pacífico Norte en 1989. La<br />
variabilidad en el océano causada por el clima ha sido descrita a menudo en términos de “regímenes”<br />
caracterizados por promedios y patrones relativamente estables en las variables físicas y biológicas.<br />
Análisis realizados por el personal de la CIAT indican que el atún aleta amarilla en el OPO ha pasado por<br />
regímenes de reclutamiento bajo (1975-1982) y alto (1983-2001), y posiblemente otro intermedio (2002-<br />
2012). Se estima que los reclutamientos de 2013 y 2014 fueron superiores al promedio, pero los valores<br />
estimados son altamente inciertos. Se cree que el mayor reclutamiento durante 1983-2001 se debe a un<br />
cambio a un régimen de productividad más alta en el Océano Pacífico. Las fluctuaciones decadales en el<br />
afloramiento y transporte de agua son simultáneas con el patrón de <strong>EN</strong>OS más frecuentes y tienen efectos<br />
en toda la cuenca sobre las TSM y la pendiente de la termoclina que son similares a los que causa el
178<br />
<strong>EN</strong>OS, pero a escala temporal mayor.<br />
Literatura revisada por pares reciente brinda pruebas fuertes de que han resultado cambios a gran escala<br />
en la producción biológica y hábitat como consecuencia del forzamiento físico en el Océano Pacífico<br />
subtropical y tropical. Se cree que estos cambios son capaces de afectar comunidades de presas. La<br />
producción primaria ha disminuido en regiones vastas oceánicas en la última década o décadas. Un<br />
estudio publicado en 2008, que usó datos del color del océano tomados con sensores remotos (« Seaviewing<br />
Wide Field-of-view Sensor » (SeaWiFS)), señaló que, en el Pacífico norte y sur, las aguas<br />
superficiales más oligotróficas han aumentado en área 2.2 y 1.4% por año, respectivamente, entre 1998 y<br />
2006. Estos incrementos estadísticamente significativos en los giros oligotrófics ocurrieron<br />
concurrentemente con aumentos significativos de las TSM medias. En el Pacífico norte, la dirección de<br />
expansión fue hacia el noreste, entrando en el Pacífico oriental hasta aproximadamente 120°O y al sur<br />
hasta aproximadamente 15°N. La productividad primaria neta también ha disminuido en los océanos<br />
tropicales y subtropicales desde 1999. Se reconoce al mecanismo como una mayor temperatura del agua<br />
en la capa superior del océano y una estratificación vertical incrementada, que afectan la disponibilidad de<br />
los nutrientes para el crecimiento del fitoplancton. También existen pruebas fuertes que los productores<br />
primarios han cambiado la composición de sus comunidades y su estructura por tamaño en las últimas<br />
décadas. El tamaño de las células de fitoplancton es pertinente a la dinámica de depredación de los atunes<br />
porque las redes alimenticias que tienen picofitoplancton en la base necesitan más pasos tróficos para<br />
alcanzar depredadores de un tamaño dado que las redes alimenticias que comienzan con nanofitoplancton<br />
más grande (por ejemplo, díatomas). La eficacia de la transferencia de energía es más baja para las redes<br />
alimenticias basadas en picofitoplancton que para aquellas basadas en nanofitoplancton, es decir, para una<br />
cantidad dada de producción primaria, menos energía alcanzará un aleta amarilla de un tamaño dado en el<br />
primero que en el segundo porque la eficacia de transferencia trófica anual media en cada paso es<br />
relativamente constante. Un estudio publicado en 2012 usó TSM detectadas a distancia por satélite y<br />
concentraciones de clorofila-a para estimar la composición por talla mensual de las comunidades de<br />
fitoplancton durante 1998-2007. Con el componente estacional excluido, el tamaño mediano de la célula<br />
de fitoplancton estimado para el Pacífico subtropical 10°-30°N y 10°-30°S disminuyó un 2,2% y 2,3%,<br />
respectivamente, durante el periodo de nueve años. La expansión de la zona de oxígeno mínimo (ZOM)<br />
es el tercer factor que demuestra cambio en el ecosistema a escala capaz de afectar las comunidades de<br />
presas. La ZOM es una capa gruesa de oxígeno bajo a profundidades intermedias, que es generalmente<br />
subóxica (
179<br />
especies objetivo individuales, se cree que un primer paso factible sería aplicar medidas de desempeño y<br />
puntos de referencia a especies no objetivo. Ejemplos actuales incluyen límites de mortalidad incidental<br />
de delfines en la pesquería cerquera del OPO bajo el APICD. Otra área de interés es la posibilidad de elaborar<br />
indicadores útiles de desempeño basados en propiedades a nivel de ecosistema. Han sido propuestos varios<br />
indicadores de ecosistema, entre ellos la estructura del tamaño de la comunidad, índices de diversidad, riqueza<br />
y uniformidad de especies, índices de solape, espectros tróficos de la captura, abundancia relativa de una<br />
especie o un grupo indicador, y numerosos indicadores ambientales. Se opina generalmente que se debería<br />
usar indicadores múltiples a nivel de sistema, pero existen dudas sobre la suficiencia de los conocimientos<br />
prácticos de la dinámica de estos indicadores, y sobre la existencia de un fundamento teórico para identificar<br />
puntos de referencia precautorios o límite basados en las propiedades de los ecosistemas. El uso de indicadores<br />
ecosistémicos para la ordenación de pesquerías todavía no es común.<br />
Métricas ecológicas Se usó una variedad de métricas ecológicas en un estudio publicado en 2012 133 para<br />
evaluar el los efectos ecológicos de la pesca de cerco en el OPO durante 1993-2008. Se hicieron<br />
comparaciones de la captura de especies objetivo y no objetivo (incidental), tanto retenida como<br />
descartada, por tres tipos de lance cerquero sobre la base de tiempo de reemplazo, diversidad, biomasa<br />
(peso), número de individuos, y nivel trófico. Las comparaciones previas consideraron solamente el<br />
número de individuos y solamente animales descartados, sin tener en cuenta el tamaño del cuerpo, las<br />
características del ciclo vital, o posición en la red alimentaria. Durante 1993-2008, la biomasa media<br />
extraída fue 17.0, 41.1 y 12.8 t/lance en lances sobre delfines, objetos flotantes, y no asociados,<br />
respectivamente. De estas cantidades, la captura incidental por tipo de lance fue 0.3% sobre delfines,<br />
3.8% sobre objetos flotantes, 1.4% sobre atunes asociados, y 2.1% para todos los métodos combinados.<br />
La tasa de descarte fue 0.7% sobre delfines, 10.5% sobre objetos flotantes, 2.2% sobre atunes asociados, y<br />
5.4% para todos los métodos combinados. Añadiendo el 0.7% estimado para los buques más pequeños, la<br />
tasa de descarte total fue 4.8%. Esta tasa es baja comparada con las estimaciones globales de 7.5% para<br />
los palangres atuneros, 30.0% para las redes de arrastre pelágicas, y 8.0% para todas las pesquerías<br />
combinadas.<br />
Tiempo de reemplazo es una medida del tiempo necesario para reemplazar la biomasa extraída por la<br />
pesca. Niveles de extracción insostenibles pueden conducir a disminuciones mayores de la probabilidad<br />
de persistencia de animales de vida larga, fecundidad baja, y madurez tardía que de especies de<br />
crecimiento rápido y fecundidad alta. A diferencia de las métricas de nivel trófico, las métricas de tiempo<br />
de reemplazo fueron sensibles a categorías de animales con proporciones relativamente altas de biomasa a<br />
producción de biomasa (B/P), como el atún patudo, los tiburones, y los cetáceos. El tiempo de reemplazo<br />
medio para las extracciones totales fue mínimo para los lances sobre delfines (promedio 0.48 años),<br />
intermedio para los lances no asociados (0.57 años), y máximo para los lances sobre objetos flotantes<br />
(0.74 años). No hubo tendencias temporales en el tiempo de reemplazo medio de las descargas, y los<br />
tiempos de reemplazo medios de los descartes fueron más variable que aquellos de las descargas. Los<br />
tiempos de reemplazo medios de los descartes en lances sobre delfines fueron aproximadamente siete<br />
veces aquellos de los descartes en los lances sobre objetos flotantes o no asociados porque la tasa de<br />
reproducción de los delfines es baja.<br />
Diversidad. La pesca cambia la diversidad al extraer selectivamente las especies objetivo. La relación<br />
entre la diversidad de las especies extraídas y los efectos sobre la diversidad y estabilidad del ecosistema<br />
del cual son extraídas podría ser compleja. Una mayor diversidad de la captura podría estar asociada a<br />
menos efectos indeseables sobre el ecosistema, aunque la complejidad de las interacciones competitivas y<br />
tróficas entre especies dificulta la determinación de la relación entre la diversidad de la captura y la<br />
diversidad y estabilidad del ecosistema. El índice de diversidad de Shannon para extracciones totales fue<br />
3 Gerrodette, T., R. Olson, S. Reilly, G. Watters, and W. Perrin. 2012. Ecological metrics of biomass removed by<br />
three methods of purse-seine fishing for tunas in the eastern tropical Pacific Ocean. Conservation Biology. 26 (2):<br />
248-256.
180<br />
mínimo para los lances sobre delfines (promedio 0.62), intermedio para los lances no asociados (1.22), y<br />
máximos para los lances sobre objetos flotantes (1.38). La diversidad de las descargas de los lances sobre<br />
delfines aumentó en promedio 0.023/año de 0.45 a 0.79, debido principalmente a un aumento del<br />
porcentaje de atún barrilete en la captura de 7% y una disminución correspondiente del<br />
porcentaje de aleta amarilla. La diversidad de las descargas y los descartes en lances no asociados<br />
disminuyó, y la diversidad de las extracciones totales disminuyó un 0.024/año, de 1.40 a 1.04.<br />
Biomasa. Las cantidades y características relativas de la biomasa extraída por cada uno de los métodos de<br />
pesca varió en función de cómo se midió la extracción. Las descargas de los lances sobre objetos flotantes<br />
fueron máximas para todas las cuatro medidas de extracción, pero fueron particularmente altas cuando se<br />
midió sobre la base del número de individuos o tiempo de reemplazo. La cantidad y composición de los<br />
descartes varió entre los métodos de pesca. Los descartes de las especies de atunes objetivo formaron la<br />
mayor proporción de los animales extraídos, independientemente de si se midió en biomasa, número de<br />
individuos, o unidades de nivel trófico. Los descartes de cetáceos en los lances sobre delfines y de<br />
tiburones en lances sobre objetos flotantes y no asociados fueron mayores cuando se midieron en<br />
unidades de tiempo de reemplazo que cuando se midieron en otras unidades debido a las bajas tasas de<br />
reproducción de estos animales.<br />
Estructura trófica y niveles tróficos de la captura: Los enfoques ecosistémicos a la ordenación de la<br />
pesca ponen énfasis de nuevo en lograr representaciones fieles de los vínculos tróficos y los flujos de<br />
biomasa por la red alimenticia en los sistemas explotados. La estructura de la red alimenticia y las<br />
interacciones entre sus componentes desempeñan un papel demostrable en la determinación de la<br />
dinámica y productividad de los ecosistemas. En la ecología de las redes tróficas se usan los niveles<br />
tróficos (TL) para caracterizar el papel funcional de los organismos, para facilitar las estimaciones del<br />
flujo de energía o masa por las comunidades, y para elucidar aspectos de la trofodinámica del<br />
funcionamiento de los ecosistemas. En la Figura L-1 se presenta un diagrama simplificado, con NT<br />
aproximados, de la red trófica del OPO tropical pelágico. Las ballenas dentadas (Odontoceti, NT medio<br />
5.2), depredadores de calamar grande (atún patudo grande y pez espada, NT medio 5.2) y tiburones (NT<br />
medio 5.0) son depredadores ápice. Los otros atunes y peces piscívoros grandes, delfines (NT medio 4.8),<br />
y aves marinas (NT medio 4.5) ocupan NT ligeramente más bajos. Peces epipelágicos menores (melvas y<br />
peces voladores (NT medio 3.2), por ejemplo), cefalópodos (NT medio 4.4), y peces mesopelágicos (NT<br />
medio 3.4) son el alimento principal de muchos de los depredadores de alto nivel en el ecosistema. Los<br />
peces pequeños y crustáceos se alimentan de dos grupos de zooplancton, y el microzooplancton herbívoro<br />
(NT 2) se alimenta de los productores, fitoplancton y bacterias (NT 1).<br />
En los ecosistemas pelágicos explotados, las pesquerías dirigidas hacia peces piscívoros grandes<br />
funcionan de depredadores ápice del sistema. A lo largo del tiempo, la pesca puede causar una<br />
disminución de la composición por tamaño general de la captura, y en general, los NT de los organismos<br />
pequeños son más bajos que los de los más grandes. El NT medio de los organismos capturados por una<br />
pesquería es un indicador útil de cambios en el ecosistema y de su sustentabilidad, porque integra una<br />
variedad de información biológica sobre los componentes del mismo. Se está prestando mayor atención al<br />
análisis del NT medio de las capturas de la pesca desde que un estudio demostró que, según estadísticas<br />
de descargas de FAO, el NT medio de los peces e invertebrados descargados a nivel mundial disminuyó<br />
entre 1950 y 1994, y la hipótesis de los autores del estudio es que esto perjudica los ecosistemas. Sin<br />
embargo, algunos ecosistemas han cambiado en la otra dirección, de comunidades de NT bajo a<br />
comunidades de NT más alto. En vista de la utilidad potencial de este enfoque, se estimaron los NT<br />
medios de una serie de tiempo de capturas y descartes anuales por especie desde 1993 hasta 2014 para<br />
tres modalidades de pesca cerquera y la pesquería cañera en el OPO. Se calcularon las estimaciones<br />
mediante la aplicación de los NT del modelo de ecosistema del OPO (Sección 7), ponderados por los<br />
datos de captura por pesquería y año correspondiente a todos los grupos del modelo de las bases de datos<br />
de la CIAT de atún, captura incidental, y descartes. Los NT del modelo ecosistémico se basaron en datos<br />
de dieta de todos los grupos de especies y balance de masas entre los grupos. Los NT medios ponderados
181<br />
de las capturas sumadas de todas las pesquerías de cerco y de caña fueron similares y bastante<br />
constantes de año a año (Figura L-2: promedio PS-LP), Una leve tendencia decreciente de los lances no<br />
asociados, equivalente a 0,05 TL durante el período de 21 años, resultó de las proporciones crecientes<br />
de barrilete y decrecientes de aleta amarilla en la captura, no de capturas crecientes de especies de bajo<br />
nivel trófico. Por lo tanto, no es considerada una disminución ecológicamente perjudicial porque fue<br />
causada por proporciones crecientes de barrilete en la captura a lo largo del tiempo. En general, los NT<br />
de los lances no asociados y la pesquería de caña fueron inferiores al promedio, y aquéllos de los lances<br />
sobre delfines superiores al promedio en la mayoría de los años (Figura L-2). Los NT de los lances<br />
sobre objetos flotantes variaron más que los de los otros tipos de lance y las otras pesquerías, debido<br />
principalmente a la variabilidad interanual de las cantidades de patudo y barrilete capturadas en esos<br />
lances. Los NT de los lances sobre objetos flotantes estuvieron positivamente relacionados con el<br />
porcentaje de la captura total formado por patudo grande y negativamente relacionado con el porcentaje<br />
de la captura formado por barrilete.<br />
Se estimaron también por separado NT medios para la serie de tiempo de capturas retenidas y<br />
descartadas de la pesquería de cerco en cada año del período de 1993 a 2014 (Figura L-3). Las capturas<br />
descartadas fueron mucho menores que las capturas retenidas, y por lo tanto los patrones de los NT de<br />
las capturas totales (retenidas más descartadas) (Figura L-2) fueron determinados principalmente por<br />
los NT de las capturas retenidas (Figura L-3). Los NT de las capturas descartadas variaron más entre<br />
años que aquéllos de las capturas retenidas, debido a la diversidad de especies en las capturas<br />
incidentales. La disminución considerable de los NT medios de los descartes en los lances sobre<br />
delfines durante el período de 21 años (Figura L-3) se debió en gran parte a un aumento de las<br />
proporciones de peces de presa pequeños (melvas (Auxis spp.) y peces epipelágicos misceláneos) y<br />
rayas (Rajiformes, principalmente mantarrayas, Mobulidae) de niveles tróficos más bajos. En 2014, los<br />
NT medios de los descartes en lances sobre delfines aumentó un 0.2 NT con respecto a aquellos de<br />
2013, debido principalmente a un aumento de las proporciones de delfines mesopelágicos (NT 4.65) y<br />
manchados (NT 5.03) y una reducción de las proporciones de rayas descartadas. En el caso de los<br />
lances no asociados, las marcadas disminuciones interanuales del NT durante 1997 se debieron a una<br />
mayor captura incidental de rayas (NT 3.68), que se alimentan de plancton y otros animales pequeños<br />
que ocupan NT bajos, una disminución de las capturas de tiburones grandes (NT 4.93-5.23), y un<br />
aumento de los peces presa, por ejemplo, Auxis spp. (NT 3,86) en la captura incidental. En 2014, los<br />
NT medios de los descartes en lances no asociados también aumentó un 0.2 NT con respecto a aquellos<br />
de 2013 debido principalmente a un aumento de la proporción de barrilete y una reducción de la<br />
proporción de melvas descartadas. En el caso de los lances sobre objetos flotantes, los descartes de<br />
patudo están relacionados con NT medios más altos de la captura descartada.<br />
7. EVALUACIÓN DE RIESGOS ECOLÓGICOS<br />
La sustentabilidad ecológica a largo plazo es un requisito de la ordenación de la pesca basada en<br />
ecosistemas. La pesca afecta directamente las poblaciones de no sólo las especies objetivo, sino también<br />
las especies capturadas incidentalmente. Se ignora la vulnerabilidad a la sobrepesca de muchas de las<br />
poblaciones capturadas incidentalmente en las pesquerías atuneras del OPO, y los datos biológicos y de la<br />
pesca son severamente limitados en el caso de la mayoría de estas poblaciones. El personal de la CIAT<br />
aplicó en años recientes una versión del análisis de productividad y susceptibilidad (APS), usado para<br />
evaluar pesquerías en otras regiones oceánicas en los últimos años, para estimar la vulnerabilidad de<br />
especies no objetivo y de datos escasos capturadas por la pesquería de cerco en el OPO. APS considera la<br />
vulnerabilidad de una población como una combinación de su productividad y su susceptibilidad a la<br />
pesca. La productividad de una población es la capacidad de la población de recuperarse si es mermada, y<br />
es una función de las características del ciclo vital de la especie. La susceptibilidad de una población es el<br />
grado al cual la pesca puede impactarla negativamente, es decir, la propensión de una especie de ser<br />
capturada por una pesquería y padecer mortalidad debido a la misma. Los índices de productividad y<br />
susceptibilidad de una población son determinados por derivar una puntuación de entre 1 (baja) y 3
182<br />
(alta) relativa a un conjunto estandarizado de atributos para cada índice. Las puntuaciones de los<br />
atributos individuales son entonces promediadas para cada factor e ilustradas en una gráfica de<br />
dispersión x-y. La escala del eje x en la gráfica de dispersión está invertida porque se considera que las<br />
especies o poblaciones con una puntuación alta de productividad y baja de susceptibilidad (o sea, en el<br />
origen de las gráficas) son las menos vulnerables. Al puntuar los atributos, se evalúa la calidad de los<br />
datos asociados con de cada atributo, y se ponderan los atributos por la puntuación de calidad de datos.<br />
Se considera que las poblaciones con una puntuación de productividad (p) baja y una puntuación de<br />
susceptibilidad (s) alta corren un riesgo de ser mermadas, mientras que el riesgo es bajo para aquellas<br />
con una puntuación de productividad alta y una puntuación de susceptibilidad baja. Se calculan<br />
puntuaciones de vulnerabilidad (v) a partir de las puntuaciones de p y s como la distancia euclidiana<br />
entre el origen de la gráfica de dispersión x-y y el punto del dato:<br />
A fin de examinar la utilidad de los índices de productividad y susceptibilidad para evaluar la<br />
vulnerabilidad a la sobrepesca de los peces, mamíferos, y tortugas capturados incidentalmente en el OPO,<br />
se realizó una evaluación preliminar de tres « pesquerías » de cerco en el OPO en 2010, usando 26<br />
especies que forman la mayor parte de la biomasa extraída por los buques cerqueros de clase 6 (más de<br />
363 t de capacidad de acarreo) durante 2005-2009. Se usaron en el APS preliminar nueve atributos de<br />
productividad y ocho de susceptibilidad, con base en la metodología de APS establecida 14 , y algunas<br />
fueron modificadas para mayor consistencia con los datos de las pesquerías atuneras en el OPO. Se<br />
compiló información correspondiente a los atributos de productividad para cada especie de una variedad<br />
de fuentes publicadas e inéditas y de datos de la pesca del OPO (o sea, no adoptadas de ASP previos) para<br />
aproximar mejor la distribución de las características del ciclo vital observadas en las especies<br />
encontradas en el OPO. Se derivaron los umbrales de puntuación para los atributos de productividad<br />
dividiendo los datos compilados en tercios iguales. Los criterios de puntuación para los atributos de<br />
susceptibilidad fueron tomados del APS ejemplar y modificados en caso apropiado para un mejor ajuste a<br />
las pesquerías del OPO. Sin embargo, surgieron problemas al intentar comparar las estimaciones de<br />
susceptibilidad de las especies para todas las distintas pesquerías (Informe de la Situación de la Pesquería<br />
8). En 2012, se modificó el APS para incluir siete especies adicionales, con base en datos de 2005-2011<br />
(Informe de la Situación de la Pesquería 10).<br />
El personal del Programa de Biología y Ecosistemas tenía planeado finalizar y publicar el análisis de APS<br />
durante 2014, pero la jubilación de un miembro del programa y limitaciones presupuestarias<br />
imposibilitaron terminar el trabajo. No obstante, en agosto de 2016 un especialista en ecosistemas, un<br />
experto reconocido en el desarrollo de ERE, se unirá al personal de la CIAT, y se esperan avances<br />
sustanciales en este trabajo. Se presentará un informe en la reunión el Comité Científico Asesor en 2017.<br />
Entre tanto, conforme a solicitudes de la reunión del Comité en 2015, el personal de la CIAT intentó<br />
describir los datos de captura disponibles para los fines de incluir en el ERE tipos de arte adicionales a<br />
los buques cerqueros grandes (ver SAC-07-INF C(d)).<br />
Se realizaron tres modificaciones del análisis desde que fue revisado en la reunión del Comité Científico<br />
Asesor en mayo de 2015: 1) se modificaron los procedimientos para determinar cuáles especies incluir en<br />
el análisis; 2) se combinaron los valores de susceptibilidad para cada pesquería para producir un valor<br />
general de susceptibilidad para cada especie; y 3) se modificó el uso de información de captura y captura<br />
incidental en la formulación de s. La lista de atributos de productividad sigue sin modificar (Tabla L-1),<br />
mientras que la lista de atributos de susceptibilidad sido revisada debido a esta tercera modificación<br />
(Tabla L-2). A continuación se describen brevemente estas tres modificaciones. En el resto de la presente<br />
4 Patrick, W.S., P. Spencer, J. Link, J. Cope, J. Field, D. Kobayashi, P. Lawson, T. Gedamke, E. Cortés, O. Ormseth,<br />
K. Bigelow, and W. Overholtz. 2010. Using productivity and susceptibility indices to assess the vulnerability of<br />
United States fish stocks to overfishing. Fish. Bull. U.S. 108: 305-322.
183<br />
sección, el término "captura" significará captura en el caso de las especies de atunes y captura incidental<br />
en el caso de las otras especies.<br />
La primera modificación fue establecer un procedimiento de dos pasos para identificar y excluir<br />
especies poco comunes, con base en la biomasa capturada por pesquería. Sin embargo, como medida<br />
precautoria, se retuvo o se incluye ahora en el análisis toda especie poco común clasificada como<br />
« vulnerable », « en peligro », o « casi amenazada » en la Lista Roja de la IUCN. Actualmente, el APS<br />
incluye 32 especies (Tabla L-3a); se incluirán en el futuro ocho especies susceptibles adicionales, dos<br />
mantarrayas y seis tiburones.<br />
La segunda modificación fue combinar los valores de susceptibilidad para cada especie de todas las<br />
pesquerías para producir una susceptibilidad a la pesquería de cerco para cada especie. Se calculó una<br />
puntuación de susceptibilidad combinada preliminar para una especie, s j 1 , como la suma ponderada de los<br />
valores de susceptibilidad de cada pesquería para esa especie (Tabla L-3a), con ponderación igual a la<br />
proporción de lances en cada pesquería.<br />
donde<br />
s j<br />
1<br />
es la susceptibilidad combinada para la especie j<br />
s j 1 = s jj p k<br />
k<br />
s jk es la susceptibilidad de la especie j en el tipo de lance k, computada usando solamente los atributos en<br />
la Tabla L-2. s jk varía de 1 (mínimo) a 3 (máximo). En el caso de una especie con capturas < 5% en<br />
tipo de lance k, s jk ≡ 1, a menos que se hubiese computado un s jk para uno de los APS previos<br />
(Informes de la Situación de la Pesquería 8 y 10), en cual caso se usó este s jk ; de lo contrario se supuso<br />
que si las capturas fueron menos del 5% en una pesquería, la especie era tan sólo mínimamente<br />
susceptible a esa pesquería. Un APS previo (Informe de la Situación de la Pesquería 10) usó<br />
información de tendencias de la captura como atributo adicional para calcular el s jk , pero se eliminó<br />
esta información del s jk en este caso porque, siguiendo la metodología de PSA 3 establecida, los otros<br />
atributos de susceptibilidad no varían a lo largo del tiempo (pero ver más adelante).<br />
p k = N k<br />
y N<br />
∑ k N k es el número total de lances (clase-6) de tipo de lance k en 2013<br />
k<br />
1<br />
s j toma en cuenta el esfuerzo de pesca por tipo de lance, aún para los tipos de lance con poca o ninguna<br />
captura de una especie. En la Figura L-4a se presenta una gráfica preliminar de APS usando s 1 j , y en<br />
1 1<br />
la Tabla L-3a se presentan los valores de s jk , s j y v 1 . Una preocupación con respecto a s j para algunas<br />
especies es que la variación en el s jk computado a partir de los atributos en la Tabla L-2 no se correlaciona<br />
bien con diferencias observadas entre tasas de captura por tipo de lance, lo cual sugiere que los atributos<br />
en la Tabla L-2 no capturan la susceptibilidad completa de la especie j; en general se supone que tasas de<br />
captura altas deberían reflejar una mayor susceptibilidad total. Además, los s jk no explican tendencias a<br />
largo plazo.<br />
Se realizó la tercera modificación, el uso de información de captura en la formulación de s, para<br />
intentar explicar las diferencias en las tasas de captura observadas entre tipos de lance, por especie, y<br />
para explicar las tendencias a largo plazo de la abundancia. Se computaron dos formulaciones de<br />
susceptibilidad alternativas preliminares como “prueba de concepto” para estas ideas. La primera, s j 2 ,<br />
modifica s j 1 para tomar en consideración las tasas de captura actuales, que se supone ser un sustituto<br />
alternativo para la susceptibilidad y para reflejar los efectos integrados reales de los atributos de<br />
susceptibilidad en la Tabla L-2:<br />
s 2 j = s ∗ jj p k<br />
k
184<br />
donde<br />
s j<br />
2<br />
es la susceptibilidad combinada para la especie j, ajustada para las tasas de captura recientes<br />
s ∗<br />
jj<br />
es el promedio de s jk y la susceptibilidad basada en la tasa de captura: s ∗<br />
jj<br />
s jk . es como se define para s j<br />
1<br />
= 1 2 s jj + s ccc_jj <br />
s ccc_jj es la susceptibilidad basada en la tasa de captura y toma un valor de 1, 2 o 3, asignado como sigue.<br />
Si la especies no es una especie de atún objetivo, se usa la captura por lance, en número de animales<br />
por lance, para asignar un valor a s ccc_jj :<br />
1 para cps jj = 0<br />
2 para 0 < cps jj < 1.0<br />
3 para cps jj ≥ 1.0<br />
Si la especie es una especie de atún objetivo, entonces se asignan los valores siguientes a s ccc_jj :<br />
Lances sobre delfines Lances no asociados Lances sobre objetos flotantes<br />
Patudo 1 2 3<br />
Aleta amarilla 3 3 3<br />
Barrilete 2 3 3<br />
cps _jk es la captura por lance para la especie j en el tipo de lance k (= captura de clase 6 (en número de<br />
animales) dividida por el número de lances de clase 6), en el año más reciente (2013). Se usó captura por<br />
lance en lugar de captura total a fin de controlar por diferencias en el esfuerzo entre los tipos de lance.<br />
p k es como se define para s j<br />
1<br />
2<br />
En la Figura L-4b se presenta una gráfica APS preliminar usando s j y en la Tabla L-3b se presentan los<br />
valores de s ∗ 2 2<br />
jj , s j y v 2 . s j podría ser afectado por diferencias en la abundancia entre especies porque la<br />
captura por lance es afectada por la abundancia. Clasificar cps jk por rango podría ayudar a minimizar este<br />
problema. Las reglas actuales para clasificar cps jk por rango para especies de atunes no objetivo se<br />
basaron en la idea que una captura nula equivale a susceptibilidad mínima, una captura que aumenta por<br />
menos de un animal por lance equivale a susceptibilidad moderada, y una captura que aumenta por una<br />
tasa de esfuerzo de un animal o más por lance equivale a susceptibilidad alta. No obstante, estas reglas<br />
son una "prueba de concepto" y podrían ser modificadas.<br />
La segunda formulación alternativa de susceptibilidad, computada para especies aparte de atunes objetivo<br />
y delfines, s j 3 , se ajusta por tendencias a largo plazo:<br />
donde<br />
s 3 j = s ∗∗ jj p k<br />
s j 3 es la susceptibilidad combinada para especie j, ajustada por tendencias a largo plazo<br />
∗∗<br />
s jj es el promedio de s jk y las susceptibilidad a tendencias: s ∗∗ jj = 1 s 2<br />
jj + s ttttt_jj ;<br />
s jk es como se define para s j<br />
1<br />
S trend_jk es la susceptibilidad a tendencias para la especie j en tipo de lance k, obtenida como sigue:<br />
1.0 si la especie j no ocurre en el tipo de lance k<br />
1.5 si ttttt jj no es significativa o es significativa pero creciente<br />
3.0 si ttttt jj es significativa pero decreciente<br />
k
185<br />
trend jk es la pendiente de la regresión de cps jk,y y año y, a partir del inicio de la toma de datos (que puede<br />
variar por especie). Se computó trend jk para especies para las cuales no existen evaluaciones<br />
completas (o indicadores de ordenación) y para las cuales no se ha determinado que los datos de la<br />
pesca no son adecuados para la estimación de tendencias; es decir, para especies aparte de las tres<br />
especies de atún objetivo y las especies de delfines (pero ver más adelante). Una tendencia<br />
significativa fue cualquier pendiente con un valor p < 0.05.<br />
cps ,jk,y es la captura por lance de especie j para el tipo de lance k en el año y<br />
En la Figura L-4c se presentan una gráfica preliminar de APS usando s 3 j para especies aparte de las tres<br />
especies de atunes objetivo y de las especies de delfines, y en la Tabla L-3c se presentan los valores de<br />
s ∗∗ jj , s 3 j y v 3 . Para el futuro, se podría ampliar s 3 j para incluir las tres especies de atunes objetivo mediante<br />
la estimación de tendencias a partir de la biomasa reproductora, y a las especies de delfines mediante el<br />
uso de tendencias estimadas a partir de estimaciones históricas de la abundancia basadas en transectos<br />
3<br />
lineales. Una preocupación acerca de s j es que las tendencias estimadas a partir de la captura por lance<br />
podrían no seguir de forma fiable los cambios de la abundancia (tal como se demostró en el caso de los<br />
delfines en el Documento SAC-05-11d).<br />
Las tres medidas de susceptibilidad, s j 1 , s j 2 , y s j 3 , son consideradas preliminares y representan ideas de<br />
"prueba de concepto" para ilustrar varias opciones para computar susceptibilidad ajustada a la pesquería<br />
de cerco del OPO.<br />
El personal de la CIAT seguirá trabajando durante 2015 para mejorar y refinar el análisis de<br />
productividad y susceptibilidad para el OPO. El trabajo future se enfocará en la evaluación de cuál de las<br />
tres medidas de susceptibilidad es preferible, y si se deberían hacer modificaciones adicionales. Además,<br />
se está realizando una revisión completa de la literatura para determinar si los atributos de susceptibilidad<br />
en la Tabla L-2 y las puntuaciones y puntuaciones de productividad correspondientes deberían ser<br />
actualizadas como resultado de nuevas investigaciones.<br />
8. MODE<strong>LA</strong>DO DE ECOSISTEMAS<br />
Es evidente que los distintos componentes de un ecosistema interactúan. La ordenación ecosistémica de la<br />
pesca es facilitada por la elaboración de modelos ecosistémicos multiespecíficos que representan las<br />
interacciones ecológicas entre las especies o gremios. Nuestros conocimientos del complicado laberinto<br />
de conexiones en los ecosistemas del océano abierto están en su etapa temprana, y, por lo tanto, la mayor<br />
utilidad de los modelos de ecosistema actuales es como instrumentos descriptivos para explorar los<br />
efectos de una mezcla de hipótesis y conexiones establecidas entre los componentes del ecosistema. Los<br />
modelos de ecosistema necesitan mantener un equilibrio entre representaciones simplistas por un lado y<br />
una complejidad imposible de manejar por el otro.<br />
El personal de la CIAT ha desarrollado un modelo del ecosistema pelágico en el OPO tropical (Boletín de<br />
la CIAT, Vol. 22, No. 3) para explorar cómo la pesca y la variación climática podrían afectar los animales<br />
en los niveles tróficos medianos y altos. El modelo tiene 38 componentes, entre ellos las principales<br />
especies explotadas (atunes, por ejemplo), grupos funcionales (tiburones y peces voladores, por ejemplo),<br />
y especies sensibles (tortugas marinas, por ejemplo). Algunos grupos taxonómicos están subdivididos en<br />
categorías (marlines grandes y pequeños, por ejemplo). La resolución taxonómica del modelo es más fina<br />
en los niveles tróficos superiores, pero la mayor parte de la biomasa del sistema está en los niveles<br />
tróficos medianos y bajos. Se estimaron las descargas y descartes para cinco “artes” de pesca: caña,<br />
palangre, y tres tipos de lances cerqueros: sobre atunes asociados con delfines, con objetos flotantes, y no<br />
asociados. El modelo está enfocado en las regiones pelágicas; no describe adecuadamente los ecosistemas<br />
locales costeros.<br />
La mayor parte de la información que describe las interacciones interespecíficas en el modelo provino de<br />
un proyecto conjunto CIAT-NMFS, el que incluyó estudios de los hábitos alimenticios de atunes aleta
186<br />
amarilla, barrilete, y patudo, delfines, tiburones pelágicos, peces picudos, dorados, petos, salmones, y<br />
otros. El objetivo del proyecto fue contribuir a los conocimientos de la asociación atún-delfín, y se adoptó<br />
un diseño de muestreo a nivel de comunidad.<br />
Se usó el modelo de ecosistema para evaluar los posibles efectos de variabilidad en los procesos forzados<br />
desde abajo por el medio ambiente sobre los niveles tróficos medianos y altos del ecosistema pelágico. Se<br />
incorporaron en el modelo series de tiempo predeterminadas de biomasa de productores para aproximar<br />
los cambios en la producción primaria documentados durante eventos de El Niño y La Niña, y se simuló<br />
la dinámica de los demás componentes del ecosistema. Se usó el modelo también para evaluar las<br />
contribuciones relativas de la pesca y el medio ambiente en la formación de la estructura del ecosistema<br />
en el OPO pelágico tropical. Se hizo esto usando el modelo para predecir cuáles componentes del<br />
ecosistema podrían ser susceptibles a efectos de la pesca de arriba hacia abajo, dada la importancia<br />
aparente de la variabilidad ambiental en la estructuración del ecosistema. En general, los animales con<br />
tasas de cambio relativamente bajas fueron afectados más por la pesca que por el medio ambiente, y<br />
aquéllos con tasas relativamente altas más por el medio ambiente que por la pesca.<br />
Se cree generalmente que la estructura de los ecosistemas marinos es controlada por uno de dos<br />
mecanismos: control « abajo-arriba » (impulsado por recursos), en el cual la dinámica de los productores<br />
primarios (por ejemplo, fitoplancton) controla la producción y biomasa en los niveles tróficos superiores,<br />
o control « arriba-abajo » (impulsado por consumidores), en los que la depredación por depredadores de<br />
alto nivel trófico controla la abundancia y composición de las presas en los niveles tróficos inferiores. En<br />
años relativamente recientes se ha reconocido también el control de « cintura de avispa ». Esto se refiere a<br />
una combinación de forzamiento abajo-arriba y arriba-abajo por un pequeño número de especies<br />
abundantes, altamente productivas, y de vida corta, en niveles tróficos intermedios (por ejemplo, sardinas<br />
y anchoas) que forman una « cintura » estrecha que regula el flujo de energía en el sistema. Estas especies<br />
ejercen un control depredador arriba-abajo sobre los flujos de energía del zooplancton, pero también un<br />
control abajo-arriba porque proporcionan energía para los depredadores de alto nivel trófico. Se ha<br />
supuesto que el control de « cintura de avispa » ocurre principalmente en sistemas costeros altamente<br />
productivos pero con pocas especies (por ejemplo, regiones de afloramiento), que pueden ser altamente<br />
inestables y donde pueden ocurrir cambios de régimen natural rápidos en períodos breves. Se usó el<br />
modelo de ecosistema del OPO tropical en conjunto con un modelo de una región frente al litoral este de<br />
Australia donde se capturan atunes y peces picudos para examinar la posible dinámica de forzamiento de<br />
estos sistemas. Estos dos ecosistemas pelágicos, grandes y ricos en especies, también muestran una<br />
estructura parecida a la « cintura de avispa », en el sentido que los cefalópodos y peces en niveles tróficos<br />
intermedios, de vida corta y crecimiento rápido, forman la enorme mayoría de la biomasa. Se observaron<br />
los efectos forzantes más importantes al modificar las biomasas de los peces epipelágicos y<br />
mesopelágicos de nivel trófico mediano en los modelos, lo cual causó cascadas tróficas dramáticas tanto<br />
hacia arriba como hacia abajo en el sistema. Estos ecosistemas pelágicos tropicales parecen poseer una<br />
estructura compleja en la cual varios grupos de cintura y rutas tróficas alternativas de productores<br />
primarios a depredadores ápice pueden causar efectos impredecibles cuando se modifican las biomasas de<br />
grupos funcionales particulares. Estos modelos destacan los posibles mecanismos de estructuración en los<br />
sistemas pelágicos, que tienen implicaciones para las pesquerías que explotan estos grupos (por ejemplo,<br />
la pesca del calamar), así como para las pesquerías de depredadores ápice, como los atunes y peces<br />
picudos, que se alimentan de las especies de « cintura de avispa ».<br />
9. ACCIONES DE <strong>LA</strong> CIAT Y EL APICD RE<strong>LA</strong>TIVAS A CONSIDERACIONES<br />
ECOSISTÉMICAS<br />
Tanto la Convención de la CIAT como el APICD tienen objetivos que versan sobre la incorporación de<br />
consideraciones ecosistémicas en la ordenación de las pesquerías atuneras en el OPO. Acciones tomadas<br />
en el pasado incluyen:
187<br />
9.1. Delfines<br />
a. Desde hace muchos años se evalúa el impacto de la pesquería sobre las poblaciones de delfines, y<br />
los programas para reducir o eliminar ese impacto han tenido un éxito considerable.<br />
b. Se ha limitado la mortalidad incidental de todas las poblaciones de delfines a niveles<br />
insignificantes con respecto al tamaño de las poblaciones.<br />
9.2. Tortugas marinas<br />
a. Se ha compilado una base de datos sobre todos los avistamientos, capturas, y mortalidades de<br />
tortugas marinas reportadas por observadores.<br />
b. En junio de 2003, la CIAT adoptó una Recomendación sobre tortugas marinas, en la que se<br />
contempla “el desarrollo de un programa de tres años que podría incluir la reducción de capturas<br />
incidentales de tortugas marinas, investigaciones biológicas de tortugas marinas,<br />
perfeccionamiento de artes de pesca, educación de la industria y otras técnicas para mejorar la<br />
conservación de tortugas marinas.” En enero de 2004, el Grupo de Trabajo sobre Captura<br />
Incidental propuso un programa detallado que incluye todos estos elementos e insta a todas las<br />
naciones con buques que pescan atunes en el OPO a que provean a la CIAT información sobre<br />
interacciones de las pesquerías con tortugas marinas en el OPO, incluyendo capturas tanto<br />
incidentales como directas, y otros impactos sobre las poblaciones de tortugas marinas. En junio de<br />
2004, la CIAT adoptó la Resolución C-04-07 sobre un programa de tres años para mitigar el<br />
impacto de la pesca atunera sobre las tortugas marinas; incluye disposiciones sobre la toma de<br />
datos, medidas de mitigación, educación de la industria, fomento de capacidad, e informes.<br />
c. La Resolución C-04-05, adoptada por la CIAT en junio de 2004, contiene disposiciones relativas<br />
a la liberación y tratamiento de tortugas marinas capturadas en redes de cerco. Prohíbe también a<br />
los buques desechar bolsas y otra basura plástica en el mar, y encarga al Director estudiar y<br />
formular recomendaciones acerca del diseño de plantados, particularmente el uso de malla de red<br />
sujetada bajo el agua a los mismos.<br />
d. La Resolución C-07-03, adoptada por la CIAT en junio de 2007, contiene disposiciones acerca de<br />
la instrumentación de programas de observadores en pesquerías bajo el amparo de la Comisión<br />
que podrían ejercer un efecto sobre las tortugas marinas y actualmente no son acatadas. La<br />
resolución exige que los pescadores fomenten la recuperación y reanimación de tortugas marinas<br />
de caparazón duro comatosas o inactivas antes de devolverlas al agua. Se dirige a los CPC con<br />
buques de cerco o palangre que pesquen especies abarcadas por la Convención de la CIAT en el<br />
OPO evitar a evitar encuentros con las tortugas marinas, reducir las mortalidades mediante el uso<br />
de una variedad de técnicas, y realizar investigaciones sobre la modificación de los diseños de los<br />
plantados y las artes de palangre y las prácticas de pesca.<br />
e. En respuesta a una solicitud de la Subsecretaría de Recursos Pesqueros del Ecuador, un programa<br />
fue establecido por World Wildlife Fund, la CIAT, y el gobierno de Estados Unidos, para mitigar<br />
la captura incidental y reducir la mortalidad de tortugas marinas causadas por la pesca con<br />
palangre. Un elemento clave de este programa es la comparación de las tasas de captura de<br />
atunes, peces picudos, tiburones, y dorado capturados con anzuelos J con las tasas de captura con<br />
anzuelos circulares. Los anzuelos circulares no enganchan tantas tortugas como los anzuelos J,<br />
usados tradicionalmente en la pesca palangrera, y la probabilidad de herir gravemente a las<br />
tortugas que muerden los anzuelos circulares es menor porque son más anchos y suelen<br />
engancharse en la mandíbula inferior, en lugar de internarse en el esófago y otras áreas, evento<br />
más peligroso y más común con los anzuelos J. Se difundieron además a las flotas palangreras de<br />
la región procedimientos y herramientas para liberar tortugas marinas enganchadas y enmalladas.<br />
Al fin de 2008, el programa de intercambio de anzuelos y de observadores, que comenzó en
188<br />
Ecuador en 2003, fue activo en Colombia, Costa Rica, Ecuador, El Salvador, Guatemala, México,<br />
Nicaragua, Panamá, y Perú, y está en desarrollo en Chile, con talleres en muchos puertos. El<br />
programa en Ecuador se está realizando en conjunto con el gobierno y la Overseas Fishery<br />
Cooperation Foundation de Japón, mientras que en los otros países es financiado por agencias de<br />
EE.UU. Los resultados iniciales señalan que, en las pesquerías dirigidas hacia los atunes, peces<br />
picudos y tiburones, ocurrió una reducción importante en las tasas de enganche de las tortugas<br />
marinas con los anzuelos circulares, y que menos anzuelos se alojaron en el esófago u otras áreas<br />
perjudiciales para las tortugas. Las tasas de captura de las especies objetivo son, en general,<br />
similares a aquéllas de los anzuelos J. Se realizó también un experimento en la pesquería de dorado<br />
con anzuelos circulares más pequeños; las tasas de enganche de tortugas disminuyeron, pero menos<br />
que en las pesquerías de atunes, peces picudos y tiburones. Además, miembros del personal de la<br />
CIAT y otros dirigieron talleres e hicieron presentaciones en todos los países que participan en el<br />
programa.<br />
9.3. Aves marinas<br />
a. La Recomendación C-10-02, adoptada por la CIAT en octubre de 2010, reafirmó la importancia<br />
que los miembros de la CIAT y los no miembros cooperantes apliquen, en caso apropiado, el<br />
Plan de Acción Internacional para reducir las capturas incidentales de aves marinas en la pesca<br />
con palangre de la FAO (PAI – Aves marinas). Los gobiernos detallados en la recomendación<br />
acordaron notificar a la CIAT de su instrumentación del PAI-Aves Marinas, incluyendo, según<br />
proceda, la situación de su Plan de Acción Nacional para reducir la captura incidental de las aves<br />
marinas en las pesquerías de palangre. Se acordó además que los gobiernos exigirían de sus<br />
buques palangreros que pescan Especies gestionadas por la CIAT en zonas específicas (detalladas<br />
en el Anexo 1 de la recomendación) usar al menos dos de un conjunto de ocho medidas de<br />
mitigación determinadas. Además, se alentó a los miembros y no miembros cooperantes de la<br />
CIAT a establecer programas nacionales para asignar observadores a buques palangreros de su<br />
pabellón o que pescan en sus aguas, y adoptar medidas dirigidas a asegurar que las aves marinas<br />
capturadas vivas durante las faenas de pesca con palangre sean liberadas vivas y en las mejores<br />
condiciones posibles.<br />
b. La resolución C-11-02, adoptada por la CIAT en julio de 2011, reafirmó la importancia de aplicar<br />
el PAI-Aves marinas (ver 9.3.a), y dispone que los Miembros y No miembros cooperantes (CPC)<br />
requerirán de sus buques palangreros de más de 20 metros de eslora total y que pesquen especies<br />
abarcadas por la CIAT en el OPO usar al menos dos de las medidas de mitigación detalladas, y<br />
establece estándares técnicos mínimos para dichas medidas. Alienta a los CPC a emprender,<br />
conjunta e individualmente, investigaciones para desarrollar y refinar los métodos para mitigar la<br />
captura incidental de aves marinas, y remitirán a la CIAT cualquier información derivada de estos<br />
esfuerzos. Además, alienta a los CPC a establecer programas nacionales para la asignación de<br />
observadores a bordo de los buques de palangre que enarbolen su pabellón o que pesquen en sus<br />
aguas, con el propósito de, entre otros, obtener información sobre las interacciones de las aves<br />
marinas con las pesquerías de palangre.<br />
9.4. Otras especies<br />
a. En junio de 2000, la CIAT adoptó una resolución sobre la liberación de tiburones, rayas, peces<br />
picudos, dorados, petos, y otras especies no objetivo.<br />
b. La Resolución C-04-05, adoptada por la CIAT en junio de 2006, encarga al Director buscar fondos<br />
para la reducción de la mortalidad incidental de atunes juveniles, para desarrollar técnicas y/o<br />
equipo para facilitar la liberación de peces picudos, tiburones y rayas de la cubierta o de la red, y<br />
para realizar experimentos para estimar las tasas de supervivencia de peces picudos, tiburones y<br />
rayas liberados.
189<br />
c. La Resolución C-11-10, adoptada por la CIAT en julio de 2011, prohíbe la retención a bordo,<br />
transbordo, descarga, almacenamiento, venta, u ofrecimiento de venta del cadáver de tiburones<br />
oceánicos punta blanca, en parte o entero, en las pesquerías abarcadas por la Convención de<br />
Antigua, y requiere que se liberen con prontitud ilesos, en la medida de lo posible, tiburones punta<br />
blanca cuando sean aproximados al costado del buque.<br />
d. La Resolución C-15-04, adoptada por la CIAT en julio de 2015, prohíbe la retención a bordo,<br />
transbordo, descarga, almacenamiento, venta, u ofrecimiento de venta de rayas Mobulidae (que<br />
incluyen las rayas Manta y Mobula), en parte o enteras, y requiere que los buques liberen estas<br />
rayas vivas en todo caso posible. Las disposiciones de la resolución no son aplicables a la pesca a<br />
pequeña escala y artesanal exclusivamente para el mercado interno. El número de descartes y<br />
liberaciones de rayas Mobulidae y su estátus (vivo o muerto) y lo notificarán anualmente a la<br />
CIAT a través de los programas de observadores.<br />
e. Los Miembros y no Miembros Cooperantes (CPC) prohibirán capturadas en el Área de la Convención<br />
de la CIAT.<br />
f. Los CPC registrarán, mediante, entre otros, los programas de observadores, el número de descartes y<br />
liberaciones de rayas Mobulidae, indicando su estatus, incluyendo aquéllas entregadas bajo el párrafo 3.<br />
9.5. Dispositivos agregadores de peces (plantados)<br />
a. La Resolución C-15-03, adoptada por la CIAT en julio de 2015, requiere que todos los buques<br />
cerqueros, cuando pesquen sobre plantados en el Área de la Convención de la CIAT, reúnan y<br />
notifiquen información sobre los mismos, incluyendo un inventario de los plantados presentes en el<br />
buque, y que especifiquen, para cada plantado, su identificación, tipo, y características.<br />
Adicionalmente a esta información, para cada actividad relacionada con un plantado, se debe reportar<br />
la posición, fecha, hora, tipo de actividad, y los resultados de cualquier lance en términos de captura y<br />
captura incidental. Los datos pueden ser obtenidos por medio de un cuaderno de bitácora dedicado,<br />
modificación de las hojas de datos utilizadas en la región, u otros procedimientos nacionales de<br />
notificación. El personal de la CIAT analizará los datos obtenidos, a fin de identificar cualquier<br />
elemento adicional necesario para evaluar los efectos del uso de plantados sobre el ecosistema, y<br />
presentará recomendaciones iniciales para la ordenación de los plantados en el OPO. Las<br />
recomendaciones deben incluir métodos para limitar la captura de atunes patudo y aleta amarilla<br />
pequeños asociados a la pesca sobre plantados. Los CPC obligarán a los armadores y propietarios de<br />
los buques pesqueros cerqueros de su pabellón identificar todo plantado sembrado o modificado, de<br />
conformidad con un sistema de identificación de la Comisión. A fin de reducir el enmallamiento de<br />
tiburones, tortugas marinas, o cualquier otra especie, se especifican principios para el diseño y uso de<br />
plantados. Se prohíbe lanzar una red de cerco sobre atunes asociados con un tiburón ballena vivo, si<br />
se observa el animal antes del lance. Se establece un grupo de trabajo sobre plantados, con los<br />
objetivos de reunir y compilar información sobre plantados, revisar los requisitios de recolección de<br />
datos, compilar información sobre los acontecimientos en otras OROP atuneras con respecto a<br />
plantados y sobre avances científicos pertinentes, incluyendo información sobre plantados no<br />
enmallantes, y preparar un informe preliminar para el Comité Científico Asesor.<br />
9.6. Todas especies<br />
a. Se está recabando datos sobre las capturas incidentales por buques cerqueros grandes, y se insta a<br />
los gobiernos a proveer información sobre las capturas incidentales de otros buques.<br />
b. Se han recabado datos sobre la distribución espacial de las capturas incidentales y las<br />
proporciones de captura incidental a captura para análisis de opciones de políticas de<br />
reducción de capturas incidentales.<br />
c. Se ha recabado información para evaluar medidas para reducir las capturas incidentales, tales
190<br />
come vedas, límites de esfuerzo, etc.<br />
d. Se han realizado evaluaciones de preferencias de hábitat y el efecto de cambios ambientales.<br />
e. Se han adoptado requisitos para los CPC para asegurar que, a partir del 1 de enero de 2013, un<br />
mínimo de 5% del esfuerzo de pesca realizado por sus buques palangreros de más de 20 metros<br />
de eslora total lleve un observador científico.<br />
10. ACONTECIMI<strong>EN</strong>TOS FUTUROS<br />
Es poco probable, al menos en el futuro cercano, que se disponga de evaluaciones de las poblaciones de la<br />
mayoría de las especies de captura incidental. Es posible que en lugar de evaluaciones formales se puedan<br />
desarrollar índices para evaluar tendencias en la condición de estas especies. La experiencia del personal de la<br />
CIAT con los delfines sugiere que la tarea no es trivial si se desea una precisión relativamente alta.<br />
Han sido propuestas varias medidas para estudiar cambios en las características del ecosistema, entre ellas<br />
estudios del nivel trófico medio, espectros de tamaño, dominancia, diversidad, y otros, para describir el<br />
ecosistema de forma agregada.<br />
La distribución de las pesquerías de atunes y peces picudos en el OPO es tal que incluye probablemente<br />
varias regiones con características ecológicas diferentes. Es posible que, dentro de éstas, masas de<br />
agua, características oceanográficas o topográficas, influencias del continente, etcétera, generen<br />
heterogeneidad que afecte la distribución de las distintas especies y su abundancia relativa en las<br />
capturas. Sería ventajoso incrementar los conocimientos de estos estratos ecológicos para poder usarlos<br />
en nuestros análisis.<br />
Es importante continuar los estudios de los ecosistemas en el OPO. La capacidad de resolver problemas<br />
relacionados con la pesca y el ecosistema crecerá con el número de variables de hábitat, grupos<br />
taxonómicos y niveles tróficos estudiados y con series de tiempo de datos más largas.