GED Candidate Computer Familiarity Survey - GED Testing Service
GED Candidate Computer Familiarity Survey - GED Testing Service
GED Candidate Computer Familiarity Survey - GED Testing Service

You also want an ePaper? Increase the reach of your titles
YUMPU automatically turns print PDFs into web optimized ePapers that Google loves.
2006 <strong>Computer</strong> <strong>Familiarity</strong> 10<br />
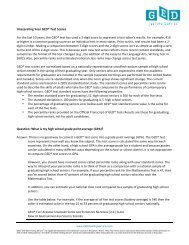
Table 2<br />
Correlations Among Measures in <strong>GED</strong>® <strong>Candidate</strong> <strong>Computer</strong> <strong>Familiarity</strong> <strong>Survey</strong><br />
1 2 3 4 5<br />
1. <strong>Computer</strong> comfort score − -.38** .08 -.22** -.18**<br />
(536) (536) (533) (535)<br />
2. Age − .04 .14* .20**<br />
(539) (535) (537)<br />
3. Highest grade completed − -.00 -.08<br />
(535) (537)<br />
4. Test format preference − .21**<br />
(535)<br />
5. Likelihood of testing −<br />
Note. Sample sizes in parentheses. Test format preference (1 = computer, 2 =<br />
paper); Likelihood of testing (1 = likely, 2 = unlikely)<br />
* p < .005. ** p < .0001.<br />
The computer comfort score accounted for the most variability in the variance of<br />
test format preference. A decrease of 11 points (1 standard deviation) from the average<br />
on the computer comfort score corresponded to being 1.6 times more likely to indicate a<br />
preference for a paper-and-pencil-based <strong>GED</strong> test format, or nearly half (.6 times) as<br />
likely to indicate a preference for a computer-based <strong>GED</strong> test format.<br />
In addition to test format preference, the computer comfort score and age<br />
accounted for the most variability in the variance of likelihood of testing if the <strong>GED</strong><br />
Tests had been available only in a computer-based format. A decrease of 11 points (1<br />
standard deviation) from the average on the computer comfort score corresponded to<br />
being twice as likely to indicate “It is unlikely that I would have taken the <strong>GED</strong> Tests” (if<br />
offered only in a computer-based version), or half as likely to indicate “It is likely that I<br />
would have taken the <strong>GED</strong> Tests” (if offered only in a computer-based version). An<br />
increase of 15 years (approximately 1.5 standard deviations) from the average age<br />
corresponded to being twice as likely to indicate “It is unlikely that I would have taken<br />
the <strong>GED</strong> Tests” (if offered only in a computer-based version), or half as likely to indicate