

AT WHAT COST?
At-What-Cost-Report-Sept-2016
At-What-Cost-Report-Sept-2016

Create successful ePaper yourself
Turn your PDF publications into a flip-book with our unique Google optimized e-Paper software.
Each of the costs in this table is described in more detail in what follows. Other costs are also discussed but not included<br />
in our overall estimate due to uncertainty over their magnitude, underscoring the importance of greater transparency and<br />
accountability for the policies. Hence, the cost reported here is likely to be lower than the true cost to taxpayers.<br />
The operation of the offshore processing system, and the onshore immigration detention network, account for most of<br />
the cost associated with Australia’s deterrence policies. Budget documents reveal that in the last three years (ie July 2013<br />
to June 2016) the Government has spent around $9.2 billion for offshore processing and immigration detention of ‘illegal<br />
maritime arrivals’ (IMAs), and expects to spend between $3.9 and $5.5 billion over the next four years.<br />
The costs incurred depend partly on the structural settings of the policies – how mandatory detention directs people<br />
claiming asylum to one of the four categories of offshore processing, onshore detention, community detention or Bridging<br />
Visa-E; and partly on the numbers of people in each of these categories – both those that are already in the system in<br />
each of the components and those new arrivals attempting to seek asylum. Since the latter are influenced by the structural<br />
settings, there is a transition between the old policy of onshore processing and permanent protection visas to the new<br />
settings which has resulted in around 1,500 people who set out to seek asylum in Australia relocated to Manus Island or<br />
Nauru, and several boats turned around at the border.<br />
In what follows we look at the trends in the numbers of people in processing and detention, and the structural factors and<br />
activities that contribute towards the cost. First an overview is obtained by examining trends in total IMA and the current<br />
cross section, and the relative average costs across the categories of detention. Then we examine the cost of key policy<br />
elements in more detail.<br />
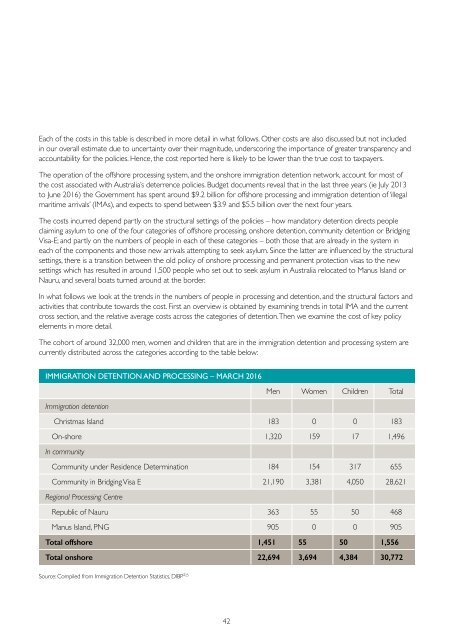
The cohort of around 32,000 men, women and children that are in the immigration detention and processing system are<br />
currently distributed across the categories according to the table below:<br />
IMMIGR<strong>AT</strong>ION DETENTION AND PROCESSING – MARCH 2016<br />
Men Women Children Total<br />
Immigration detention<br />
Christmas Island 183 0 0 183<br />
On-shore 1,320 159 17 1,496<br />
In community<br />
Community under Residence Determination 184 154 317 655<br />
Community in Bridging Visa E 21,190 3,381 4,050 28,621<br />
Regional Processing Centre<br />
Republic of Nauru 363 55 50 468<br />
Manus Island, PNG 905 0 0 905<br />
Total offshore 1,451 55 50 1,556<br />
Total onshore 22,694 3,694 4,384 30,772<br />
Source: Compiled from Immigration Detention Statistics, DIBP 225<br />
42