- Page 1 and 2: SECOND EDITION ELECTROCHEMICAL METH
- Page 3 and 4: PREFACE In the twenty years since t
- Page 5 and 6: CONTENTS MAJOR SYMBOLS ix STANDARD
- Page 7 and 8: Major Symbols Symbol Meaning Usual
- Page 9 and 10: xii Major Symbols Symbol Meaning Us
- Page 11 and 12: xiv Major Symbols Symbol Meaning Us
- Page 13 and 14: xvi Major Symbols Symbol Meaning Us
- Page 15 and 16: xviii Major Symbols Symbol Meaning
- Page 17 and 18: xx Major Symbols Abbreviation Meani
- Page 19 and 20: CHAPTER 1 INTRODUCTION AND OVERVIEW
- Page 21 and 22: Pt H 2 1.1 Introduction 3 Zn Ag С
- Page 23 and 24: 1.1 Introduction 5 Power supply -Ag
- Page 25 and 26: 1.1 Introduction 7 idation of Br~ t
- Page 27 and 28: 1.1 Introduction Hg/I-Г, ВГ(1 М
- Page 29 and 30: 1.2 Nonfaradaic Processes and the N
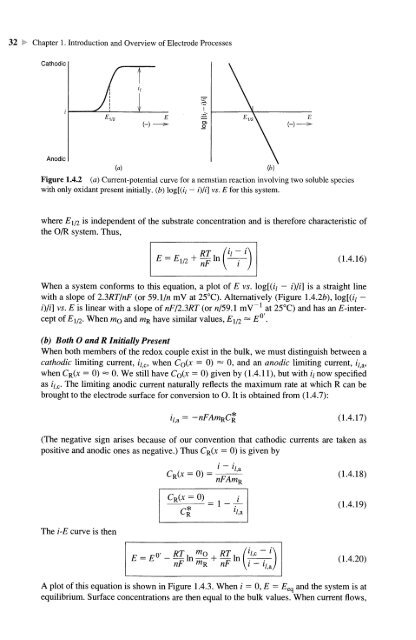
- Page 31 and 32: 1.2 Nonfaradaic Processes and the N
- Page 33 and 34: 1.2 Nonfaradaic Processes and the N
- Page 35 and 36: 1.2 Nonfaradaic Processes and the N
- Page 37 and 38: 1.3 Faradaic Processes and Factors
- Page 39 and 40: 1.3 Faradaic Processes and Factors
- Page 41 and 42: 1.3 Faradaic Processes and Factors
- Page 43 and 44: 1.3 Faradaic Processes and Factors
- Page 45 and 46: 1.3 Faradaic Processes and Factors
- Page 47 and 48: 1.4 Introduction to Mass-Transfer-C
- Page 49: 1.4 Introduction to Mass-Transfer-C
- Page 53 and 54: 1.4 Introduction to Mass-Transfer-C
- Page 55 and 56: 1.5 Semiempirical Treatment of Nems
- Page 57 and 58: 1.6 The Literature of Electrochemis
- Page 59 and 60: 1.6 The Literature of Electrochemis
- Page 61 and 62: 1.8 Problems 43 1.6 For the electro
- Page 63 and 64: Thus the net cell reaction is 1 Zn
- Page 65 and 66: 2.1 Basic Electrochemical Thermodyn
- Page 67 and 68: 2.1 Basic Electrochemical Thermodyn
- Page 69 and 70: 2.1 Basic Electrochemical Thermodyn
- Page 71 and 72: 2.1 Basic Electrochemical Thermodyn
- Page 73 and 74: 2.2 A More Detailed View of Interfa
- Page 75 and 76: 2.2 A More Detailed View of Interfa
- Page 77 and 78: 2.2 A More Detailed View of Interfa
- Page 79 and 80: (a) Properties of the Electrochemic
- Page 81 and 82: 2.3 Liquid Junction Potentials л :
- Page 83 and 84: 2.3 Liquid Junction Potentials < 65
- Page 85 and 86: 2.3 Liquid Junction Potentials 67 T
- Page 87 and 88: 2.3 Liquid Junction Potentials 69 W
- Page 89 and 90: 2.3 Liquid Junction Potentials «I
- Page 91 and 92: 2.3 Liquid Junction Potentials : 73
- Page 93 and 94: 2.4 Selective Electrodes \ 75 Ag wi
- Page 95 and 96: 2.4 Selective Electrodes 77 The fir
- Page 97 and 98: Other Ion-Selective Electrodes 2.4
- Page 99 and 100: 2.4 Selective Electrodes •« 81 (
- Page 101 and 102:
2.5 References 83 8. M. W. Chase, J
- Page 103 and 104:
2.3 Devise a cell in which the foll
- Page 105 and 106:
3 KINETICS OF ELECTRODE REACTIONS I
- Page 107 and 108:
3.1 Review of Homogeneous Kinetics
- Page 109 and 110:
3.2 Essentials of Electrode Reactio
- Page 111 and 112:
3.3 Butler-Volmer Model of Electrod
- Page 113 and 114:
3.3 Butler-Volmer Model of Electrod
- Page 115 and 116:
3.3 Butler-Volmer Model of Electrod
- Page 117 and 118:
3.4 Implications of the Butler-Volm
- Page 119 and 120:
3.4 Implications of the Butler-Volm
- Page 121 and 122:
3.4 Implications of the Butler-Volm
- Page 123 and 124:
Г " т - ') = e f(E-E«) ( 3 A 2 7
- Page 125 and 126:
3.5 Multistep Mechanisms 107 -200 -
- Page 127 and 128:
3.5 Multistep Mechanisms 109 one-st
- Page 129 and 130:
3.5 Multistep Mechanisms 111 which
- Page 131 and 132:
3.5 Multistep Mechanisms 113 dent o
- Page 133 and 134:
3.6 Microscopic Theories of Charge
- Page 135 and 136:
3.6 Microscopic Theories of Charge
- Page 137 and 138:
3.6 Microscopic Theories of Charge
- Page 139 and 140:
3.6 Microscopic Theories of Charge
- Page 141 and 142:
3.6 Microscopic Theories of Charge
- Page 143 and 144:
3.6 Microscopic Theories of Charge
- Page 145 and 146:
3.6 Microscopic Theories of Charge
- Page 147 and 148:
3.6 Microscopic Theories of Charge
- Page 149 and 150:
3.6 Microscopic Theories of Charge
- Page 151 and 152:
3.7 References 133 17. J. A. V. But
- Page 153 and 154:
3.8 Problems 135 Use a spreadsheet
- Page 155 and 156:
CHAPTER 4 MASS TRANSFER BY MIGRATIO
- Page 157 and 158:
4.2 Migration 139 component at any
- Page 159 and 160:
4.3 Mixed Migration and Diffusion N
- Page 161 and 162:
4.3 Mixed Migration and Diffusion N
- Page 163 and 164:
4.3 Mixed Migration and Diffusion N
- Page 165 and 166:
4.4 Diffusion i 147 -5/ -41 -31 -21
- Page 167 and 168:
4.4 Diffusion 149 net mass-transfer
- Page 169 and 170:
4.4 Diffusion 151 X IТ i i i \ \\
- Page 171 and 172:
4.5 References i 153 4.4.4 Solution
- Page 173 and 174:
4.6 Problems 155 4.4 The mobility,
- Page 175 and 176:
5.1 Overview of Step Experiments 15
- Page 177 and 178:
5.1 Overview of Step Experiments 15
- Page 179 and 180:
5.2 Potential Step Under Diffusion
- Page 181 and 182:
and inversion produces the current-
- Page 183 and 184:
5.2 Potential Step Under Diffusion
- Page 185 and 186:
5.2 Potential Step Under Diffusion
- Page 187 and 188:
5.3 Diffusion-Controlled Currents a
- Page 189 and 190:
Responses to a Large-Amplitude Pote
- Page 191 and 192:
5.3 Diffusion-Controlled Currents a
- Page 193 and 194:
5.3 Diffusion-Controlled Currents a
- Page 195 and 196:
5.4 Sampled-Current Voltammetry for
- Page 197 and 198:
5.4 Sampled-Current Voltammetry for
- Page 199 and 200:
5.4 Sampled-Current Voltammetry for
- Page 201 and 202:
5.4 Sampled-Current Voltammetry for
- Page 203 and 204:
5.4 Sampled-Current Voltammetry for
- Page 205 and 206:
5.4 Sampled-Current Voltammetry for
- Page 207 and 208:
5.4 Sampled-Current Voltammetry for
- Page 209 and 210:
5.5 Sampled-Current Voltammetry for
- Page 211 and 212:
5.5 Sampled-Current Voltammetry for
- Page 213 and 214:
5.5 Sampled-Current Voltammetry for
- Page 215 and 216:
5.5 Sampled-Current Voltammetry for
- Page 217 and 218:
5.5 Sampled-Current Voltammetry for
- Page 219 and 220:
5.5 Sampled-Current Voltammetry for
- Page 221 and 222:
5.5 Sampled-Current Voltammetry for
- Page 223 and 224:
5.6 Multicomponent Systems and Mult
- Page 225 and 226:
5.7 Chronoamperometric Reversal Tec
- Page 227 and 228:
5.7 Chronoamperometric Reversal Tec
- Page 229 and 230:
5.8 Chronocoulometry 211 nal-to-noi
- Page 231 and 232:
5.8 Chronocoulometry 213 100 200 30
- Page 233 and 234:
5.8 Chronocoulometry «i 215 The ap
- Page 235 and 236:
5.9 Special Applications of Ultrami
- Page 237 and 238:
5.9 Special Applications of Ultrami
- Page 239 and 240:
5.10 References « 221 would diffus
- Page 241 and 242:
5.11 Problems 223 0.2, 0.5, 1, 2, 3
- Page 243 and 244:
5.11 Problems < 225 5.19 G. Denault
- Page 245 and 246:
6.1 Introduction -I 227 0 t E t E°
- Page 247 and 248:
6.2 Nemstian (Reversible) Systems 2
- Page 249 and 250:
6.2 Nemstian (Reversible) Systems <
- Page 251 and 252:
6.2 Nernstian (Reversible) Systems
- Page 253 and 254:
where Introducing E(t) from (6.2.1)
- Page 255 and 256:
6.4 Quasireversible Systems *4 237
- Page 257 and 258:
6.5 Cyclic Voltammetry 239 Figure 6
- Page 259 and 260:
6.5 Cyclic Voltammetry 241 0.5 -0.3
- Page 261 and 262:
6.6 Multicomponent Systems and Mult
- Page 263 and 264:
6.6 Multicomponent Systems and Mult
- Page 265 and 266:
6.7 Convolutive or Semi-Integral Te
- Page 267 and 268:
6.7 Convolutive or Semi-Integral Te
- Page 269 and 270:
6.7 Convolutive or Semi-Integral Te
- Page 271 and 272:
6.8 Cyclic Voltammetry of the Liqui
- Page 273 and 274:
6.9 References 255 100 I -100 I I I
- Page 275 and 276:
6.10 Problems 257 20 r- 15 /, цА
- Page 277 and 278:
6.10 Problems *« 259 -0.8 -1.0 -1.
- Page 279 and 280:
CHAPTER 7 POLAROGRAPHY AND PULSE VO
- Page 281 and 282:
7.1 Behavior at Polarographic Elect
- Page 283 and 284:
7.1 Behavior at Polarographic Elect
- Page 285 and 286:
7.1 Behavior at Polarographic Elect
- Page 287 and 288:
7.1 Behavior at Polarographic Elect
- Page 289 and 290:
7.1 Behavior at Polarographic Elect
- Page 291 and 292:
7.2 Polarographic Waves 273 Kouteck
- Page 293 and 294:
7.3 PULSE VOLTAMMETRY 7.3 Pulse Vol
- Page 295 and 296:
7.3 Pulse Voltammetry 277 -0.4 -0.6
- Page 297 and 298:
7.3 Pulse Voltammetry < 279 • Dro
- Page 299 and 300:
7.3 Pulse Voltammetry 281 Potential
- Page 301 and 302:
7.3 Pulse Voltammetry 283 duration
- Page 303 and 304:
7.3 Pulse Voltammetry \. 285 cant c
- Page 305 and 306:
7.3 Pulse Voltammetry < 287 Second
- Page 307 and 308:
7.3 Pulse Voltammetry 289 The shape
- Page 309 and 310:
7.3 Pulse Voltammetry I 291 one ref
- Page 311 and 312:
7.3 Pulse Voltammetry 293 effects o
- Page 313 and 314:
7.3 Pulse Voltammetry 295 In genera
- Page 315 and 316:
7.3 Pulse Voltammetry < 297 1.0 i
- Page 317 and 318:
7.3 Pulse Voltammetry 299 (d) Appli
- Page 319 and 320:
7.4 References 301 Therefore, the b
- Page 321 and 322:
7.5 Problems < 303 49. L. Ramaley a
- Page 323 and 324:
8 CONTROLLED-CURRENT TECHNIQUES 8.1
- Page 325 and 326:
8.2 General Theory of Controlled-Cu
- Page 327 and 328:
8.2 General Theory of Controlled-Cu
- Page 329 and 330:
8.2.3 Programmed Current Chronopote
- Page 331 and 332:
8.3 Potential-Time Curves in Consta
- Page 333 and 334:
8.3 Potential-Time Curves in Consta
- Page 335 and 336:
8.4 Reversal Techniques 317 connect
- Page 337 and 338:
8.5 Multicomponent Systems and Mult
- Page 339 and 340:
8.6 The Galvanostatic Double Pulse
- Page 341 and 342:
8.7 Charge Step (Coulostatic) Metho
- Page 343 and 344:
8.7 Charge Step (Coulostatic) Metho
- Page 345 and 346:
8.7 Charge Step (Coulostatic) Metho
- Page 347 and 348:
8.9 Problems 329 electrolysis time
- Page 349 and 350:
CHAPTER 9 METHODS INVOLVING FORCED
- Page 351 and 352:
9.2 Theoretical Treatment of Convec
- Page 353 and 354:
9.3 Rotating Disk Electrode 335 9.3
- Page 355 and 356:
9.3 Rotating Disk Electrode 337 Fig
- Page 357 and 358:
9.3 Rotating Disk Electrode i 339 T
- Page 359 and 360:
9.3 Rotating Disk Electrode 341 For
- Page 361 and 362:
9.3 Rotating Disk Electrode 343 1 0
- Page 363 and 364:
9.3 Rotating Disk Electrode 345 to
- Page 365 and 366:
7iim» o f j lim =l№l(i u /A)s l/
- Page 367 and 368:
9.4 Rotating Ring and Ring-Disk Ele
- Page 369 and 370:
9.4 Rotating Ring and Ring-Disk Ele
- Page 371 and 372:
9.5 Transients at the RDE and RRDE
- Page 373 and 374:
9.5.2 Transients at the RRDE 9.5 Tr
- Page 375 and 376:
9.6 Modulated RDE «1 357 600 400 -
- Page 377 and 378:
9.6 Modulated RDE < 359 Full-wave r
- Page 379 and 380:
9.7 Convection at Ultramicroelectro
- Page 381 and 382:
9.8 Electrohydrodynamics and Relate
- Page 383 and 384:
9.10 Problems 365 40. D. A. Saville
- Page 385 and 386:
9.10 Problems 367 +1.0 -0.2 Figure
- Page 387 and 388:
ЮЛ Introduction 369 Potentiometer
- Page 389 and 390:
10.1 Introduction 371 Figure 10.1.3
- Page 391 and 392:
10.1 Introduction 373 In this way w
- Page 393 and 394:
10.1 Introduction 375 *I_L -3 -2 -1
- Page 395 and 396:
10.2 Interpretation of the Faradaic
- Page 397 and 398:
10.2 Interpretation of the Faradaic
- Page 399 and 400:
10.3 Kinetic Parameters from Impeda
- Page 401 and 402:
10.4 Electrochemical Impedance Spec
- Page 403 and 404:
10.4 Electrochemical Impedance Spec
- Page 405 and 406:
10.4 Electrochemical Impedance Spec
- Page 407 and 408:
10.5 ас Voltammetry < 389 voltamm
- Page 409 and 410:
10.5 ас Voltammetry «I 391 exper
- Page 411 and 412:
10.5 ас Voltammetry 393 heterogen
- Page 413 and 414:
10.5 ас Voltammetry 395 This maxi
- Page 415 and 416:
10.5 ас Voltammetry < 397 The str
- Page 417 and 418:
10.5 ас Voltammetry -Щ 399 peak
- Page 419 and 420:
10.6 Higher Harmonics -m 401 f В R
- Page 421 and 422:
10.6 Higher Harmonics 403 Output H
- Page 423 and 424:
10.7 Chemical Analysis by ac Voltam
- Page 425 and 426:
10.8 Instrumentation for Electroche
- Page 427 and 428:
10.8 Instrumentation for Electroche
- Page 429 and 430:
10.9 Analysis of Data in the Laplac
- Page 431 and 432:
10.9 Analysis of Data in the Laplac
- Page 433 and 434:
10.11 Problems « 415 22. J. Vareec
- Page 435 and 436:
CHAPTER 11 BULK ELECTROLYSIS METHOD
- Page 437 and 438:
General Considerations in Bulk Elec
- Page 439 and 440:
General Considerations in Bulk Elec
- Page 441 and 442:
Controlled-Potential Methods < 423
- Page 443 and 444:
Controlled-Potential Methods 425 lo
- Page 445 and 446:
11.3.3 Electroseparations Controlle
- Page 447 and 448:
Controlled-Potential Methods 429 ur
- Page 449 and 450:
Controlled-Current Methods ^ 431 Ba
- Page 451 and 452:
Controlled-Current Methods i 433 Th
- Page 453 and 454:
Electrometric End-Point Detection 4
- Page 455 and 456:
Electrometric End-Point Detection i
- Page 457 and 458:
Electrometric End-Point Detection <
- Page 459 and 460:
Flow Electrolysis 441 11.6 FLOW ELE
- Page 461 and 462:
Flow Electrolysis ) = nFv dC o (x)
- Page 463 and 464:
Flow Electrolysis 445 This allows t
- Page 465 and 466:
Flow Electrolysis ^ 447 I Solution
- Page 467 and 468:
Flow Electrolysis 449 Spacer Auxili
- Page 469 and 470:
Flow Electrolysis 451 are much high
- Page 471 and 472:
Thin-Layer Electrochemistry 453 Mic
- Page 473 and 474:
Thin-Layer Electrochemistry 455 thr
- Page 475 and 476:
Thin-Layer Electrochemistry 457 -0.
- Page 477 and 478:
Stripping Analysis 459 Deposition (
- Page 479 and 480:
Stripping Analysis 461 -0.6 Figure
- Page 481 and 482:
Stripping Analysis 463 0 -0.2 1 1 1
- Page 483 and 484:
References 465 7. N. Tanaka, op. ci
- Page 485 and 486:
Problems 467 1.0 +0.8 +0.6 +0.4 +0.
- Page 487 and 488:
Problems 469 are equal and (b) thos
- Page 489 and 490:
CHAPTER 12 ELECTRODE REACTIONS WITH
- Page 491 and 492:
12.1 Classification of Reactions i
- Page 493 and 494:
12.1 Classification of Reactions 47
- Page 495 and 496:
12.1 Classification of Reactions 47
- Page 497 and 498:
12.1 Classification of Reactions 47
- Page 499 and 500:
12.2 Fundamentals of Theory for Vol
- Page 501 and 502:
(as above) дС т д2 С т С О2
- Page 503 and 504:
12.2 Fundamentals of Theory for Vol
- Page 505 and 506:
12.3 Theory for Transient Voltammet
- Page 507 and 508:
12.3 Theory for Transient Voltammet
- Page 509 and 510:
12.3 Theory for Transient Voltammet
- Page 511 and 512:
12.3 Theory for Transient Voltammet
- Page 513 and 514:
12.3 Theory for Transient Voltammet
- Page 515 and 516:
12.3 Theory for Transient Voltammet
- Page 517 and 518:
12.3 Theory for Transient Voltammet
- Page 519 and 520:
Catalytic Reaction—E r Cj 12.3 Th
- Page 521 and 522:
12.3 Theory for Transient Voltammet
- Page 523 and 524:
12.3 Theory for Transient Voltammet
- Page 525 and 526:
Icurr< 12.3 Theory for Transient Vo
- Page 527 and 528:
12.3 Theory for Transient Voltammet
- Page 529 and 530:
12.3 Theory for Transient Voltammet
- Page 531 and 532:
12.3 Theory for Transient Voltammet
- Page 533 and 534:
12.3 Theory for Transient Voltammet
- Page 535 and 536:
12.4 Rotating Disk and Ring-Disk Me
- Page 537 and 538:
12.4 Rotating Disk and Ring-Disk Me
- Page 539 and 540:
12.4 Rotating Disk and Ring-Disk Me
- Page 541 and 542:
12.7 Controlled-Potential Coulometr
- Page 543 and 544:
12.7 Controlled-Potential Coulometr
- Page 545 and 546:
12.7 Controlled-Potential Coulometr
- Page 547 and 548:
12.8 References « 529 12.8 REFEREN
- Page 549 and 550:
12.9 Problems =4 531 92. G. Denuaul
- Page 551 and 552:
12.9 Problems 533 12.11 Consider cu
- Page 553 and 554:
13.1 Thermodynamics of the Double L
- Page 555 and 556:
13.1 Thermodynamics of the Double L
- Page 557 and 558:
13.2 Experimental Evaluation of Sur
- Page 559 and 560:
13.2 Experimental Evaluation of Sur
- Page 561 and 562:
13.2.3 Relative Surface Excesses 13
- Page 563 and 564:
13.3 Models for Double-Layer Struct
- Page 565 and 566:
The total charge per unit volume in
- Page 567 and 568:
13.3 Models for Double-Layer Struct
- Page 569 and 570:
13.3 Models for Double-Layer Struct
- Page 571 and 572:
13.3 Models for Double-Layer Struct
- Page 573 and 574:
13.3 Models for Double-Layer Struct
- Page 575 and 576:
13.4 Studies at Solid Electrodes 55
- Page 577 and 578:
13.4 Studies at Solid Electrodes 55
- Page 579 and 580:
13.4 Studies at Solid Electrodes 56
- Page 581 and 582:
13.5 Extent and Rate of Specific Ad
- Page 583 and 584:
13.5 Extent and Rate of Specific Ad
- Page 585 and 586:
13.5 Extent and Rate of Specific Ad
- Page 587 and 588:
13.6 Effect of Adsorption of Electr
- Page 589 and 590:
13.7 Double-Layer Effects on Electr
- Page 591 and 592:
13.7.2 Double-Layer Effects in the
- Page 593 and 594:
13.8 Referencess 575 / / / 4 —% -
- Page 595 and 596:
13.9 Problems 577 64. D. M. Mohilne
- Page 597 and 598:
13.9 Problems 579 13.13 Aramata and
- Page 599 and 600:
14.2 Types, Preparation, and Proper
- Page 601 and 602:
14.2 Types, Preparation, and Proper
- Page 603 and 604:
14.2 Types, Preparation, and Proper
- Page 605 and 606:
14.2 Types, Preparation, and Proper
- Page 607 and 608:
14.3 Electrochemical Responses of A
- Page 609 and 610:
14.3 Electrochemical Responses of A
- Page 611 and 612:
14.3 Electrochemical Responses of A
- Page 613 and 614:
14.3 Electrochemical Responses of A
- Page 615 and 616:
14.3 Electrochemical Responses of A
- Page 617 and 618:
14.3 Electrochemical Responses of A
- Page 619 and 620:
14.3 Electrochemical Responses of A
- Page 621 and 622:
14.3 Electrochemical Responses of A
- Page 623 and 624:
14.3 Electrochemical Responses of A
- Page 625 and 626:
14.3 Electrochemical Responses of A
- Page 627 and 628:
14.4 Overview of Processes at Modif
- Page 629 and 630:
14.4 Overview of Processes at Modif
- Page 631 and 632:
where the permeation current, ip, i
- Page 633 and 634:
14.4 Overview of Processes at Modif
- Page 635 and 636:
14.4 Overview of Processes at Modif
- Page 637 and 638:
14.5 Blocking Layers 619 One can al
- Page 639 and 640:
14.5 Blocking Layers 621 current at
- Page 641 and 642:
14.5 Blocking Layers 623 The parame
- Page 643 and 644:
14.5 Blocking Layers 625 at the ele
- Page 645 and 646:
14.6 Other Methods of Characterizat
- Page 647 and 648:
14.7 References . 629 (b) H. S. Whi
- Page 649 and 650:
14.8 Problems 631 15 20 25 [ВГ],
- Page 651 and 652:
15.1 Operational Amplifiers 633 +15
- Page 653 and 654:
15.2 Current Feedback 635 (f) Other
- Page 655 and 656:
15.2 Current Feedback < 637 i Figur
- Page 657 and 658:
15.3 Voltage Feedback * 639 This ki
- Page 659 and 660:
15.4 Potentiostats 641 Counter Work
- Page 661 and 662:
15.4 Potentiostats -4 643 I Potenti
- Page 663 and 664:
15.6 Difficulties with Potential Co
- Page 665 and 666:
15.6 Difficulties with Potential Co
- Page 667 and 668:
15.6 Difficulties with Potential Co
- Page 669 and 670:
15.7 Measurement of Low Currents
- Page 671 and 672:
15.8 Computer-Controlled Instrument
- Page 673 and 674:
15.9 Troubleshooting Electrochemica
- Page 675 and 676:
15.11 Problems 657 25. P. He, J. P.
- Page 677 and 678:
CHAPTER 16 SCANNING PROBE TECHNIQUE
- Page 679 and 680:
16.2 Scanning Tunneling Microscopy
- Page 681 and 682:
16.2 Scanning Tunneling Microscopy
- Page 683 and 684:
16.2 Scanning Tunneling Microscopy
- Page 685 and 686:
16.3 Atomic Force Microscopy 667 no
- Page 687 and 688:
16.4 Scanning Electrochemical Micro
- Page 689 and 690:
16.4 Scanning Electrochemical Micro
- Page 691 and 692:
16.4 Scanning Electrochemical Micro
- Page 693 and 694:
16.4 Scanning Electrochemical Micro
- Page 695 and 696:
16.4 Scanning Electrochemical Micro
- Page 697 and 698:
16.6 Problems 679 tip and the subst
- Page 699 and 700:
17.1 Ultraviolet and Visible Spectr
- Page 701 and 702:
17.1 Ultraviolet and Visible Spectr
- Page 703 and 704:
17.1 Ultraviolet and Visible Spectr
- Page 705 and 706:
17.1 Ultraviolet and Visible Spectr
- Page 707 and 708:
17.1 Ultraviolet and Visible Spectr
- Page 709 and 710:
17.1 Ultraviolet and Visible Spectr
- Page 711 and 712:
17.1 Ultraviolet and Visible Spectr
- Page 713 and 714:
17.1 Ultraviolet and Visible Spectr
- Page 715 and 716:
17.1 Ultraviolet and Visible Spectr
- Page 717 and 718:
17.1 Ultraviolet and Visible Spectr
- Page 719 and 720:
17.2 Vibrational Spectroscopy 701 R
- Page 721 and 722:
17.2 Vibrational Spectroscopy ; 703
- Page 723 and 724:
17.2 Vibrational Spectroscopy 705 h
- Page 725 and 726:
17.2 Vibrational Spectroscopy 707 0
- Page 727 and 728:
17.3 Electron and Ion Spectrometry
- Page 729 and 730:
17.3 Electron and Ion Spectrometry
- Page 731 and 732:
17.3 Electron and Ion Spectrometry
- Page 733 and 734:
17.3 Electron and Ion Spectrometry
- Page 735 and 736:
17.3 Electron and Ion Spectrometry
- Page 737 and 738:
17.3 Electron and Ion Spectrometry
- Page 739 and 740:
17.3 Electron and Ion Spectrometry
- Page 741 and 742:
17.4 Magnetic Resonance Methods 723
- Page 743 and 744:
17.5 Quartz Crystal Microbalance 72
- Page 745 and 746:
17.5 Quartz Crystal Microbalance ;
- Page 747 and 748:
17.6 X-Ray Methods 729 few millimet
- Page 749 and 750:
17.7 References 731 17.7 REFERENCES
- Page 751 and 752:
17.7 References =- 733 87. D. M. Ko
- Page 753 and 754:
17.8 Problems 735 17.2 Given D = 6.
- Page 755 and 756:
18.1 ElectrogeneratedChemiluminesce
- Page 757 and 758:
18.1 ElectrogeneratedChemiluminesce
- Page 759 and 760:
18.1 ElectrogeneratedChemiluminesce
- Page 761 and 762:
18.1 ElectrogeneratedChemiluminesce
- Page 763 and 764:
18.2 Photoelectrochemistry at Semic
- Page 765 and 766:
18.2 Photoelectrochemistry at Semic
- Page 767 and 768:
18.2 Photoelectrochemistry at Semic
- Page 769 and 770:
18.2 Photoelectrochemistry at Semic
- Page 771 and 772:
18.2 Photoelectrochemistry at Semic
- Page 773 and 774:
18.2 Photoelectrochemistry at Semic
- Page 775 and 776:
18.2 Photoelectrochemistry at Semic
- Page 777 and 778:
18.2 Photoelectrochemistry at Semic
- Page 779 and 780:
18.3 Electrochemical Detection of P
- Page 781 and 782:
18.3 Electrochemical Detection of P
- Page 783 and 784:
18.4 References ! 765 41. L. L. Shu
- Page 785 and 786:
18.5 Problems 767 18.4 The transien
- Page 787 and 788:
А Р Р #Й D IX А MATHEMATICAL M
- Page 789 and 790:
АЛ Solving Differential Equations
- Page 791 and 792:
А. 1 Solving Differential Equation
- Page 793 and 794:
А. 1 Solving Differential Equation
- Page 795 and 796:
А.2 Taylor Expansions 777 10 Figur
- Page 797 and 798:
А.З The Error Function and the Ga
- Page 799 and 800:
А.5 Complex Notation «i 781 A val
- Page 801 and 802:
А.8 Problems 783 In most applicati
- Page 803 and 804:
APPENDIX В DIGITAL SIMULATIONS OF
- Page 805 and 806:
ut the definition of a derivative a
- Page 807 and 808:
B.I Setting Up the Model 789 1. C*
- Page 809 and 810:
B.I Setting Up the Model 791 could
- Page 811 and 812:
В.2 An Example < 793 and imax « 6
- Page 813 and 814:
В.2 An Example « 795 mensionless
- Page 815 and 816:
В.З Incorporating Homogeneous Kin
- Page 817 and 818:
В.4 Boundary Conditions for Variou
- Page 819 and 820:
В.4 Boundary Conditions for Variou
- Page 821 and 822:
В.6 Miscellaneous Digital Simulati
- Page 823 and 824:
В.6 Miscellaneous Digital Simulati
- Page 825 and 826:
В.8 Problems 807 / B vs. x f° r t
- Page 827 and 828:
TABLE C.I (continued) Reaction 2H +
- Page 829 and 830:
Reference Tables 811 TABLE C.3 Esti
- Page 831 and 832:
Referem TABLE C.4 Selected Diffusio
- Page 833 and 834:
816 • Index Blocking polymers, 58
- Page 835 and 836:
818 Index Convective-diffusion equa
- Page 837 and 838:
820 Index Dropping mercury electrod
- Page 839 and 840:
822 ; Index Ellipsometry, described
- Page 841 and 842:
824 Index Instrumentation (continue
- Page 843 and 844:
826 Index Multicomponent systems: m
- Page 845 and 846:
828 Index Potential step methods (c
- Page 847 and 848:
830 • Index Sampled-current volta
- Page 849 and 850:
832 Index Thin-layer electrochemist