PDF Download ATB 701 QC - Kirchner Elektronik
PDF Download ATB 701 QC - Kirchner Elektronik
PDF Download ATB 701 QC - Kirchner Elektronik

Create successful ePaper yourself
Turn your PDF publications into a flip-book with our unique Google optimized e-Paper software.
<strong>Kirchner</strong> elektronik<br />
___________________________________________________________________________<br />
<strong>Kirchner</strong> elektronik, Wilhelm-Bode-Str. 38, D - 38106 Braunschweig<br />
Handbook<br />
<strong>ATB</strong> <strong>QC</strong> – Quality Control Program
1. The introduction of the system .......................................................3<br />
1.1 Frequency response test ............................................................................................. 4<br />
1.2 Rub&Buss test............................................................................................................ 4<br />
1.3 THD test ..................................................................................................................... 5<br />
1.4 Polarity test................................................................................................................. 5<br />
2. How to set the definitions...............................................................6<br />
2.1 The frequency response definition ............................................................................. 6<br />
2.1.1 The automatic tolerance mask setting ................................................................ 6<br />
2.1.2 The manual tolerance setting.............................................................................. 8<br />
2.1.3 Automatically adoption of curve........................................................................ 9<br />
2.2 The Rub&Buss definition......................................................................................... 10<br />
2.2.1 The setting of the tolerance .............................................................................. 10<br />
2.3 The THD definition.................................................................................................. 11<br />
2.4 The Polarity definition ............................................................................................. 12<br />
2.3 Saving the definition ................................................................................................ 12<br />
3. The <strong>QC</strong> measurement session ......................................................13<br />
3.1 Start of the session.................................................................................................... 13<br />
3.2 The measurement ..................................................................................................... 13<br />
3.3 The report ................................................................................................................. 14<br />
4. Example: Quality test measurement SPL .....................................15<br />
2
1. The introduction of the system<br />
The <strong>QC</strong> program is for the speaker industry for an automatic quality test.<br />
It is also for the automotive industry to test mounting of the speakers for undisturbed music<br />
reproduction.<br />
The test systems consist of the <strong>ATB</strong> <strong>QC</strong> program, the PC with a soundcard and a test box<br />
with a power amplifier for the connection of the speaker.<br />
There are several measurements in the test cycle. For the automatically passed or failed<br />
decision, each measurement has its own tolerance mask.<br />
One test cycle can include up to four measurements. These are the acoustic or electrical<br />
frequency response and three Rub&Buss measurements for woofer, mid and tweeter.<br />
The frequency response is tested with the M-PN stimulus. For the automatically and manual<br />
setting of the tolerance mask there is no need of an uncomfortable script.<br />
The Rub&Buss measurement tests the distortion and noise of the speaker. The stimulus for<br />
measurement is the signal 13. The Signal 13 is a combination of two sine waves with the<br />
frequency ratio of 1:1,3. This ratio makes that the signal is very good for the test of resonance.<br />
The signal also avoids the main problem of the acoustic Rub&Buss measurement. The<br />
surrounding noise normally disturbs the measurement. For the passed and failed decision<br />
there is the Q-index. The Q-Index includes all distortion and noise of the speaker. An other<br />
measurement for the quality testing is the THD. The right wiring is tested with the polarity<br />
test.<br />
For reporting and documentation the program writes a report file.<br />
3
1.1 Frequency response test<br />
The frequency response is tested with the M-PN signal. The measurement with this periodic<br />
noise gives the highest accuracy.<br />
The tolerance mask can be set automatically or manually.<br />
The picture shows the impedance test of a The picture shows the frequency response<br />
speaker for the test of the Thiele-Small parameter test of a speaker<br />
For the definition of the tolerance mask the frequency range and the upper and lower<br />
tolerance curve is set in.<br />
For the automatic setting the program calculates the tolerance curves. This tolerance mask is<br />
for the electrical measurement.<br />
For the manual setting the tolerance curves are set with the mouse click. This tolerance mask<br />
is for the acoustic measurement.<br />
1.2 Rub&Buss test<br />
The Rub&Buss is tested with the signal 13. The signal 13 consists of two sine-sweeps with<br />
the frequency ratio of 1 : 1.3. This signal is showing all resonances of the unit under test.<br />
Electrical test of the signal 13 Test of a broken speaker<br />
For the passed and failed decision the Q-Index is calculated. The index is calculated from all<br />
frequencies higher than the second frequency of the test Signal 13. The account is set into<br />
proportion to the amplitude of the test signal. The best speaker has the highest Q-index.<br />
The Rub&Buss measurement has following tests.<br />
Calculation of error<br />
1. THD, K2,………K10 The test is for the controlling of the placement of the voice coil.<br />
2. IMD The test is for the controlling the gluing, loose particle and if<br />
there are cone touching of connection wires.<br />
3. Frequencies > K5 The test is for the controlling of voice coil rubbing the magnet.<br />
4
1.3 THD test<br />
The THD test tested the harmonic distortion. The test signal is a sine wave with frequency is<br />
to select. Because this test is including in the Rub&Buss test it is only for the special demand<br />
of the manufacturer. In the definition there is to set the maximum THD and the frequency.<br />
1.4 Polarity test<br />
The polarity test is for testing the wiring. It is for speakers, headphones and microphones.<br />
The test signal is a half sine wave. In the time response the program calculated if the positive<br />
or negative amplitude is the greatest value.<br />
5
2. How to set the definitions<br />
For one test cycle there are up to four measurements. This is the frequency range and three<br />
Rub&Buss measurements for low, mid and high range.<br />
For editing the definition it is easy to switch from the definition-mood to test-measurement.<br />
2.1 The frequency response definition<br />
2.1.1 The automatic tolerance mask setting<br />
The automatic mask setting is to use for an electric measurement like the impedance test<br />
At first there is to do a frequency response measurement in the main program. For the<br />
description of the measurement refer to the <strong>ATB</strong> PC Pro manual. For the <strong>QC</strong> measurement<br />
the intern signal mood is used.<br />
Following parameters are to be set:<br />
The BMH signal is set<br />
DV-PCM (intern)<br />
The out level to 0dB<br />
The input level to 1/3 of the level meter<br />
The smoothing is depending on the quality of the speaker.<br />
For high quality speaker there is the smooth of 1/24 octave<br />
and for low quality speakers 1/3 octave.<br />
The parameters will be automatically set in the new definition.<br />
Also the in- and out level are parameters of the new definition.<br />
After the setting with the M+ measurement up to 32 speakers are measured. The plots will<br />
show the characteristic of the speaker. There will be one representing speaker. This plot is<br />
used for setting the definition.<br />
Then there is to open the Quality menu in the main program.<br />
After a click at the is to activate.<br />
6
In the menu the display is set to freq.<br />
The both plots for the thresholds are to be seen.<br />
To fit the plots to the measurement there is following function:<br />
The width is set with these commands<br />
In the edit-mood there is to set the frequency range and an individual form.<br />
The frequency range is set by a click with the right mouse button at the curve.<br />
Here is to decide with a left mouse click to set the lower or<br />
upper limit.<br />
The individual form with differs from the measurement curve is to set by first activating the<br />
upper or lower curve<br />
Then click with the left mouse key at the curve and drag it with holding the key.<br />
After the setting it is easy to make a test measurement.<br />
To make the test measurement and see the frequency range plot<br />
selecting freq in the cycle box<br />
and starting the measure with the<br />
7<br />
function.
After the measurement the edit-mood is to open with the button.<br />
After the return you get the definition you work on.<br />
2.1.2 The manual tolerance setting<br />
The manual tolerance setting is for the acoustic frequency response test.<br />
The Quality menu is to open and the is to activate.<br />
After a click at the button Q_defown menu is shown.<br />
Here is to set the frequency range for the<br />
tolerance curves with f-start and F-end.<br />
The level for expected measurement curve is<br />
to set at amp, and at tol+- there is to set the<br />
width of the tolerance mask. In sections is to<br />
set the number of section for the varying of<br />
the curve.<br />
After the setting it is easy to make a test measurement.<br />
To make the test measurement and see the frequency range selecting freq in the cycle box<br />
Here is also to set if there is an Amplitude or Impedance measurement.<br />
Starting the measure with the<br />
Function.<br />
After the measurement the edit-mood is to open with the button<br />
In the edit-mood there is to set the frequency range and an individual form.<br />
The frequency range is set by a click with the right mouse button at the curve.<br />
8
Here is to decide with a left mouse click whether it is the<br />
lower or upper limit.<br />
The individual form which differs from the measurement curve is to set by first activating the<br />
upper or lower curve and a with a click at the curve it is to drag.<br />
The figure shows the edited tolerance mask with the setting of sections = 30.<br />
2.1.3 Automatically adoption of curve<br />
The reference curves could be set absolute or relative to the amplitude of the speaker under<br />
test. The relative tolerance mask is for the test of the characteristic of the frequency response<br />
curve. If there is the need of a very accurate test of the characteristic of the frequency curve<br />
the try to move function is set.<br />
If the function is set the program tries to place the measured curve in the tolerance mask.<br />
The window shows the db for fitting the curve.<br />
9
2.2 The Rub&Buss definition<br />
The Rub&buss measurement is to test the mechanical quality of the speaker. In production<br />
line the speakers tend to have defects. These defects are cone displacement, rubbing voice coil<br />
and loose particles. The defect speaker produces an unwanted noise. An analysis of the noise<br />
shows short time and magnitude distortion. In former time the noise was tested with a THD<br />
measurement with analysing the energy of a high-order harmonics group. These are K13,<br />
K14,……..K20. For a real test there is the need of a non-static signal. Therefore, the newer<br />
systems used a sine-sweep or a combination of step and sine. The measurement with these<br />
signals has a problem with the surrounding noise. Therefore, the Signal 13 was developed<br />
from the <strong>Kirchner</strong> elektronik company. The signal consisting of the heterodyne of two sine<br />
waves with the ratio of 1:1,3 gives a non-static signal.<br />
The time domain of the Signal 13 The frequency spectrum of the Signal 13<br />
The time domain of the signal shows an always-varying wave. The signal excited all<br />
resonances of the unit under test. The resonances and the nonlinear transfer function show a<br />
spectrum with a great number of distortion frequencies.<br />
For the calculation of the Q-index the amplitude of distortion frequencies are added and set<br />
into proportion to the amplitudes of the Signal 13. This is a very good test for the quality of a<br />
device.<br />
For acoustic test of the speaker a quiet room is necessary. With the Signal 13 the Rub&Buss<br />
measurement is not so disturbed from the surrounding noise as other measurements. Because<br />
the frequencies below the Signal 13 are not considered, a HPF (High pass filter) suppresses<br />
low frequencies.<br />
2.2.1 The setting of the tolerance<br />
After the frequency measurement is to start the Rub&Buss test. First, there is to mark the<br />
Rub&Buss test for the test cycle. For a woofer is to mark “RBlow”, for a mid speaker<br />
“RBmid” and for a tweeter “RBhigh”. If there is a full range speaker box to test, mark all.<br />
Therefore, the test cycle includes four measurements.<br />
10
The measurement is started with “Refmeas Ql low”.<br />
After the measure there is a numeral shown in the test window. This numeral is the Q-index.<br />
After the test of many speakers, the numeral will differ in a range. According to this range<br />
there is to set the tolerance.<br />
To see the frequency range a measurement could be done by<br />
selecting Rblow in the cycle box<br />
and starting the measure with the<br />
To see the curve do mark in the display menu “RB”.<br />
function.<br />
After the measurement the edit-mood is to open with the button.<br />
When the definitions are set the next step is to save it.<br />
2.3 The THD definition<br />
For the THD definition is to set the distortion in % and the frequency.<br />
The distortion of the device is to measure in the main menu or with the test measurement in<br />
the <strong>QC</strong> menu.<br />
11
2.4 The Polarity definition<br />
For the definition there is to set if + or – and the test frequency.<br />
Please mark that most of the soundcard MIC inputs inverting the signal. Please try to find the<br />
right frequency in the test of the <strong>QC</strong> menu.<br />
2.3 Saving the definition<br />
After the setting of the definition there is menu for a description of the definition. Here is to<br />
set in company’s name, the user’s name and the session designation. In addition, there is to set<br />
in the designation of the units (device under test).<br />
After the definition is saved with “save definition button”.<br />
12
3. The <strong>QC</strong> measurement session<br />
3.1 Start of the session<br />
The quality control measurement is to start with loading the definition.<br />
There are following parameters set:<br />
Signal, BMH or RB<br />
Output level<br />
Input level<br />
Smoothing<br />
Tolerance mask<br />
Test cycle<br />
Try to move<br />
Description text<br />
Before the start there is to set the number of the first device under test.<br />
3.2 The measurement<br />
After the connection of the speaker and the placement of the microphone the first<br />
measurement is started. The measurement is started with a mouse click on test button<br />
alternatively, with the space key. If there was a problem with the measurement and it failed,<br />
there is a second function to start a new measurement without counting the failed one.<br />
This measure could also start with the F12 key.<br />
If there is the need of varying the test cycle, the marks for activating the measures could be<br />
set.<br />
After each measurement of the cycle there is the message if it is good or bad.<br />
13
3.3 The report<br />
For the session the program writes a report.<br />
The first line is date and the time for the start of the<br />
session.<br />
The first number is the number of the part. It is to set in<br />
the Serial No. menu for the part number.<br />
After the number there is the name of the measurement<br />
and the result of the test. It is followed by a<br />
documentation of the test.<br />
At the end of the session the report is saved with the save report button.<br />
14
4. Example: Quality test measurement SPL<br />
To make the definition for the SPL measurement.<br />
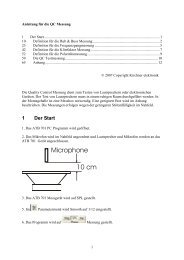
1. Connecting the <strong>701</strong> box to the PC with USB.<br />
2. Open the <strong>ATB</strong> <strong>701</strong> <strong>QC</strong> programme.<br />
3. Open the input Menu with . There click at .<br />
4. Open the input Menu with . There click at .I<br />
In the WAVE IN menu select .<br />
5. Open the output Menu with . There click at .<br />
6. Open the output menu with . There click at .<br />
In the SPEAKER menu disable LINE<br />
7. Make the if there is no one already.<br />
8. Connecting the speaker to COM of the <strong>ATB</strong> <strong>701</strong> box. The speaker shall be in the test box.<br />
9. Connecting the microphone to the <strong>ATB</strong> <strong>701</strong> box. Place the microphone in front of the<br />
speaker.<br />
10. Select in the main menu.<br />
11. In the SPL ACTIVE menu select<br />
15<br />
.
12. Open the parameter menu with the button.<br />
There select and .<br />
13. Start the first measurement with the button.<br />
14. Wary the OUT LEVEL CONTROL so far as the SPL curve will be seen at the<br />
top of plot.<br />
15. Open the <strong>QC</strong> measurement with the button.<br />
16. In the <strong>QC</strong> menu select at the left top in the <strong>QC</strong> menu.<br />
17. Click at . Then there is the definition menu at the left.<br />
18. Click at . You will see the thresholds for the measured SPL curve.<br />
19. To see the SPL curve select in the Display in the bottom of the<br />
menu. After click at the button. You will see<br />
the SPL curve .<br />
20. Click at to open the definition menu again.<br />
21. Expand the threshold with the function in the definition menu. Set<br />
30 for tol- and tol+.<br />
16
22. To edit the threshold click at in the definition menu. After click at the upper<br />
threshold curve with the left mouse button. While letting the button pushed down draw the<br />
curve.<br />
23. Click at in the definition menu to edit the lower threshold curve.<br />
24. There is to select the frequency range for the thresholds. For it click with the right mouse<br />
button at on of the threshold curve. Make the click at the frequency the SPL curve will drop<br />
for 15dB.<br />
25. In the top of the menu you will see a display with , For low<br />
frequencies select BELOW and for lower frequencies ABOVE.<br />
26 After this do make some test measurements with changing different speakers. Starting the<br />
measurement with the button by clicking at the<br />
button with the mouse or use the SPACE key.<br />
27. If the result display at the bottom of the menu get read, please expand the threshold at the<br />
point the SPL curve touching the threshold.<br />
28. Click at to open the definition menu again.<br />
29. To save the definition first set in the field the name of<br />
the speaker.<br />
30. Click at the button. Set in a name for the definition file<br />
and save it.<br />
31. For the test measurements open the definition with the button.<br />
17