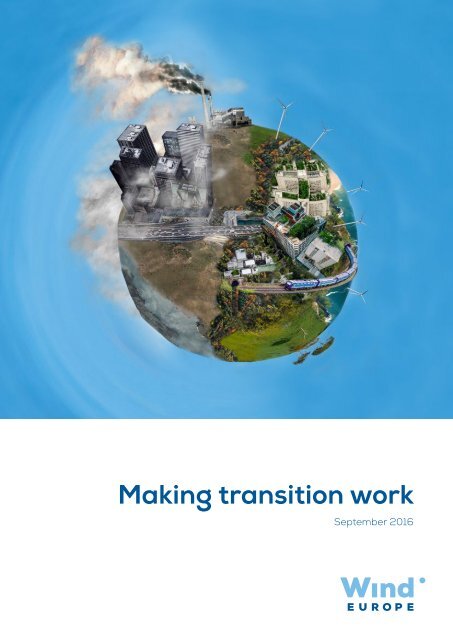
Making transition work - Wind Europe
This report provides clear elements on how to make transition work in the coming decade. It provides recommendations to policymakers on how to facilitate a swift transformation of the energy system and considers the policies that will make Europe the best choice for those investing in renewables.
This report provides clear elements on how to make transition work in the coming decade. It provides recommendations to policymakers on how to facilitate a swift transformation of the energy system and considers the policies that will make Europe the best choice for those investing in renewables.

You also want an ePaper? Increase the reach of your titles
YUMPU automatically turns print PDFs into web optimized ePapers that Google loves.
<strong>Making</strong> <strong>transition</strong> <strong>work</strong><br />
September 2016
<strong>Making</strong> <strong>transition</strong> <strong>work</strong><br />
September 2016<br />
windeurope.org
Foreword<br />
CEO FOREWORD<br />
It is a pleasure to present to you <strong>Wind</strong><strong>Europe</strong>’s flagship report “<strong>Making</strong> Transition Work”.<br />
Transition is all around us. The energy system is evolving rapidly. Fossil fuels are giving way to renewables. Electricity<br />
markets are undergoing profound changes. Technologies continue to advance and the costs of wind power are falling.<br />
Our industry has delivered on its commitments. <strong>Wind</strong> energy is no longer an expensive <strong>Europe</strong>an niche technology;<br />
it is a mainstream and affordable source of electricity generation in many parts of the world. Nevertheless, <strong>Europe</strong> is<br />
not giving the leadership on clean energy it once did. Overall levels of ambition have fallen, certainly compared to other<br />
parts of the world. The outlook for wind investments in <strong>Europe</strong> is less stable than it was, while wind markets outside of<br />
<strong>Europe</strong> are growing significantly.<br />
With the policies currently in place, we are not getting to where we should be and, as things stand, <strong>Europe</strong> will not be<br />
number one in renewables.<br />
For <strong>Europe</strong> to reap the benefits of its first mover advantage in wind energy and to contribute its fair share to climate<br />
change mitigation, it needs three things: adequate policies, innovative technology and an integrated energy system. It is<br />
needed to ensure that citizens, businesses and governments maximise the benefits that wind energy provides to society.<br />
“<strong>Making</strong> Transition Work” describes the new reality we are facing today. It offers a guide to industry and policy makers<br />
on how to make the energy <strong>transition</strong> <strong>work</strong>. For the wind energy sector, for the wider economy and society. It shows how<br />
<strong>Europe</strong> can deliver decarbonisation and make the most of our global competitive advantage.<br />
Giles Dickson<br />
<strong>Wind</strong><strong>Europe</strong> CEO<br />
2 <strong>Making</strong> <strong>transition</strong> <strong>work</strong><br />
<strong>Wind</strong><strong>Europe</strong>
Foreword<br />
EVENT AMBASSADORS FOREWORD<br />
As leading companies in the wind energy industry we are delighted to present “<strong>Making</strong> Transition Work”, a report from<br />
<strong>Wind</strong><strong>Europe</strong>. This report contains the key actions that the industry believes are essential if the <strong>Europe</strong>an wind energy<br />
market and industry are to deliver their true potential.<br />
Energy is in <strong>transition</strong>. And the <strong>transition</strong> will accelerate significantly in the next decade thanks to a worldwide<br />
commitment to mitigate climate change. This represents both opportunities and challenges for <strong>Europe</strong> and the wind<br />
energy industry.<br />
As wind energy becomes an essential element of the <strong>Europe</strong>an power system, it is vital that industry and policy makers<br />
act together today in order to seize these opportunities and overcome the challenges in front of us.<br />
“<strong>Making</strong> Transition Work” through the actions laid out in the following pages secures continued growth, investments,<br />
jobs and clean and affordable energy for the generations to come.<br />
Francesco Venturini,<br />
Chief Executive Officer,<br />
ENEL Green Power<br />
Hans-Dieter Kettwig,<br />
Managing Director,<br />
ENERCON<br />
Lars Bondo Krogsgaard,<br />
Chief Executive Officer,<br />
Nordex SE<br />
Martin Neubert,<br />
Chief Strategy Officer,<br />
DONG Energy<br />
<strong>Making</strong> <strong>transition</strong> <strong>work</strong><br />
<strong>Wind</strong><strong>Europe</strong><br />
3
<strong>Wind</strong><strong>Europe</strong> has joined a climate neutral printing program.<br />
It makes choices as to what it prints and how, based on<br />
environmental criteria. The CO 2<br />
emissions of the printing<br />
process are then calculated and compensated by green<br />
emission allowances purchased from a sustainable project.<br />
MAIN AUTHORS:<br />
<strong>Wind</strong><strong>Europe</strong> Business Intelligence<br />
Daniel Fraile Montoro, <strong>Wind</strong><strong>Europe</strong><br />
Giorgio Corbetta, <strong>Wind</strong><strong>Europe</strong><br />
EDITOR:<br />
Iván Pineda, <strong>Wind</strong><strong>Europe</strong><br />
DIRECTION:<br />
Kristian Ruby, <strong>Wind</strong><strong>Europe</strong><br />
DESIGN:<br />
Clara Ros, <strong>Wind</strong><strong>Europe</strong><br />
COVER PHOTO:<br />
<strong>Wind</strong><strong>Europe</strong><br />
FOREWORD PHOTO:<br />
<strong>Wind</strong><strong>Europe</strong><br />
MORE INFORMATION:<br />
policy@windeurope.org<br />
+32 2 213 18 68
CONTENTS<br />
EXECUTIVE SUMMARY ..................................................................................................... 6<br />
1 WIND ENERGY TODAY: KEY FACTS AND FIGURES ............................................ 9<br />
2 ENERGY SECTOR MEGATRENDS ................................................................................ 11<br />
2.1 Transition from fossil fuels to renewables ......................................................... 11<br />
2.2 <strong>Wind</strong> energy markets changing within <strong>Europe</strong> ............................................... 16<br />
2.3 Global wind energy markets <strong>transition</strong> at a faster pace ............................ 19<br />
2.4 Falling costs of renewables.................................................................................. 20<br />
3 MAKING TRANSITION WORK: POLICY .................................................................. 21<br />
3.1 Post 2020 renewable energy frame<strong>work</strong> ......................................................... 22<br />
3.2 Designing the new energy market ........................................................................ 24<br />
3.3 Planning and permitting ........................................................................................... 27<br />
3.4 Regional cooperation ................................................................................................. 28<br />
4 MAKING TRANSITION WORK: INNOVATIVE TECHNOLOGY ......................... 30<br />
4.1 Integrated system solutions .................................................................................... 32<br />
4.2 Operational management of wind farms .......................................................... 32<br />
4.3 Offshore wind cost reduction ................................................................................. 33<br />
4.4 Manufacturing innovation ........................................................................................ 34<br />
5 MAKING TRANSITION WORK: AN INTEGRATED ENERGY SYSTEM .......... 35<br />
6 RECOMMENDATIONS ................................................................................................... 40
EXECUTIVE<br />
SUMMARY<br />
Energy markets are in <strong>transition</strong> structurally, geographically and in terms of regulation. These changes represent<br />
both challenges and opportunities for wind energy. <strong>Making</strong> the energy <strong>transition</strong> <strong>work</strong> to the benefit of citizens,<br />
businesses and governments requires actions today from policy makers and industry.<br />
The direction is clear: 80% - 95% decarbonisation of the <strong>Europe</strong>an economy by 2050. However, with a modest 27%<br />
renewable energy target in final energy demand by 2030, the EU is postponing decisive actions to the post-2030 period.<br />
This report provides clear elements on how to make <strong>transition</strong> <strong>work</strong> in the coming decade. It provides recommendations<br />
to policymakers on how to facilitate a swift transformation of the energy system and considers the policies that will make<br />
<strong>Europe</strong> the best choice for those investing in renewables.<br />
The report outlines four megatrends defining<br />
the evolution of the <strong>Europe</strong>an power system<br />
and wind energy markets:<br />
1. Transition from fossil fuels to renewables.<br />
Renewable energy accounted for 77% of all new<br />
EU power installations in 2015, while conventional<br />
power sources such as fuel oil and coal continue to<br />
decommission more capacity than they install. 29%<br />
of all electricity generated in <strong>Europe</strong> in 2015 came<br />
from renewables, up from 15% in 2005.<br />
2. Abrupt and in some cases retroactive<br />
regulatory changes alter energy markets<br />
in <strong>Europe</strong> to the detriment of the wind energy<br />
industry. Until 2013, wind turbines were being<br />
installed in almost all countries of the <strong>Europe</strong>an<br />
Union. Since then, new installations have declined<br />
in well-established wind energy markets such as<br />
Italy, Portugal and Spain. The EU frame<strong>work</strong> has<br />
struggled to address these policy changes at national<br />
level. Particularly, a disordered <strong>transition</strong> of support<br />
mechanisms in some countries halted investments<br />
in wind energy as the EU adopted a very prescriptive<br />
approach from feed-in-tariffs to tenders.<br />
3. Emerging and developed economies outside<br />
<strong>Europe</strong> are seizing the economic and social benefits<br />
of wind power and have started deploying it at<br />
industrial scale. More than 70 countries highlighted<br />
wind power in their commitments prior to the Paris<br />
Climate Conference in 2015. An unstable regulatory<br />
frame<strong>work</strong> in <strong>Europe</strong> and stronger political<br />
commitments for renewables outside of <strong>Europe</strong> are<br />
moving wind energy investments away from the old<br />
continent.<br />
4. Falling costs of renewables have made them<br />
one of the most competitive options for new power<br />
generation. Onshore wind and solar PV are today<br />
one the most affordable sources for electricity in<br />
many parts of the world and costs reductions are<br />
expected to continue. Onshore wind costs could fall<br />
26% by 2025. Offshore wind energy could reach €80/<br />
MWh by 2025 in <strong>Europe</strong> and further cost reductions<br />
could be possible with the right pipeline of projects.<br />
6 <strong>Making</strong> <strong>transition</strong> <strong>work</strong><br />
<strong>Wind</strong><strong>Europe</strong>
Executive summary<br />
What does <strong>Europe</strong> need to continue leading in<br />
the global wind energy race?<br />
1. To start with, a common energy strategy reflected<br />
in clear and ambitious political commitments<br />
is paramount to provide the right investment<br />
conditions. The EU should raise its ambition<br />
to at least 30% of renewables in gross final<br />
energy consumption by 2030.<br />
2. The revised Renewable Energy Directive<br />
will be the main policy instrument to support what<br />
<strong>Europe</strong> does on renewables. The Directive should<br />
increase investor confidence by guaranteeing policy<br />
continuity at national level. National legislation<br />
supporting planning and permitting of wind energy<br />
projects should continue beyond 2020. And there<br />
is ample room for improvement when it comes to<br />
cutting red tape to obtain licenses to build, connect<br />
and operate wind power plants.<br />
3. Legislation on energy market design is also<br />
critical for the successful deployment of wind power<br />
and other renewable energy sources. As renewables’<br />
penetration increases in EU power systems, the<br />
instruments which support them need to become<br />
more market-based, increase competition and<br />
reflect short-market signals. At the same time, the<br />
energy market has to provide a level playing field for<br />
market players.<br />
5. Finally, going beyond the current demand of the<br />
power sector can help revive the EU market for wind<br />
energy. Electrification of other energy sectors<br />
– namely heating, cooling and transport – would<br />
add new sources of demand for clean electricity.<br />
Estimates at the high end indicate that up to 8%<br />
of additional power demand to 2040 could be<br />
possible worldwide. If investments in wind and other<br />
renewables are to continue at a high pace in <strong>Europe</strong>,<br />
electrification should be considered as a priority.<br />
Electrification of heating, cooling and transport is<br />
the most effective pathway to reduce emissions in<br />
these sectors, in line with the EU’s long-term climate<br />
goals.<br />
6. However, several regulatory barriers are holding back<br />
the rapid electrification of households, industries<br />
and transport. Policymakers should lift those barriers<br />
and have a more ambitious and intelligent approach<br />
to electrification.<br />
<strong>Wind</strong> energy is on a journey to make <strong>Europe</strong> a global<br />
leader in clean technologies. With ambitious and<br />
fit for purpose policies from <strong>Europe</strong>an and national<br />
institutions, wind energy can help in setting a new global<br />
standard and drive a successful energy <strong>transition</strong>.<br />
4. As wind energy becomes an essential element of the<br />
EU energy system, making <strong>transition</strong> <strong>work</strong> requires<br />
innovative technology too. The wind energy industry<br />
has made great strides in research and innovation<br />
historically, but now there are two clear objectives<br />
to speed up the pace of innovation. The first is to<br />
continue the pathway of cost reduction. The second<br />
is to improve the management of very high shares of<br />
wind into the power system.<br />
<strong>Making</strong> <strong>transition</strong> <strong>work</strong><br />
<strong>Wind</strong><strong>Europe</strong><br />
7
Photo: Acciona
1.<br />
WIND ENERGY IN<br />
EUROPE TODAY:<br />
KEY FACTS AND<br />
FIGURES<br />
1. In 2000, wind energy was a niche sector<br />
representing only 2% of all power generation<br />
capacity installed in <strong>Europe</strong>;<br />
2. By the end of 2015, wind energy had a 15% share of<br />
the EU’s installed power generation capacity. At the<br />
end of June 2016, there is at least 146 GW of wind<br />
energy capacity installed in the EU;<br />
3. <strong>Wind</strong> has added more capacity than any other<br />
technology over the last 11 years;<br />
4. The <strong>Europe</strong>an wind energy industry employs<br />
330,000 skilled <strong>work</strong>ers;<br />
5. By the end of June 2016, wind energy can cover<br />
12% of EU power demand - the equivalent of 87<br />
million <strong>Europe</strong>an households consumption;<br />
6. The wind turbines deployed in <strong>Europe</strong> are made in<br />
<strong>Europe</strong>;<br />
7. <strong>Europe</strong> still leads the world in wind technology.<br />
<strong>Wind</strong> is a major export industry for <strong>Europe</strong>. Three<br />
out of the top five global turbine manufacturers are<br />
<strong>Europe</strong>an;<br />
8. Onshore wind is now the cheapest form of new<br />
power generation capacity in <strong>Europe</strong> (LCoE).<br />
Offshore wind costs are falling rapidly: the industry<br />
has committed to get to € 80/ MWh for projects<br />
reaching Final Investment Decision (FID) in 2025;<br />
9. <strong>Europe</strong>an wind energy markets are slowing down,<br />
in comparison with the rest of the world. Regulatory<br />
factors, by design or slow adaptation to market<br />
dynamics, are the main problem. The <strong>transition</strong> is at<br />
risk if no correction occurs;<br />
10. Policies supporting its deployment are receding and<br />
in some cases changed abruptly or retroactively.<br />
Fewer countries in <strong>Europe</strong> are investing significantly<br />
in onshore wind than 5 years ago. Investments in<br />
offshore wind continue to grow, but the outlook is<br />
uncertain in many countries beyond 2020.<br />
<strong>Making</strong> <strong>transition</strong> <strong>work</strong><br />
<strong>Wind</strong><strong>Europe</strong><br />
9
Photo: ENEL Green Power
2.<br />
ENERGY SECTOR<br />
MEGATRENDS<br />
The global energy sector is in the biggest transformation<br />
it has seen since the discovery of hydrocarbons. This<br />
<strong>transition</strong> will accelerate in the next decade as a result of<br />
the worldwide commitment to mitigate climate change<br />
after the Paris Agreement.<br />
There are four trends in this evolution of the <strong>Europe</strong>an<br />
power system and wind energy is at the heart of all four<br />
of them:<br />
1. Transition from fossil fuels to renewables;<br />
2. <strong>Wind</strong> energy markets changing within <strong>Europe</strong>;<br />
3. Global wind energy markets <strong>transition</strong> at a faster<br />
pace;<br />
4. Falling costs of renewables.<br />
FIGURE 1<br />
GHG emissions and GDP in the EU<br />
5,000<br />
2.1 TRANSITION FROM<br />
FOSSIL FUELS TO<br />
RENEWABLES<br />
The energy <strong>transition</strong> is in motion in the EU. Today <strong>Europe</strong><br />
demonstrates that decoupling Green House Gas Emissions<br />
(GHG) and economic development is possible. Its Gross<br />
Domestic Product (GDP) grew 45% since 2007 whereas<br />
GHG emissions decreased by 14%. Even after the global<br />
economic slowdown in 2009, the EU’s growth continued<br />
while emissions flattened 1 .<br />
This result would not have been possible without<br />
initiating the decarbonisation of the power sector,<br />
which alone is responsible for over one third of all CO 2<br />
emissions in the <strong>Europe</strong>an Union 2 . Whilst the economic<br />
recession contributed to substantial emissions reduction<br />
25<br />
GHG Emissions<br />
(Mt CO2 equivalent)<br />
4,800<br />
4,600<br />
4,400<br />
4,200<br />
4,000<br />
20<br />
15<br />
10<br />
5<br />
GDP (€bn)<br />
3,800<br />
2007 2008 2009 2010 2011 2012 2013<br />
-<br />
GHG Emissions<br />
GDP<br />
Source: Eurostat<br />
1. “Decoupling of global emissions and economic growth confirmed”, 16 March 2016, available at https://www.iea.org/newsroomandevents/pressreleases/2016/march/decoupling-of-global-emissions-and-economic-growth-confirmed.html<br />
2. CO 2<br />
emissions by the power sector amounted to 1,216 Mt in 2013, over a total of 3,291 Mt. World Energy Outlook 2015, International<br />
Energy Agency, p. 606<br />
<strong>Making</strong> <strong>transition</strong> <strong>work</strong><br />
<strong>Wind</strong><strong>Europe</strong><br />
11
Energy sector megatrends<br />
in the period 2008-2014, the lower carbon intensity of<br />
electricity generation was a key factor underpinning lower<br />
emissions 3 .<br />
Renewable energy played the most important role in<br />
decarbonisation. The substitution of emissions-free<br />
electricity for high carbon intensive power generation<br />
has abated an estimated average of 350 MtCO 2<br />
per year<br />
between 2005 and 2014, more than the annual CO 2<br />
emissions from Spain 4 .<br />
Over the last decade, more renewables have been<br />
installed in <strong>Europe</strong> than conventional generation. A total<br />
of 224 GW of renewables has been added, of which wind<br />
energy has been the largest single technology, with 110<br />
GW of new installations.<br />
224 GW OF RENEWABLES<br />
WERE ADDED IN THE LAST DECADE<br />
This would have not been possible without the landmark<br />
decision of EU governments in 2007 to set a 20% reduction<br />
target of GHG emissions, a 20% renewables in final energy<br />
demand and a 20% of energy demand reduction by the<br />
year 2020 5 . These 2020 targets were the first-of-a-kind<br />
globally and led the way for many other governments<br />
around the world to set similar targets.<br />
This clear ambition yielded around €530 bn investment in<br />
renewable energy 6 in <strong>Europe</strong> between 2007 and 2015 and<br />
generated 1.2 million new jobs in a high skilled areas such<br />
as engineering, science and business 7 .<br />
110 GW OF WIND<br />
At the other end, every year an average of 10 GW of<br />
fossil fuel plants are decommissioned, amounting to 160<br />
GW between 2000 and 2015. In the decade post-2020, a<br />
further 65 GW will be decommissioned.<br />
Whilst policy set in motion the departure from fossil fuels<br />
for power generation, renewables’ success is an outcome<br />
of other factors too.<br />
FIGURE 2<br />
Historical conventional decommissioned capacity and expected net conventional capacity changes<br />
Conventional capacity<br />
decommissioned<br />
Net conventional capacity<br />
changes<br />
0<br />
2000-<br />
2005<br />
2006-<br />
2010<br />
2011-<br />
2015<br />
2016-<br />
2020<br />
2021-<br />
2025<br />
2026-<br />
2030<br />
10-<br />
-20<br />
-30<br />
GW<br />
-40<br />
-50<br />
-60<br />
-70<br />
-80<br />
-90<br />
-100<br />
Coal Fuel Oil Gas Nuclear<br />
Source: <strong>Wind</strong><strong>Europe</strong> on Pöyry data<br />
3. EEA, 2016, Key trends and drivers in EU GHG emissions. http://www.eea.europa.eu/publications/analysis-of-key-trends-ghg<br />
4. CO 2<br />
emissions from Spain in 2011, latest data available, were 318.64 Mt. http://www.ucsusa.org/global_warming/science_and_impacts/science/each-countrys-share-of-co2.html#.V7Vljvl97RY<br />
5. EU 2020 strategy, available at https://ec.europa.eu/energy/en/topics/energy-strategy/2020-energy-strategy<br />
6. FS-UNEP Collaborating Centre for Climate and Sustainable Energy Finance, Global trends in renewable energy instestments, 2016,<br />
BNEF data, available at http://fs-unep-centre.org/sites/default/files/publications/globaltrendsinrenewableenergyinvestment2016lowres_0.pdf<br />
7. IRENA, Renewable energy and jobs. Annual review 2015, 2016. Available at http://www.irena.org/DocumentDownloads/Publications/<br />
IRENA_RE_Jobs_Annual_Review_2015.pdf<br />
12 <strong>Making</strong> <strong>transition</strong> <strong>work</strong><br />
<strong>Wind</strong><strong>Europe</strong>
Energy sector megatrends<br />
The continuous cost reduction in some of these<br />
technologies has made a stand-alone business case for<br />
investors. Solar PV panels have decreased costs by 75%<br />
since 2010 and onshore wind energy is today the cheapest<br />
source of power generation in many parts of <strong>Europe</strong> 8 .<br />
Even in times of low oil prices, the cost competitiveness<br />
of renewables is seen as a hedge against volatile fuel<br />
commodities. For this reason alone, the largest global<br />
companies have started to invest in renewables to power<br />
their operations. Onshore wind represents 90% of the<br />
1.2 GW Power Purchase Agreements (PPAs) signed up to<br />
date in <strong>Europe</strong>. Every month, more companies commit to<br />
switch to renewables globally than ever before 9 .<br />
Pension funds and insurance companies 10 are increasingly<br />
investing in large-scale renewables. Renewable energy<br />
provides a solution for long-term stable returns. Danish<br />
pension funds have led the way in both onshore and<br />
offshore wind investments. Other pension funds in the<br />
Netherlands, France and Canada have followed the Danish<br />
example. The financial services industry now owns 16% of<br />
all installed offshore wind energy assets.<br />
The <strong>Europe</strong>an Commission estimates that renewables<br />
would have to account for 50% of power generation by<br />
2030.<br />
29% OF ALL POWER<br />
GENERATED IN THE EU IS FROM<br />
RENEWABLES<br />
Renewable energy will have to be around half of all power<br />
generated by 2030 and up to 60% by 2040 in the EU if global<br />
temperatures are to be limited below 2-Celsius degrees,<br />
according to the International Energy Agency (IEA) 15 .<br />
<strong>Wind</strong><strong>Europe</strong> expects that wind energy will continue to<br />
represent the lion’s share of new deployment amongst<br />
all renewables, and come to 24-28% of the EU total<br />
generation in 2030 16 . At the high end of this range, wind<br />
energy would be the largest single source of power<br />
generation in the EU.<br />
At the same time, investment banks such as JP Morgan<br />
are divesting from fossil fuels 11 . The Norwegian Sovereign<br />
Wealth Fund, the world’s biggest, did the same 12 and the<br />
<strong>Europe</strong>an Investment Bank (EIB) pledged to stop investing<br />
in coal-fired power plants since 2013 13 .<br />
Governments have had compelling reasons to move away<br />
from fossil fuels. Concerns over security of supply and<br />
fuel import bills have been top of the agenda in many<br />
countries, as well as the pressing challenge to improve<br />
local air quality and alleviate water scarcity issues affecting<br />
many parts of the population.<br />
Power generation from renewables in the EU grew from<br />
15% in 2005 to 29% percent in 2015 14 . However impressive<br />
this looks, the share needs to increase at a higher pace if<br />
the EU is to deliver on its political commitments.<br />
FIGURE 3<br />
Power generation in the EU<br />
% of EU power generation<br />
90<br />
70<br />
50<br />
30<br />
10<br />
1990 2013 2020 2030 2040<br />
Conventional<br />
Renewables<br />
Expected contribution from the<br />
EU 2030 RES target<br />
Source: International Energy Agency<br />
8. Bloomberg New Energy Finance (BNEF), 2015<br />
9. RE100, 2016. Annual report. http://media.virbcdn.com/files/f9/d6e716c56a9b3312-RE100AnnualReport2016_v17.pdf<br />
10. Pension funds include the Dutch PGGM and AMF, the French Caisse de dépôt et Consigniation (CDC) and the Canadian Caisse de<br />
dépôt et placement du Québec (CDPQ). Among insurance companies, Allianz is the biggest financial investor in onshore wind, owning<br />
over 1GW.<br />
11. http://www.ecowatch.com/jpmorgan-becomes-latest-big-bank-to-ditch-coal-1882188039.html<br />
12. The Guardian, 15 April, 2015. https://www.theguardian.com/environment/2016/apr/15/worlds-biggest-wealth-fund-excludes-52-coalrelated-groups<br />
13. http://europa.eu/rapid/press-release_BEI-13-115_en.htm<br />
14. ENTSO-E data portal<br />
15. The International Energy Agency 450 Scenario depicts the evolution of the energy and transport systems to cap GHG emissions reduction<br />
below 2 degrees Celsius to 2040. It entails key assumptions for global carbon pricing, international climate agreements compliance<br />
and specific national climate policies (World Energy Outlook 2015 p. 606-607).<br />
16. <strong>Wind</strong><strong>Europe</strong> analysis on Pöyry data, 2015<br />
<strong>Making</strong> <strong>transition</strong> <strong>work</strong><br />
<strong>Wind</strong><strong>Europe</strong><br />
13
ROLE OF WIND ENERGY IN 2015<br />
WIND ENERGY COVERED<br />
11% OF EU ELECTRICITY<br />
DEMAND IN 2015<br />
1<br />
6<br />
0.3<br />
0.1<br />
5<br />
0.4<br />
2<br />
14<br />
3<br />
5<br />
2<br />
0.1<br />
0.3<br />
0.003<br />
45<br />
2<br />
0.3<br />
10<br />
0.003<br />
0.4<br />
3<br />
1<br />
5<br />
9<br />
2<br />
23<br />
FIGURE 4a<br />
14 <strong>Making</strong> <strong>transition</strong> <strong>work</strong><br />
<strong>Wind</strong> energy cumulative capacity installed and share of<br />
<strong>Wind</strong><strong>Europe</strong><br />
electricity demand covered by wind energy in 2015<br />
Source: <strong>Wind</strong><strong>Europe</strong> analysis on Pöyry data.<br />
Capacity values are rounded.<br />
0<br />
0.2
Figures and analysis<br />
ROLE OF WIND ENERGY IN 2030<br />
<strong>Wind</strong> energy penetration<br />
(% of demand, TWh)<br />
81 - 100%<br />
61 - 80%<br />
51 - 60%<br />
41 - 50%<br />
31 - 40%<br />
21 - 30%<br />
11 - 20%<br />
0 - 10%<br />
<strong>Wind</strong> power<br />
installed<br />
capacity (GW)<br />
WIND ENERGY COULD COVER<br />
28% OF EU ELECTRICITY<br />
DEMAND IN 2030<br />
9<br />
14<br />
1<br />
0.3<br />
8<br />
1<br />
9<br />
38<br />
13<br />
13<br />
6<br />
0.1 2<br />
0.3<br />
80<br />
35<br />
6<br />
0.05<br />
2<br />
1<br />
5<br />
1<br />
6<br />
14<br />
9<br />
45<br />
FIGURE 4b<br />
<strong>Wind</strong> energy cumulative capacity installed and share of<br />
electricity demand covered by wind energy in 2030<br />
0.1<br />
<strong>Making</strong> <strong>transition</strong> <strong>work</strong><br />
<strong>Wind</strong><strong>Europe</strong><br />
1<br />
15
Energy sector megatrends<br />
2.2 WIND ENERGY MARKETS<br />
CHANGING WITHIN EUROPE<br />
The dawn of the wind energy industry in <strong>Europe</strong> occurred<br />
in three major markets: Denmark, Germany and Spain. In<br />
2000 all new capacity was located in these three pioneer<br />
markets 17 . Other countries started to see wind power<br />
capacity added since 2001, but installations took off visibly<br />
only two years afterwards. A trend of solid growth in these<br />
second wave markets continued for the next 10 years,<br />
seizing market share from pioneers every year onwards.<br />
A third wave of countries took stage around 2005, but<br />
visible growth did not materialise until 2008-2009.<br />
Stimulated by supporting policies adopted in the EU,<br />
growth continued through the immediate following years,<br />
but not as strong and as long as the previous wave. By<br />
2013, only four years after taking off, annual installations<br />
shrunk. Policy changes at national level in Romania, Spain<br />
and Czech Republic unsettled investors who started<br />
looking for markets with more predictable regulatory<br />
policies.<br />
50%<br />
OF NEW WIND POWER INSTALLED IN 2015<br />
WAS ONLY IN ONE<br />
COUNTRY<br />
These abrupt, and in some cases retroactive, changes<br />
showed that some goverments were ill-prepared<br />
or against a fast deployment of wind energy. These<br />
regulatory changes also showed that the EU frame<strong>work</strong><br />
did not count with the tools to intervene and correct the<br />
course of counterproductive national retroactive policies.<br />
Particularly, a disordered <strong>transition</strong> of support<br />
mechanisms in some countries halted investments in wind<br />
energy. The review of the <strong>Europe</strong>an state aid guidelines<br />
altered the criteria for support mechanisms to comply<br />
with EU competition rules. The <strong>Europe</strong>an Commission<br />
adopted a very prescriptive approach moving away from<br />
the rationale of the previous guidelines which allowed<br />
for a broad spectrum of support mechanisms including<br />
feed-in tariffs. While guidelines included exemptions,<br />
de minimis rules and allowed Member States to rely<br />
on green certificate systems, they clearly pointed to<br />
feed-in premiums awarded via tender as the preferred<br />
model, creating a wave of changes in national policies.<br />
Moreover, the guidelines did not include a hard date<br />
for Member States to <strong>transition</strong>. However, any reform<br />
of a national support scheme needs to comply with the<br />
new regulations. Some countries reformed their policies<br />
accordingly, but additional changes to national support<br />
mechanisms are expected in the coming years.<br />
Additional uncertainty was brought by the discussion on<br />
the post-2020 climate and energy policy frame<strong>work</strong>. All<br />
these events created a negative investment environment,<br />
casting doubt on the the success of the EU regulatory<br />
frame<strong>work</strong> for renewables.<br />
Consequently, after a solid and strong industry growth<br />
that lasted 8 years (at a compounded annual growth rate<br />
of 7% from 2005 to 2013), several markets ceased to<br />
expand. In 2014, two countries featured 60% of all new<br />
EU wind energy installations (Germany and the United<br />
Kingdom). This retreat and market concentration reached<br />
its apex in 2015 when almost half of all new capacity was<br />
installed in just one country, Germany.<br />
As from 2013, established wind energy markets such as<br />
Ireland, Italy, Portugal, Romania, Spain and the UK, all<br />
registered a slowdown in annual growth. New installations<br />
stopped in Hungary and Slovakia. Spain, originally a<br />
pioneer market installed a mere 27 MW in 2014 and<br />
zero MW in 2015. Ten countries saw year on year growth<br />
between 2014 and 2015 while 14 markets experienced<br />
negative growth.<br />
17. Please see figure 5 for different market waves.<br />
16 <strong>Making</strong> <strong>transition</strong> <strong>work</strong><br />
<strong>Wind</strong><strong>Europe</strong>
FIGURE 5<br />
<strong>Wind</strong> energy annual installed capacity in the EU (MW)<br />
14,000<br />
12,000<br />
10,000<br />
8,000<br />
6,000<br />
4,000<br />
2,000<br />
0<br />
2000 2001 2002 2003 2004 2005 2006 2007 2008 2009 2010 2011 2012 2013 2014 2015<br />
Pioneers<br />
Second wave<br />
Third wave<br />
Denmark<br />
Spain<br />
Germany<br />
Portugal<br />
Poland<br />
Sweden<br />
Italy<br />
France<br />
UK<br />
Austria, Belgium, Bulgaria,<br />
Croatia, Cyprus, Czech Republic,<br />
Finland, Greece, Ireland, Netherland,<br />
Estonia, Hungary, Latvia, Lithuania,<br />
Luxembourg, Malta, Romania, Slovakia<br />
and Slovenia<br />
Source: <strong>Wind</strong><strong>Europe</strong><br />
<strong>Making</strong> <strong>transition</strong> <strong>work</strong><br />
<strong>Wind</strong><strong>Europe</strong><br />
17
Energy sector megatrends<br />
A HISTORY OF CHANGING<br />
REGULATIONS<br />
Since 2013, a series of regulatory changes to the Romanian renewable energy frame<strong>work</strong> has led to<br />
severe consequences for the wind power sector. The renewable energy quota was revised downward,<br />
leading to an oversupply of green certificates and their consequent devaluation. Moreover, the present<br />
regulation leaves the door open to revisions in the profitability level every six years. Inadequate balancing<br />
responsibilities for wind energy assets were introduced without the necessary market arrangements,<br />
preventing producers from reducing the forecast error. That further increased the costs of operating<br />
renewables.<br />
Between 2013 and 2014, two laws and a plethora of ministerial decrees abruptly changed the remuneration<br />
mechanism for wind power in Spain, affecting all existing assets, particularly the older ones. Moreover,<br />
the present regulation leaves the door open to revision in the profitability level, adding to the uncertainty<br />
for future investments.<br />
In the Czech Republic, a 2011 law allowed the regulator to operate several changes to the 2005 renewable<br />
energy support mechanism and chiefly to cut the support to renewables by half in that same year. Further<br />
changes were implemented including the introduction of a withholding tax on renewable energy power<br />
plants and the cancellation of the investment credit, previously in place for the first five years of the plant<br />
operation.<br />
18 <strong>Making</strong> <strong>transition</strong> <strong>work</strong><br />
<strong>Wind</strong><strong>Europe</strong>
Energy sector megatrends<br />
2.3 GLOBAL WIND ENERGY<br />
MARKETS TRANSITION AT A<br />
FASTER PACE<br />
While the domestic market for wind energy has slowed<br />
down in many <strong>Europe</strong>an countries, a different story is<br />
taking place abroad. Emerging and developed economies<br />
worldwide see in wind energy a way to achieve both<br />
climate change mitigation and an economic boost at an<br />
affordable cost.<br />
In 2015, China overtook EU for the first time in annual wind<br />
energy installations 21 , overtaking the total cumulative<br />
capacity in the EU. Also, the extension of the production<br />
and investment tax breaks (PTC and ITC) in the United<br />
States for the next five years set the stage for a boost<br />
in wind turbine orders and requests for permission for<br />
new capacity. Similarly, auctions across African countries<br />
and Latin America have provided strong incentives for<br />
<strong>Europe</strong>an manufacturers and project developers to look<br />
abroad.<br />
More than 70 countries mentioned wind energy specifically<br />
as a climate change mitigation tool in their commitments<br />
prior to the Paris Agreement 18 . Several of these set out<br />
concrete and specific deployment ambitions, amongst<br />
which there are economic powers such as China (target<br />
of 200 GW of wind power capacity installed by 2020) and<br />
India (60 GW by 2022) and smaller economies such as<br />
Bangladesh (400 MW) and Tunisia (1.7 GW by 2030).<br />
FIGURE 6<br />
2030 global wind energy installations outlook<br />
GW<br />
600<br />
500<br />
400<br />
300<br />
200<br />
100<br />
-<br />
MORE THAN<br />
70 COUNTRIES<br />
HIGHLIGHTED WIND ENERGY IN<br />
THEIR PARIS 2015 COMMITMENTS<br />
North America<br />
China<br />
<strong>Europe</strong><br />
Rest of Asia<br />
and Oceania<br />
India<br />
Latin America<br />
2015 2030<br />
Africa and<br />
Middle East<br />
Source: Global <strong>Wind</strong> Energy Council<br />
Surprisingly, the EU did not make any reference to renewables,<br />
let alone wind energy, in its Paris commitment. This<br />
was in stark contrast with its ambition to be the world’s<br />
number one in renewables. To date, only seven Member<br />
States out of 28 have in place energy and climate policies<br />
for the post-2020 period (Denmark, Finland, Germany,<br />
France, the Netherlands, Sweden and Portugal) 19 .<br />
This lack of visibility on market outlook in <strong>Europe</strong> and<br />
the recent regulatory instability, has taken a toll in<br />
investments. 2015 was a record year for renewables<br />
investment worldwide, but <strong>Europe</strong> performed worse than<br />
other economies 20 .<br />
In the near future, high demand for power in emerging<br />
economies coupled with the Paris commitments point to<br />
significant growth potential outside the EU and show that<br />
wind and other <strong>Europe</strong>an renewable industries will see<br />
tougher international competition in the future as larger<br />
volumes of projects outside <strong>Europe</strong> will accelerate cost<br />
reductions elsewhere.<br />
For <strong>Europe</strong> to keep its first-mover advantage, it needs to<br />
continue leading the way in policy ambition and enabling<br />
business environment. This not only guarantees <strong>Europe</strong>an<br />
leadership in wind energy going forward, but also secures<br />
the economic benefits that the <strong>transition</strong> to large scale<br />
deployment of onshore and offshore wind can offer to the<br />
EU, and to the rest of world.<br />
18. Intended Nationally Determined Contributions (INDC) are plans prepared by each of the countries participating to the Paris<br />
conference outlining the country’s stategy to achieve GHG emissions reduction objectives. All INDCs were expected to be submitted to<br />
the UNFCCC prior to the conference. More information available at http://unfccc.int/focus/indc_portal/items/8766.php<br />
19. <strong>Europe</strong>an Commission, State of the Energy Union Country Factsheets, available at https://ec.europa.eu/transparency/regdoc/<br />
rep/1/2015/EN/1-2015-572-EN-F1-1.PDF<br />
20. REN21, Renewables 2016 Global Status Report http://www.ren21.net/status-of-renewables/global-status-report/<br />
21. GWEC, 2015 <strong>Wind</strong> Global Status Report/The Guardian: https://www.theguardian.com/environment/2016/feb/11/china-overtakes-euto-become-global-wind-power-leader<br />
<strong>Making</strong> <strong>transition</strong> <strong>work</strong><br />
<strong>Wind</strong><strong>Europe</strong><br />
19
Energy sector megatrends<br />
2.4 FALLING COSTS OF<br />
RENEWABLES<br />
Renewable energy technologies have become one of the<br />
most competitive options for new power generation.<br />
Industrial scale deployment, driven by supporting policies<br />
and technological improvements, have made onshore<br />
wind and solar PV the most affordable sources for<br />
electricity generation in many parts of the world. Costs<br />
from offshore wind are coming down rapidly too, despite<br />
the industry taking off only 10 years ago, making it very<br />
attractive in some markets.<br />
In wind energy, cost reductions will be further driven<br />
down by increasing economies of scale, more competitive<br />
supply chains and a variety of technology improvements.<br />
The latter will lead to higher capacity factors and reduced<br />
installed cost in both onshore and offshore wind. These<br />
developments today are allowing wind energy to be<br />
highly competitive in medium and low-wind speed sites,<br />
expanding opportunities in new markets. As global and<br />
regional markets grow, economies of scale will lead to<br />
significant manufacturing cost reductions too. With<br />
increased market scale, opportunities to improve the<br />
efficiency of supply chains are expected to arise.<br />
Onshore wind costs could fall 26% by 2025 22 . This trend<br />
is set to continue with estimates of 41% cost reduction<br />
by 2040 23 . Offshore wind energy could reach €80/MWh<br />
by 2025 in <strong>Europe</strong> and further cost reductions could be<br />
possible with the right pipeline of projects in the decade<br />
between 2020 and 2030.<br />
ONSHORE WIND IS THE CHEAPEST<br />
FORM OF NEW POWER GENERATION IN<br />
MANY PARTS OF THE OF THE WORLD<br />
FURTHER COST REDUCTION<br />
BY 2025<br />
26%<br />
To continue developing the technology that will be an<br />
essential element of the global power system, a vibrant<br />
home market in the EU is needed.<br />
Actions in three areas are necessary to make this<br />
<strong>transition</strong> <strong>work</strong> and to move the <strong>Europe</strong>an market in the<br />
right direction: 1) policy, 2) innovative technology and 3)<br />
an integrated energy sector.<br />
FIGURE 7<br />
Levelised cost of electricity of onshore wind, 1995-2025<br />
0.25<br />
2015 USD/kWh<br />
0.50<br />
0.15<br />
0.10<br />
0.05<br />
0<br />
1995 2000 2005 2010 2015 2020 2025<br />
Historical global weighted average LCoE<br />
Expected global LCoE (upper range)<br />
Expected global LCoE (lower range)<br />
22. The Power To Change: Solar And <strong>Wind</strong> Cost Reduction Potential to 2025, IRENA 2016<br />
23. New energy outlook, Bloomberg New Energy Finance, 2016<br />
Source: IRENA Renewable Cost Database and analysis.<br />
20 <strong>Making</strong> <strong>transition</strong> <strong>work</strong><br />
<strong>Wind</strong><strong>Europe</strong>
3.<br />
MAKING<br />
TRANSITION<br />
WORK: POLICY<br />
<strong>Europe</strong>’s leadership in wind energy is the result of a clearly<br />
defined regulatory frame<strong>work</strong>, which was introduced in<br />
the early 2000’s with an EU Directive on renewables, and<br />
culminated with the current legislative frame<strong>work</strong>, setting<br />
binding national targets for renewables through 2020<br />
and concrete planning and reporting obligations. This<br />
was decisive in fostering national policies and attracting<br />
private investment. Enabling measures such as priority<br />
access to the grid, priority dispatch and national support<br />
mechanisms were introduced as the market was not able<br />
to deliver a level playing field. A level playing field is still<br />
not achieved today in all EU markets.<br />
Driven by supportive frame<strong>work</strong>s, the wind energy sector<br />
became a mainstream industry that today can cover<br />
12% of the EU’s electricity demand and provides a costeffective<br />
solution to climate and energy challenges. <strong>Wind</strong><br />
power plants across the continent operate on a scale<br />
similar to traditional thermal power plans, delivering<br />
affordable and reliable electricity to 87 million households<br />
in a normal wind year.<br />
However, as current trends show, the market for wind<br />
energy in <strong>Europe</strong> is slowing down compared to the rest<br />
of the world. Regulatory factors, by design or by slow<br />
adaptation to market dynamics, are at the core of this<br />
trend.<br />
For example, the <strong>Europe</strong>an power sector currently faces<br />
overcapacity of fossil fuel generation. This was the result<br />
of various factors, notably an overestimation of electricity<br />
demand triggering investment decisions in the decade<br />
prior to the economic crisis, a very low CO 2<br />
price and<br />
the decrease in coal prices due to an oversupply in the<br />
Pacific basin and the fall in oil prices. All these elements<br />
contributed to depress wholesale power prices, yet<br />
renewables in general and wind energy in particular<br />
have been wrongly singled out for being responsible of<br />
producing too low prices to generate new investments.<br />
WIND ENERGY CAN NOW COVER<br />
12% OF EU ELECTRICITY DEMAND<br />
Significant reforms have to happen to make the market<br />
fit for larger shares of renewables. The most significant<br />
one is to remove polluting capacity from the market. To<br />
do so, available market signals should be reinforced (i.e.<br />
a higher CO 2<br />
price) and new ones could be considered.<br />
These will lead non-competitive and polluting generators<br />
to leave the market, thereby providing market clearance<br />
of prevailing overcapacity.<br />
<strong>Making</strong> <strong>transition</strong> <strong>work</strong><br />
<strong>Wind</strong><strong>Europe</strong><br />
21
<strong>Making</strong> <strong>transition</strong> <strong>work</strong>: policy<br />
3.1 POST 2020 RENEWABLE<br />
ENERGY FRAMEWORK<br />
A common energy strategy reflected in clear and ambitious<br />
political commitments is paramount to provide the right<br />
investment conditions. To start with, the EU should raise<br />
its ambitions to at least 30% of renewables in final energy<br />
consumption by 2030.<br />
Also, a revised Renewable Energy Directive and<br />
supplementary national regulatory mechanisms will be<br />
needed to ensure a business case for wind energy after<br />
2020. The <strong>Europe</strong>an Commission presented this Directive<br />
as the key policy instrument to deliver the binding EU<br />
renewable energy target for 2030.<br />
To this end, the Directive will have to lay out a process<br />
by which each Member State contributes its fair share<br />
of renewable energy towards the binding EU target. It<br />
will also have to define measures in case Member States<br />
fail to collectively deliver on this objective. Planning<br />
and reporting obligations by Member States as well as<br />
<strong>Europe</strong>an Commission oversight should be designed to<br />
ensure the cost effective delivery of the target.<br />
Enabling measures for the deployment of renewables<br />
should be a centerpiece of this legislation, notably the<br />
streamlining of administrative procedures – including for<br />
repowering.<br />
The Directive should also clarify the role and design of<br />
renewable energy support mechanisms in the post-2020<br />
period. The design of support schemes is currently dealt<br />
with under the State Aid Guidelines. This leads to more<br />
regulatory uncertainty for investors than if they were<br />
addressed in a Directive with a longer-term horizon.<br />
As a guiding principle, the Directive should address the<br />
issue of investor certainty and ensuring policy continuity<br />
at national level by limiting disruptive regulatory changes.<br />
Finally, the text should be coherent with legislative<br />
proposals on market design. Instead of questioning<br />
measures such as priority access and priority dispatch,<br />
governments should guarantee fair market conditions<br />
that do not undermine the cost-effective deployment of<br />
renewables.<br />
SPAIN’S POWER GENERATION OVERCAPACITY<br />
Spain is a clear example of a market with overcapacity,<br />
where a high expectation of electricity demand made<br />
the government reinforce existing capacity payments<br />
to incentivise new investments on thermal peaking<br />
plants back in 2007.<br />
The demand increase never materialised and the<br />
poorly designed market intervention resulted in<br />
a system burdened by an overcapacity of thermal<br />
generation.<br />
Most of the peaking gas units today operate at very<br />
low utilisation rates (below 20%) and government<br />
still subsidises coal fired power plants with similarly<br />
low utilisation rates (around 60%).<br />
FIGURE 8<br />
2015 installed capacity and utilisation<br />
30,000<br />
MW<br />
25,000<br />
20,000<br />
15,000<br />
10,000<br />
5,000<br />
0<br />
Combined<br />
cycle<br />
Coal<br />
Nuclear<br />
Installed capacity (MW)<br />
Utilisation (%)<br />
Cogen<br />
Fuel/gas<br />
<strong>Wind</strong><br />
Hydro<br />
Solar PV<br />
Solar CSP<br />
Other hydro<br />
RES thermal<br />
Hydro-wind<br />
100%<br />
90%<br />
80%<br />
70%<br />
60%<br />
50%<br />
40%<br />
30%<br />
20%<br />
10%<br />
0<br />
Source: <strong>Wind</strong><strong>Europe</strong> based on Red Electrica Española<br />
22 <strong>Making</strong> <strong>transition</strong> <strong>work</strong><br />
<strong>Wind</strong><strong>Europe</strong>
<strong>Making</strong> <strong>transition</strong> <strong>work</strong>: policy<br />
MAKING TRANSITION WORK: POLICY<br />
Elements needed in the revised<br />
Renewable Energy Directive<br />
1<br />
Enshrine<br />
in legislation the<br />
governance provisions<br />
relevant to renewables<br />
2<br />
Enable<br />
support<br />
measures to incentivise<br />
wind uptake<br />
• Clear safeguard measures and<br />
enforcement tools for the <strong>Europe</strong>an<br />
Commission to oversee and ensure<br />
target delivery;<br />
• Binding templates for national energy<br />
and climate plans;<br />
• National renewable energy indicative<br />
benchmarks to factor in early ambition<br />
from Member States.<br />
• Reaffirm the role of support mechanisms<br />
in the upcoming Renewables Directive;<br />
• Grandfathering principle for existing<br />
assets;<br />
• Streamline administrative procedures for<br />
repowering;<br />
• EU-level financing facility granting<br />
support to projects of regional relevance,<br />
including infrastructure development (e.g.<br />
grid extension and interconnection).<br />
3<br />
Ensure<br />
a level-playing<br />
field through an<br />
upgraded market design<br />
4<br />
Pursue<br />
a regional<br />
approach for wind<br />
energy deployment<br />
• Priority dispatch for new wind<br />
installations would not be necessary<br />
after:<br />
> > Removal of priority dispatch for<br />
conventional generators and minimise<br />
must-run obligation;<br />
> > Integrated and liquid markets in all<br />
timeframes;<br />
> > Access to balancing and ancillary<br />
services markets market;<br />
> > Transparency on curtailment rules<br />
and enforcements at TSO and DSO<br />
level;<br />
> > Sufficient grid infrastructure.<br />
• Clear political commitment for<br />
convergence of national frame<strong>work</strong>s<br />
in view of bringing down deployment<br />
costs;<br />
• Swift implementation of the North Seas<br />
political declaration <strong>work</strong> programme.<br />
<strong>Making</strong> <strong>transition</strong> <strong>work</strong><br />
<strong>Wind</strong><strong>Europe</strong><br />
23
<strong>Making</strong> <strong>transition</strong> <strong>work</strong>: policy<br />
3.2 DESIGNING THE NEW<br />
ENERGY MARKET<br />
As the penetration of renewables increases, instruments<br />
to support their deployment need to become more<br />
market based, increasing competition and reflecting shortterm<br />
market signals, while ensuring long-term stability<br />
of future revenues. In parallel, the energy market has<br />
to better suit for the instrinsic characteristics of variable<br />
energy sources, allowing a level playing field among all<br />
participants.<br />
FIGURE 9<br />
Renewables and the market<br />
Market fit for RES<br />
RES POLICY fit for market<br />
1. Faster<br />
markets<br />
(shorter lead<br />
times)<br />
2. Larger<br />
markets<br />
(cross-border<br />
participating)<br />
1. Market<br />
based<br />
(feed-inpremium)<br />
2. Tender<br />
based<br />
3. Smaller<br />
products<br />
4. Efficient<br />
pricing<br />
3. Based<br />
on energy<br />
production<br />
4. Technology<br />
specific<br />
5. Level playing field for all market players<br />
Source: <strong>Wind</strong><strong>Europe</strong>, Market4RES EU funded project, 2016<br />
3.2.1 MARKET FIT FOR RENEWABLES<br />
2. Larger markets<br />
1. Faster markets<br />
In a future power system dominated by wind and other<br />
variable renewables, the timing of markets should allow<br />
for changes in system conditions such as updated power<br />
demand, weather patterns variations and changes in<br />
generation. Concretely, this means that TSOs should<br />
operate the system as close as possible to real time<br />
(gate closure time) while ensuring system security and<br />
stability assessments. This would give variable generators<br />
the option to correct their deviations as their forecast<br />
improves considerably closer to the time of energy<br />
delivery.<br />
<strong>Wind</strong> power output smooths out when it is aggregated<br />
over several sites and across large geographical areas,<br />
many of which may or may not be located within the same<br />
grid, market, or control area. In order to enlarge markets<br />
and connect these areas, system operators would need to<br />
use more sophisticated methods to allocate transmission<br />
capacity.<br />
3. Smaller products<br />
Trading wind energy is easier through small timeframe<br />
products. This is because the predictability of energy<br />
delivery improves at shorter timeframes. Also, because<br />
smaller products allow for the possibility to adjust bids<br />
closer-to-real-time demand.<br />
24 <strong>Making</strong> <strong>transition</strong> <strong>work</strong><br />
<strong>Wind</strong><strong>Europe</strong>
<strong>Making</strong> <strong>transition</strong> <strong>work</strong>: policy<br />
In Germany, the introduction of 15-min products in the<br />
intraday market facilitates significantly the management<br />
of renewable energy variability compared to the<br />
traditional hourly based contracts. And although product<br />
volumes remains relatively low, they will most likely<br />
become automatically higher as the share of renewables<br />
increases.<br />
FIGURE 10<br />
Comparison of potential 15-min schedules vs. hourly<br />
schedules of solar production in Germany on 21 June 2014<br />
MWh<br />
16,000<br />
14,000<br />
12,000<br />
10,000<br />
8,000<br />
6,000<br />
4,000<br />
2,000<br />
0<br />
0<br />
10<br />
4. Efficient pricing<br />
20<br />
30<br />
40<br />
50<br />
60<br />
70<br />
80<br />
Actual solar production<br />
Potential 15-min shedules<br />
Potential hourly shedules<br />
90<br />
Source: ACER 2014 Market Monitoring Report<br />
Prices in the wholesale power market are the main<br />
reference for operational choices and investment decisions<br />
for all generators. Therefore, they must be transparent<br />
and regulators should not keep them artificially from<br />
revealling scarcity. Price volatility and spikes are positive<br />
outcomes of a market that signals when investments are<br />
needed, either in capacity and/or in flexibility.<br />
Prices in the short-term market should also relate solely<br />
to the marginal costs of producing electricity. The entire<br />
rationale of a cost-efficient short-term dispatch of<br />
energy relies on a system in which the most competitive<br />
generators are the first to serve demand. To this end,<br />
marginal pricing (pay as cleared) should be considered<br />
as the common norm across all time frames (day-ahead,<br />
balancing), with the exception of continuous intraday<br />
trading, where pay-as-bid will remain the rule.<br />
3.2.2 RES POLICY FIT FOR THE<br />
MARKET<br />
Despite all the mentioned measures, the market<br />
frame<strong>work</strong> might still not be sufficient to guarantee and<br />
adequate return on investment in a decarbonised power<br />
system in which high upfront investments (CAPEX) and low<br />
marginal costs generators dominate power production.<br />
Supplementary national regulatory mechanisms and new<br />
market instruments thus have to reinforce the business<br />
case for wind energy. Governments should design these<br />
mechanisms to promote competition in the market and to<br />
expose operators to short term market signals, leading to<br />
technology innovation and further cost reductions.<br />
They should be based on four factors: market-based<br />
revenues, adequate allocation mechanisms, premiums for<br />
energy production, and technology-specific meachanisms.<br />
1. Market-based revenues<br />
Long-term price signals that help stabilising revenue<br />
should complement wholesale markets. These can take<br />
various forms, such as a feed-in-premiums and marketbased<br />
long-term contracts (i.e. PPAs). Feed-in-premiums<br />
– both floating and fixed - expose producers to different<br />
levels of market risk and lead to various results in terms of<br />
dispatch decisions.<br />
Revenue stabilisation mechanisms limit market risks and<br />
thus bring financing cost as low as possible. This is very<br />
important because most of the lifetime generation cost<br />
of wind power is associated with the initial investment<br />
(CAPEX).<br />
10% FINANCE COST<br />
INCREASES BY 70%<br />
THE LCOE OF ONSHORE WIND<br />
For example, considering the cost structure of wind,<br />
financing costs of about 10% would increase the Levelized<br />
cost of energy (LCOE) 24 by approximately 70%. Financing<br />
cost over 15% would double the LCOE as compared to 3%<br />
financing rates.<br />
24. Financing costs are expressed as the weighted average cost of capital- WACC<br />
<strong>Making</strong> <strong>transition</strong> <strong>work</strong><br />
<strong>Wind</strong><strong>Europe</strong><br />
25
<strong>Making</strong> <strong>transition</strong> <strong>work</strong>: policy<br />
FIGURE 11<br />
Effect of financing costs on the levelised cost of onshore wind energy<br />
160<br />
140<br />
120<br />
$/MWh<br />
100<br />
80<br />
60<br />
40<br />
20<br />
0<br />
0 3% 7% 10% 15%<br />
Financing cost<br />
Refurbishment & decommissioning costs<br />
O&M costs<br />
Investment cost<br />
Source: <strong>Wind</strong><strong>Europe</strong> based on IEA data, 2015<br />
Assumptions: Germany, onshore wind capacity factor 34%<br />
Market platforms can additionally provide for voluntary<br />
financial products to hedge against price and volume<br />
risks, helping wind operators to be fully active in the<br />
market while keeping financing cost low.<br />
2. Adequate allocation mechanism (tender)<br />
The use of competitive tenders for setting and allocating<br />
the premium among market participant can lead to market<br />
efficiency, but for this to happen governments need to<br />
define them carefully. Tenders present participants with<br />
higher risks, such as costly applications, uncertainty over<br />
project selection and guaranteed remuneration. All these<br />
are generally internalised in the submitted bids and could<br />
temporally result in higher support costs.<br />
This is why it is important that small players are given the<br />
opportunity to participate in the market without applying<br />
to tenders given the transaction costs associated with a<br />
tendering process.<br />
In this sense, there is no tender design system that is a<br />
complete success story because tenders are subject<br />
to continuous adaptation of both design elements and<br />
participants’ behaviour. However, in general, for a tender<br />
to be effective, it has to achieve competitive prices and<br />
high realisation rates.<br />
3. Premiums based on energy production<br />
Revenue stabilisation mechanisms that reward energy<br />
production instead of capacity are a more suitable<br />
solution to reach the various energy policy goals.<br />
Governments should adjust the premium regularly so that<br />
the total price for renewables generation (i.e. electricity<br />
price plus price premium) is in line with a target value<br />
(resulting from a competitive tender, or administratively<br />
set value), reducing investment risk and ensuring revenue<br />
stability in the long term.<br />
4. Technology specific mechanisms<br />
Technology neutral schemes might provide, in the short<br />
term, the least-cost solution for implementing a given<br />
amount of renewables in a well-functioning market.<br />
However, to encourage investments in a wider range<br />
of technologies with high potential (in terms of energy<br />
26 <strong>Making</strong> <strong>transition</strong> <strong>work</strong><br />
<strong>Wind</strong><strong>Europe</strong>
<strong>Making</strong> <strong>transition</strong> <strong>work</strong>: policy<br />
production and cost-reductions through learning-by-doing<br />
effects), technology-specific support has to continue.<br />
In the long-term, a wide portfolio of complementing<br />
technologies will provide the most cost-effective solutions<br />
for system integration and decarbonisation.<br />
3.2.3 LEVEL PLAYING FIELD<br />
Above all, for wind energy to fully contribute to a<br />
functional energy market, the design and rules have to<br />
establish a level playing field for all market players. Market<br />
access, increased transparency of operational procedures,<br />
a polluter pays principle guiding dispatch and a complete<br />
phase-out of environmentally damaging subsidies are<br />
paramount to strengthen the market towards a more<br />
sustainable future.<br />
First, an equal access to balancing markets on a voluntary<br />
basis and across borders should be implemented before<br />
fully exposing wind energy generators to balancing<br />
responsibilities. To date, in 14 Member States wind<br />
energy is already balancing responsible either physically<br />
or financially. However, in many of these countries, the<br />
intraday market is either inexistent or not liquid and wind<br />
energy generators cannot access the balancing market.<br />
Second, increased transparency on operational<br />
procedures leading to curtailment of wind energy and<br />
treatment of these events as system services should<br />
progressively allow to manage wind power production<br />
without priority dispatch provisions introduced in the<br />
2009 Renewable Energy Directive. In order to achieve a<br />
IT TAKES 55 MONTHS<br />
OF ADMINISTRATIVE<br />
PROCEDURES TO INSTALL A WIND<br />
FARM AND 26 MONTHS<br />
TO CONNECT IT TO THE GRID<br />
level playing field, conventional generators should no<br />
longer benefit from priority dispatch.<br />
Third, today’s power market does not adequately factor<br />
in the cost of polluting air, water and soil while generating<br />
electricity. This keeps conventional generation costs<br />
artificially low against competitive renewables. Without a<br />
meaningful price of CO 2<br />
and other pollutants, the merit<br />
order for dispatching energy in the market will continue<br />
favouring the most polluting sources of generation over<br />
the rest. A root and branch reform of the EU ETS should<br />
COAL, GAS AND<br />
NUCLEAR CONTINUE TO<br />
RECEIVE DIRECT OR INDIRECT<br />
SUBSIDIES AT NATIONAL AND<br />
EUROPEAN LEVEL<br />
restore a meaningful price of CO 2<br />
and polluters should<br />
pay for the full costs of generating electricity with their<br />
technology and fuel of their choice.<br />
Last, while significant attention is given to the support<br />
mechanisms for renewable energy, conventional<br />
technologies continue to receive direct or indirect support<br />
at national and <strong>Europe</strong>an level. Historically, technologies<br />
such as nuclear and coal have received direct support<br />
several orders of magnitude higher than the support<br />
provided today to the various renewable energy sources 25 .<br />
Therefore, in order to guarantee a level-playing field, the EU<br />
should reassess the support to conventional technologies<br />
in parallel to the reform of market design rules and the<br />
revision of state aid guidelines for environment and energy.<br />
3.3 PLANNING AND<br />
PERMITTING<br />
Policies facilitating permitting at national level should<br />
continue to 2020 and beyond. There is still room for<br />
improvement in shortening lead-times to obtain licences<br />
to operate and build wind power projects, as well as<br />
permitting procedures for grid connection.<br />
There is no evidence that this situation has improved<br />
significantly since 2010, a year after the adoption of the<br />
Renewable Energy Directive. Today, developers still face<br />
average lead times for administrative authorisation of<br />
almost 55 months and grid connection procedures of<br />
approximately 26 months, on average.<br />
Shortening these periods to 24 and 6 months respectively<br />
should be a priority for governments. On the contrary,<br />
25. Subsidies and costs of EU energy, Ecofys, November 2014<br />
<strong>Making</strong> <strong>transition</strong> <strong>work</strong><br />
<strong>Wind</strong><strong>Europe</strong><br />
27
<strong>Making</strong> <strong>transition</strong> <strong>work</strong>: policy<br />
FIGURE 12<br />
Minimum distance ranges to housing (m)<br />
2,500<br />
2,000<br />
1,500<br />
1,000<br />
500<br />
0<br />
DE PL IE AU DK FR EL ES PT CZ IT RO<br />
Source: <strong>Wind</strong><strong>Europe</strong><br />
some planning requirements have tightened in many<br />
Member States with regards to set back distances, noise<br />
limits or wind turbines interference with civil aviation and<br />
military radars.<br />
The requirement for minimum distances between wind<br />
turbines and housing varies significantly across the<br />
EU. Some countries have a single distance across their<br />
territory. Others instead, derive this value either based<br />
on the wind turbine tip height or the rotor diameter. In<br />
Italy, for instance, the setback distance can be minimum<br />
200m or it can be calculated as “6 times the turbine tip<br />
height”, depending on the region and other conditions. In<br />
Poland, the “10 times tip height rule” applies. Assuming<br />
the height of most modern wind turbines is around<br />
160m, the minimum distance from any residential zone or<br />
protected natural area would be 1.6Km. This represents<br />
a huge spatial planning barrier, significantly limiting site<br />
availability across the country.<br />
Repowering and life extension permitting is another area<br />
that requires improvement. National and EU legislators<br />
should set regulatory frame<strong>work</strong>s allowing to tap the<br />
potential repowering and lifetime extention represent<br />
to modernise the EU wind energy fleet and help the EU<br />
reach its renewable energy objectives.<br />
Member States’ 2030 national plans should provide<br />
legislation for repowering projects that allows them to to<br />
compete on a fair basis with new projects.<br />
3.4 REGIONAL COOPERATION<br />
Regional cooperation will be key to deliver on many policy<br />
fronts especially, but not only, in the <strong>Europe</strong>an seas, where<br />
offshore wind could be competitive within a decade.<br />
Member States cannot <strong>work</strong> in silos to achieve the set<br />
targets. Cooperation between nations to raise overall<br />
ambition and forge the agreements which will bring about<br />
the Energy Union is a prerequisite to success.<br />
<strong>Europe</strong>an countries have already achieved important steps<br />
in the implementation of the <strong>Europe</strong>an single market for<br />
electricity. Member States rely more and more on a set of<br />
common rules to trade electricity and to ensure security of<br />
supply. Day-ahead markets have been successfully coupled<br />
across <strong>Europe</strong>, leading to lower prices and increasing the<br />
value of renewable energy. Transmission System Operators<br />
(TSO) are adopting EU-wide net<strong>work</strong> codes to keep the<br />
lights on. These new rules aim to harmonise operating<br />
procedures, increase cooperation across borders and<br />
facilitate the deployment of renewable energy sources<br />
while maintaining system reliability.<br />
For example, increasing regional cooperation is already<br />
taking place when performing systems adequacy analyses.<br />
The first regional assessments are resulting in a common<br />
strategic vision on the role of capacity remuneration<br />
mechanisms as the last resort measure to guarantee<br />
security of supply 26 .<br />
26. Regional Generation Adequacy Assessment, Pentalateral Energy Forum, June 2015 http://www.benelux.int/files/4914/2554/1545/<br />
Penta_generation_adequacy_assessment_REPORT.pdf<br />
28 <strong>Making</strong> <strong>transition</strong> <strong>work</strong><br />
<strong>Wind</strong><strong>Europe</strong>
<strong>Making</strong> <strong>transition</strong> <strong>work</strong>: policy<br />
Particularly on renewable energy policy, the first steps of<br />
the <strong>transition</strong> are underway with the first cross-border<br />
tenders for renewable energy being rolled out and<br />
offshore wind set to play a significant role.<br />
Under the Dutch Presidency of the EU, nine countries of<br />
the North Seas signed a declaration in June 2016. This<br />
is a significant first step in cooperation through policy.<br />
Initiatives like these should also be promoted to other<br />
regions, like the Baltic Energy Market Interconnection<br />
Plan (BEMIP) is doing for Baltics, and to onshore wind.<br />
The recently released German Renewable Energy Law<br />
foresees that 5% of all onshore wind planned auctioned<br />
volumes shall be open to projects located outside of<br />
Germany. The first cooperation agreement setting the<br />
frame<strong>work</strong> for cross-border auctions was signed in July<br />
between Denmark and Germany and paved the way for<br />
two solar PV pilot auctions rounds to be held in Denmark<br />
and Germany in 2016 27 . This can set an example for other<br />
countries to follow.<br />
Alignment and mutual recognition of standards would<br />
allow a more aligned <strong>Europe</strong>an approach to areas such<br />
as offshore wind turbine design, wind farm layout, vessel<br />
and crew requirements, testing and demonstration, and<br />
potentially decommissioning.<br />
The North Seas declaration furthermore included the<br />
agreements on taking a coordinated planning and<br />
development approach of offshore wind projects. Current<br />
projections only offer visibility until 2020, with a lack<br />
of projects starting in 2020 that would lead to a stall in<br />
sector growth. The ability of regulators to <strong>work</strong> together<br />
on planning would provide for long term visibility and<br />
a smooth deployment pathway both for onshore and<br />
offshore wind that would avoid a boom and bust cycle.<br />
Developing a strong pipeline of projects clearly lowers the<br />
cost of projects. Concurrent to the signing of the North<br />
Seas declaration, the offshore wind industry made a clear<br />
statement 28 about how competitive the sector could be<br />
with the right level of volumes.<br />
With a minimum installation rate of at least 4 GW per year,<br />
costs could drop below €80/MWh for projects reaching<br />
Final Investment Decision (FID) in 2025, including the cost<br />
of grid connection. A visible and stable outlook on projects<br />
allows the industry to continue to make investments in<br />
cost reduction activities while reaping the learning effects.<br />
Without a sustained buildout, such learning and<br />
investments would cease, leading to no additional cost<br />
reduction beyond 2020. If <strong>transition</strong> to a renewables led<br />
sector is to <strong>work</strong>, cooperation on safeguarding market<br />
visibility is the first step.<br />
FIGURE 13<br />
Cost reduction trajectory for offshore wind 2010-2030 showing historical UK LCOEs and tendered prices of projects,<br />
tender price ceiling trajectories, and post-2020 cost pathways under different buildout scenarios<br />
180<br />
160<br />
168<br />
EUR/MWh<br />
140<br />
120<br />
100<br />
149<br />
UK East Anglia One (inc. grid)<br />
DK Horns Rev 3<br />
80<br />
60<br />
NL Borssele I & II<br />
40<br />
Works Completed<br />
2010-2011<br />
Works Completed<br />
2012-2014<br />
FID 2012-2014<br />
FID 2015<br />
FID 2016<br />
FID 2017<br />
FID 2018<br />
FID 2019<br />
FID 2020<br />
TENDERED PRICES<br />
FID 2021<br />
FID 2022<br />
UK Tendered Price Ceilings<br />
(including grid)<br />
FID 2023<br />
FID 2024<br />
FID 2025<br />
FID 2026<br />
FID 2027<br />
FID 2028<br />
FID 2029<br />
FID 2030<br />
COSTS RESULTS FROM BUILDOUT<br />
0.5 GW/year<br />
4 GW/year<br />
7 GW/year<br />
UK LCOE (actual)<br />
Dutch Tender Price Ceilings<br />
(excluding grid)<br />
Source: <strong>Wind</strong><strong>Europe</strong><br />
27. Denmark and Germany sign first cooperation agreement on mutual cross-border pilot auctions for PV installations, German Federal<br />
Ministry for Economic Affairs and Energy, available at http://www.bmwi.de/EN/Press/press-releases,did=774486.html<br />
28. 11 members of the offshore wind sector signed a joint statement – Offshore wind can reduce costs to below €80/MWh by 2025 –<br />
signed 3 June 2016<br />
<strong>Making</strong> <strong>transition</strong> <strong>work</strong><br />
<strong>Wind</strong><strong>Europe</strong><br />
29
4.<br />
MAKING<br />
TRANSITION<br />
WORK:<br />
INNOVATIVE<br />
TECHNOLOGY<br />
<strong>Wind</strong> energy is today a mainstream source of electricity<br />
generation in <strong>Europe</strong>. The wind power produced in several<br />
countries can already cover large shares of electricity<br />
demand for increasing periods of time.<br />
There are several countries with high wind energy<br />
penetration rates such as Denmark (42%), Ireland (24%),<br />
Spain (20%), Germany (13%) and the UK (11%).<br />
Achieving such results was not without challenges, but<br />
the industry overcame these with a firm commitment<br />
to technology development, research and innovation<br />
(R&I). From 2008 to 2012 wind energy featured the<br />
largest number of EU registered patents, demonstrating<br />
its commitment to deliver reliable, smart and durable<br />
machines.<br />
More recently, technology innovation is moving faster<br />
away from the lab to become industrial innovation.<br />
Private R&D expenditures decreased over the last 5 years<br />
from 4.5% to 2.3% (as percentage of revenues) and wind<br />
energy businesses are accelerating products introduction.<br />
The industry launches more products per year than ever<br />
before, at around of 30 new products per year 29 .<br />
There are two clear rationales for the industry to innovate<br />
faster:<br />
• Continue the pace of energy cost reductions in<br />
manufacturing, installations and optimisation of the<br />
supply chain;<br />
• improve the management of very high shares of wind<br />
into the power system.<br />
29. MAKE Consulting, Global wind turbine technology trends 2015<br />
30 <strong>Making</strong> <strong>transition</strong> <strong>work</strong><br />
<strong>Wind</strong><strong>Europe</strong>
<strong>Making</strong> <strong>transition</strong> <strong>work</strong>: innovative technology<br />
FIGURE 14<br />
Number of new patents per technology between 2008 and 2012<br />
<strong>Wind</strong><br />
energy<br />
Photovoltaic<br />
energy<br />
Solar<br />
energy<br />
Energy<br />
storage<br />
Hydrogen<br />
technology<br />
Nuclear<br />
energy<br />
325 100 90 60 40 15<br />
new patents new patents new patents new patents new patents new patents<br />
Source: Eurostat (online data code: pat_ep_nrg)<br />
The introduction of larger wind turbines has been at the<br />
core of cost reduction efforts for the industry for many<br />
years, allowing for higher capacity factors and thus<br />
facilitating market integration. While this trend is set to<br />
continue, improvements in other areas of manufacturing,<br />
logistics, operation and maintenance are making<br />
significant contributions to reduce costs as well.<br />
As wind energy is set to become the key source of electricity<br />
generation of <strong>Europe</strong>’s power system, developing gridfriendly<br />
technology and the systems around it to monitor,<br />
control and operate wind farms is enabling the industry<br />
to support power system management and the market in<br />
which wind energy operates.<br />
Parallel developments in other sectors will also contribute<br />
to the pace and volume of growth in the wind sector.<br />
Energy storage, and in particular battery storage, has<br />
witnessed significant cost reductions in the last few years.<br />
Battery technology in mobile electronic devices and more<br />
FIGURE 15<br />
Historical increase of wind turbine size has lead to higher capacity factors<br />
% of the max. rated capacity achieved over time<br />
60 %<br />
50 %<br />
40 %<br />
30 %<br />
20 %<br />
10 %<br />
1980 1984<br />
1988 1992 1996 2000 2004 2008 2012 2016 2020<br />
Germany Denmark UK Spain US Canada<br />
Source: Bloomberg New Energy Finance, New Energy Outlook 2016<br />
<strong>Making</strong> <strong>transition</strong> <strong>work</strong><br />
<strong>Wind</strong><strong>Europe</strong><br />
31
<strong>Making</strong> <strong>transition</strong> <strong>work</strong>: innovative technology<br />
recently on electrical vehicles has pushed down the cost<br />
of batteries at a double digit rate in the last 10 years 30 .<br />
These technologies can be adapted to energy storage<br />
solution for different uses, from short-term frequency<br />
balancing to long-term seasonal bulk storage, which will<br />
be needed at very large RES penetration shares.<br />
4.1 INTEGRATED SYSTEM<br />
SOLUTIONS<br />
Today leading companies such as ENERCON are providing<br />
integral solutions, from power production to full system<br />
and market integration. <strong>Wind</strong> power plants come today<br />
with complementary grid services for system security and<br />
stability.<br />
WIND POWER PLANTS<br />
CAN TODAY PROVIDE<br />
COMPLEMENTARY GRID<br />
SERVICES<br />
This has been done in East Frisia, Germany, at ENERCON’s<br />
foundry GZO where the operation of the electric smelting<br />
furnaces draws a lot of power from the relatively weak<br />
distribution grid. Instead of engaging in grid expansion,<br />
ENERCON’s STATCOM technology provides the necessary<br />
solution in a more cost effective manner.<br />
<strong>Wind</strong> farms can also contribute to stabilising frequency<br />
through a control system allowing them to access the<br />
reserves and balancing market. This not only increases<br />
the revenue streams for operators, but most importantly,<br />
it enhances wind’s ability to provide services to national<br />
grid operators. In Spain, Acciona offered the first reserve<br />
wind power on a commercial basis this year and other<br />
pilot projects have already demonstrated the technical<br />
viability of wind farms providing frequency reserves in<br />
other countries as well 32 .<br />
In a growing number of projects, these services include<br />
a storage system to serve other energy uses such as the<br />
refuelling of electric vehicles in fast-charging points or<br />
combination with electrolysers for power to gas solutions.<br />
These new technological solutions enable wind<br />
generators to take a more active role in contributing to<br />
grid management, and progressively making the energy<br />
system less dependent on conventional generators,<br />
accelerating the transformation of the energy system.<br />
<strong>Wind</strong> farms today are equipped with an intelligent<br />
grid feed system, combining SCADA technology for full<br />
system control that ensure compliance with the grid<br />
operator’s needs and specifications. In addition to these<br />
functionalities, new controllers optimise the energy yield<br />
in situations with increased fluctuation of voltage or<br />
frequency.<br />
<strong>Wind</strong> farms can now provide highly dynamic reactive<br />
power, needed to ensure voltage stability. In some cases,<br />
adding a STATCOM strengthens weak net<strong>work</strong>s and helps<br />
to avoid cost-intensive net<strong>work</strong> expansion 31 .<br />
4.2 OPERATIONAL<br />
MANAGEMENT OF WIND<br />
FARMS<br />
Photo: ENERCON<br />
Leading wind power operators and owners like ENEL<br />
Green Power are constantly improving operational<br />
management, especially for optimising energy yield. Most<br />
recent forecasting techniques are aimed at improving<br />
wind farms predictability, thus enabling optimized<br />
30. Rapidly falling costs of battery packs for electric vehicles, Björn Nykvist & Måns Nilsson, Nature Climate change Journal, 2015<br />
31. STATCOM technology enables wind energy producers to maintain grid stability at all times.<br />
32. TWENTIES EU-funded project, 2014, http://www.twenties-project.eu/node/1 and “R2 downward wind” pilot project, http://www.<br />
enercon.de/en/news/news-detail/cc_news/show/News/pilot-project-for-delivery-of-balancing-services-by-wind-farms-in-belgium/<br />
32 <strong>Making</strong> <strong>transition</strong> <strong>work</strong><br />
<strong>Wind</strong><strong>Europe</strong>
<strong>Making</strong> <strong>transition</strong> <strong>work</strong>: innovative technology<br />
management of the intrinsically low programmability of<br />
the wind resource, while increasing their compatibility<br />
with the electrical grid.<br />
Innovative software tools are able to provide accurate<br />
power predictions by adopting improved energy yield<br />
forecasting and nowcasting techniques.<br />
In Southern Italy, ENEL Green Power has recently<br />
unveiled a new Battery Energy Storage System connected<br />
to a medium-sized wind farm. The system is aimed at<br />
optimising balancing strategies and providing services<br />
to the grid. The wind farm operator uses advanced<br />
forecasting tools combined with the battery operation to<br />
increase the dispatchability of energy.<br />
<strong>Europe</strong>an countries have been pioneers in the<br />
development of wind technology. Knowledge derived<br />
from this experience combined with innovative solutions<br />
may enable operators to foster further O&M innovations<br />
like advanced predictive maintenance. Indeed, the latter is<br />
the most effective strategy in the wind sector, allowing for<br />
intervention planning in the best periods and minimizing<br />
repairing costs while ensuring reliable performance even<br />
during extended life time.<br />
Maintenance activities themselves are being optimized by<br />
using operational data storage and management due to<br />
high volume data coming from SCADA, ERP, CMS and onsite<br />
inspections using a digital platform and cloud solution.<br />
Together with the integration of other added-value<br />
functions in the maintenance process, such as Operational<br />
Efficiency, Quality Plans, Spare Parts Management or<br />
Local Control Rooms live Operation, these are key to move<br />
towards a fully programmable wind plant.<br />
On-site activities have been recently improved by using<br />
drones, operated underwater vehicle (ROVs) or live<br />
videos to allow specialists to safely guide <strong>work</strong>ers on site.<br />
Furthermore, thanks to digital tools, it is now possible to<br />
track easily all the activities performed on the wind turbine.<br />
O&M ACTIVITIES ARE OPTIMISED<br />
BY USING BIG DATA,<br />
CLOUD SOLUTIONS AND<br />
REMOTELY OPERATED<br />
VEHICLES OR DRONES<br />
4.3 OFFSHORE WIND COST<br />
REDUCTION<br />
The cost of offshore wind energy is clearly declining and<br />
the reductions are fully visible through the last three<br />
auctions held in United Kingdom, Denmark and latest<br />
in the Netherlands. DONG Energy recently won the<br />
Borssele 1&2 auction with a strike price of €72.7/MWh,<br />
Photo: ENEL Green Power<br />
<strong>Making</strong> <strong>transition</strong> <strong>work</strong><br />
<strong>Wind</strong><strong>Europe</strong><br />
33
<strong>Making</strong> <strong>transition</strong> <strong>work</strong>: innovative technology<br />
4.4 MANUFACTURING<br />
INNOVATION<br />
One of the most delicate and resource-intensive processes<br />
in the manufacturing of wind turbines is the production<br />
of blades. Added to this complex process, the increasing<br />
needs for enlarging rotor blades for low wind applications<br />
make it an area where industry can make significant cost<br />
savings.<br />
Photo: DONG Energy<br />
not including grid connection. This winning bid breaks by<br />
distance the €100/MWh 2020 industry target for a project<br />
FID’ed (Final Investment Decision) more than 3 years<br />
before the deadline.<br />
Breaking the €100/MWh target now makes it also likely<br />
that the offshore wind industry will reach its €80/MWh<br />
ambition in 2025 for more average sites than Borssele<br />
sites and thereby being fully competitive with gas,<br />
coal and nuclear. The achieved and future further cost<br />
reductions result in a one-to-one reduction of the subsidy<br />
and therefore cost reductions are lowering the subsidy<br />
cost to the full benefit of the consumers.<br />
OFFSHORE WIND COST<br />
REDUCTION THANKS TO<br />
INDUSTRIALISATION,<br />
BIGGER TURBINES,<br />
INCREASED CONFIDENCE<br />
OF INVESTORS AND<br />
PIPELINE OF PROJECTS<br />
VISIBILITY<br />
Recent development of blades is focused on noise,<br />
efficiency and material quality improvements. Innovation<br />
in enhanced structural design, material science advances<br />
and aerodynamics are making significant progresses in<br />
manufacturing processes.<br />
Nordex has introduced a slender design and a light weight<br />
construction of a blade using carbon fibre. This design<br />
reduces significantly aerodynamic and gravitational loads,<br />
while achieving competitive energy yields. It also cuts<br />
noise emission using measures to reduce rear edge noise,<br />
which is one of the main sources of noise.<br />
New noise and aerodynamic features include winglets<br />
and tip features, vortex generators, serrated trailing edges<br />
and noise reduction operation.<br />
Blades cost reduction can also be achieved through<br />
production processes. Acciona <strong>Wind</strong>power was the first<br />
company to introduce standardised mould-technology for<br />
moulding different lengths of blades, changing only the<br />
tip of the mould. This way the mould investment and time<br />
to market is reduced considerably.<br />
The competitive strike price for the Borssele 1&2 wind<br />
farms is due to a number of reasons. Mainly the continued<br />
industrialisation of the offshore wind industry, the size of<br />
the wind farms getting bigger, an increasing confidence<br />
among investors and market visibility until 2020 with<br />
political targets for RES production. The sequence of<br />
five auctions in the Netherlands is such a vital political<br />
commitment to the industry.<br />
Photo: Nordex-Acciona<br />
34 <strong>Making</strong> <strong>transition</strong> <strong>work</strong><br />
<strong>Wind</strong><strong>Europe</strong>
5.<br />
MAKING<br />
TRANSITION<br />
WORK: AN<br />
INTEGRATED<br />
ENERGY SYSTEM<br />
Reviving the EU market for wind energy includes looking<br />
beyond the current power system. To secure a continuous<br />
and sustainable deployment of wind energy, new sources<br />
of demand for clean electricity will be crucially needed.<br />
As power demand in the EU has been consistently falling<br />
since 2008 at a rate of 6% per year, there are now serious<br />
questions on the viability of future investments for new<br />
generation. This is particularly true in countries in which<br />
uneconomical power plants are not exiting the market,<br />
preventing the entry of innovative and clean sources of<br />
generation. This puts at risk the <strong>transition</strong> to the zero<br />
carbon economy.<br />
For more than 30 years, investments in power generation<br />
were based on forecasts of a continuous demand increase.<br />
Between 1971 and 2000, there was a threefold increase<br />
in electricity demand in OECD countries. However,<br />
throughout the following decade, it grew only by 12%,<br />
and in recent years, it flattened out.<br />
If investments in clean energy are to continue at a higher<br />
pace than in previous years, it is vital that the electrification<br />
of other energy sectors is considered as a priority.<br />
<strong>Making</strong> <strong>transition</strong> <strong>work</strong><br />
<strong>Wind</strong><strong>Europe</strong><br />
35
<strong>Making</strong> <strong>transition</strong> <strong>work</strong>: an integrated energy system<br />
FIGURE 16<br />
Power consumption in the <strong>Europe</strong>an Union<br />
2,900<br />
2,800<br />
2,700<br />
2,600<br />
2,500<br />
2,400<br />
2,300<br />
2000<br />
2001<br />
2002<br />
2003<br />
2004<br />
2005<br />
2006<br />
TWh<br />
2007<br />
2008<br />
2009<br />
2010<br />
2011<br />
2012<br />
2013<br />
2014<br />
Source: Eurostat<br />
Integrating these energy sectors into electricity – namely<br />
heating, cooling and transport – is not only compelling<br />
from the environmental and climate action points of view,<br />
but also for fuel dependency, energy security and fuel<br />
imports cost savings.<br />
HEATING AND COOLING<br />
CONSUME HALF OF<br />
EU’S ENERGY<br />
80% OF IT COMES<br />
FROM FOSSIL FUELS<br />
Heating and cooling consume half of EU’s energy, and 80%<br />
of it comes from fossil fuels, mainly natural gas. 90% of<br />
natural gas imports are used to warm spaces and water<br />
in <strong>Europe</strong>an homes, offices and industry 33 . Even minor<br />
energy savings in this sector have massive benefits for<br />
consumers and governments on economic, environmental<br />
and energy security levels.<br />
Similarly, transport is the most fuel import-dependent<br />
sector in <strong>Europe</strong>. Oil covers 94% of the fuel demand in<br />
this sector and the EU has a 90% oil import dependency 34 .<br />
This means that out of each €1 bn that the EU spends a<br />
day in everyday fuel imports, approximately €900 million<br />
are spent on crude and oil products 35 .<br />
Taking into account that transport is responsible for one<br />
third of GHG emissions in the EU and road transport<br />
alone is the second biggest source of GHG emissions, the<br />
current low oil prices period is an opportunity to spare<br />
financial resources to invest in new and zero emissions<br />
technologies.<br />
It is hard to predict for how long oil prices will remain at<br />
current levels, but the IEA expects that a balance between<br />
supply and demand is likely to be reached by 2017. From<br />
2018 onwards, there will be oil stocks withdrawals,<br />
yielding to a gradual increase in price levels 36 .<br />
Moreover, recent history has shown that the threats to<br />
the security of supply come in unexpected ways. Only two<br />
years ago, the crisis in Ukraine was on top of the EU energy<br />
agenda. Regional conflict, geopolitical crises, terrorist<br />
attacks and natural disasters can cause an interrumption<br />
of the current oversupply of oil.<br />
Acting with urgency in the diversification of supply<br />
sources for heating, cooling and transport must be part<br />
of the <strong>Europe</strong>an vision of a sustainable, secure and<br />
33. An EU strategy on heating and cooling. <strong>Europe</strong>an Commission, 2016. https://ec.europa.eu/transparency/regdoc/rep/1/2016/EN/1-<br />
2016-51-EN-F1-1.PDF<br />
34. A <strong>Europe</strong>an strategy for low-emissions mobility, <strong>Europe</strong>an Commission, 2016. http://ec.europa.eu/transport/themes/strategies/<br />
news/2016-07-20-decarbonisation_en.htm<br />
35. Energy security strategy, <strong>Europe</strong>an Commission, 2015. http://eur-lex.europa.eu/legal-content/EN/ALL/?uri=CELEX:52014DC0330&-<br />
qid=1407855611566<br />
36. Speech of IEA Executive Director Fatih Birol at the meeting of international finance and economy, 21 April, 2016. https://www.iea.org/<br />
newsroomandevents/speeches/160421_Birol_Tokyo.pdf<br />
36 <strong>Making</strong> <strong>transition</strong> <strong>work</strong><br />
<strong>Wind</strong><strong>Europe</strong>
<strong>Making</strong> <strong>transition</strong> <strong>work</strong>: an integrated energy system<br />
RUNNING ON WIND<br />
the Dutch rail net<strong>work</strong><br />
Trains in the Netherlands will soon be 100%<br />
powered by wind energy. Local wind farms already<br />
supply half of the 1.4 TWh/year needed to run the<br />
2,900 km, 1.5kV DC rail net<strong>work</strong>. New wind farms<br />
from Belgium and Scandinavia will cover the other<br />
half through the largest yet signed PPA contract in<br />
<strong>Europe</strong>.<br />
The NS, the rail operator in the Netherlands, expects<br />
CO 2<br />
savings for 550,000 tCO 2<br />
/year and keeps ticket<br />
prices stable by reducing the use of energy per km<br />
travelled.<br />
The contract ensures that no disruptions or delays<br />
in the rail service will be made. Energy provider<br />
guarantees a wind farm portfolio to supply the<br />
annual amount of electricity needed.<br />
affordable energy system. Electricity supply through clean<br />
indigenous sources could play a bigger role in this sense.<br />
There are other benefits of accelerating electrification,<br />
such as increasing energy efficiency and safety in homes<br />
and businesses by reducing the amount and handling<br />
of explosive fuels. Also, there are synergies with the<br />
digitisation of economy that could enable consumers to<br />
take a more active role in managing their own energy<br />
consumption, participate in the market and overall save<br />
costs.<br />
However the most compelling driver is to reap the<br />
benefits of a rapid decarbonisation as the carbon intensity<br />
of electricity generation can be reduced much faster and<br />
more cost effectively than by fuel switching in the heating<br />
and cooling and transport sectors.<br />
No other current sector can reduce CO 2<br />
emissions as fast<br />
as electricity generation and demand.<br />
Considering CO 2<br />
emissions from transports will need<br />
to decrease by 70% in 2050, wind energy and other<br />
renewables could visibly contribute to the transformation<br />
of this sector. For example, 5% of all passenger trains in<br />
Belgium were powered by wind power following the<br />
inauguration of the 14 MW E40 Gingelom wind farm in<br />
2015 37 . In neighbouring Netherlands, wind provided 50%<br />
of the energy needed to run the rail net<strong>work</strong> and it has<br />
been announced it will run entirely on wind energy by<br />
2018 38 .<br />
Photo: <strong>Wind</strong><strong>Europe</strong><br />
While public passenger mobility is a clear low hanging fruit<br />
for the electrification of transport, electric vehicles (EVs)<br />
hold the key for large scale sector coupling. EVs are today<br />
‘on cusp of viability’ 39 and it is expected that commercial<br />
success will take off as from 2020. By 2040, between 35%-<br />
40% of all new cars worldwide will be electric 40 .<br />
The <strong>transition</strong> to EVs will add an estimated 100 TWh of<br />
additional demand annually 41 . While this is a relatively<br />
small amount in comparison to today’s electricy demand<br />
in <strong>Europe</strong> (above 3,000 TWh/year), it is expected that<br />
consumers will demand solely renewable energy to power<br />
their vehicles. Estimates at the highest end indicate that<br />
up 8% of additional power demand to 2040 could be<br />
possible, offsetting thereby the impact of energy efficiency<br />
and pushing battery costs down by 76% 42 .<br />
37. http://www.windpowermonthly.com/article/1370069/belgian-trains-powered-wind<br />
38. http://www.railway-technology.com/features/featuremichel-kerkhof-of-eneco-discusses-the-dutch-rail-net<strong>work</strong>s-renewable-revolution-4647194/<br />
39. 2016 New energy outlook, BNEF, June 2016 http://www.bloomberg.com/company/new-energy-outlook/<br />
40. IEA, World Energy Outlook, 450 scenario<br />
41. 2016 New energy outlook, BNEF, June 2016 http://www.bloomberg.com/company/new-energy-outlook/<br />
42. Ibid<br />
<strong>Making</strong> <strong>transition</strong> <strong>work</strong><br />
<strong>Wind</strong><strong>Europe</strong><br />
37
<strong>Making</strong> <strong>transition</strong> <strong>work</strong>: an integrated energy system<br />
FIGURE 17<br />
Global sales of light duty electrical and internal<br />
combustion engine vehicles<br />
200<br />
The residential sector also holds a huge potential for<br />
electrification. Various technologies such as induction<br />
cooking, heat pumps, smart technologies controlling<br />
energy consuming appliances, and direct heating based<br />
on electricity are available in the market.<br />
Million<br />
150<br />
100<br />
50<br />
In the industrial sector, devices such as resistance,<br />
induction and microwave heating, arc furnaces, or heat<br />
pumps can be used to considerably lower heating carbon<br />
emissions.<br />
All these are established technologies, whose deployment<br />
is further accelerated by the ongoing digitisation of the<br />
economy. It is in the primary economic and environmental<br />
interest of the <strong>Europe</strong>an Union to facilitate the adoption<br />
of these technologies.<br />
2000 2010 2020 2030 2040<br />
Internal combustion engine vehicles<br />
Electric vehicles<br />
Source: International Energy Agency, 2015<br />
A number of regulatory barriers are holding up<br />
electrification at households and industries. An example is<br />
the way electricity bills are taxed and levied. In Denmark,<br />
for instance, the use of wood chips for heating production<br />
FIGURE 18<br />
Electric vehicles and electricity demand<br />
3,000 40,000<br />
Battery demand for cars (TWh)<br />
2,500<br />
2,000<br />
1,500<br />
1,000<br />
500<br />
38,000<br />
36,000<br />
34,000<br />
32,000<br />
30,000<br />
28,000<br />
26,000<br />
24,000<br />
22,000<br />
20,000<br />
2012 2015 2020 2025 2030 2035 2040<br />
Global electricity demand (TWh)<br />
<strong>Europe</strong> USA China<br />
Japan<br />
RoW<br />
Global power generation including EVs (secondary axis)<br />
Electricity demand without EVs (secondary axis)<br />
Source: Bloomberg New Energy Finance, New Energy Outlook 2016<br />
38 <strong>Making</strong> <strong>transition</strong> <strong>work</strong><br />
<strong>Wind</strong><strong>Europe</strong>
<strong>Making</strong> <strong>transition</strong> <strong>work</strong>: an integrated energy system<br />
is not taxed, making it cheaper for a small district heating<br />
company to use a wood boiler than a heat pump. Taxes<br />
and net<strong>work</strong> costs represent more than 60% of the<br />
electricity bill 43 .<br />
At EU-level, when policy makers compare energy carriers<br />
to measure their efficiency, they use the Primary Energy<br />
Factor (PEF). These values determine whether using<br />
electricity is more efficient than using fossil fuels in<br />
heating applications for example. Today’s value used by<br />
the <strong>Europe</strong>an Commission reflects the energy mix of the<br />
90’s, ignoring the contribution of renewables to energy<br />
efficiency. Adapting its current value will lead to important<br />
incentives under regulatory frame<strong>work</strong>s such as the ecodesign<br />
and energy labelling legislation.<br />
Finally, alternative solutions to direct electrification could<br />
also be an option in the long run. In particular, powerto-gas<br />
applications could help to introduce renewable<br />
sources into transport and heating sectors. Power-to-gas<br />
could also be used to substitute the use of conventional<br />
hydrogen (based on natural gas) by renewable-based<br />
hydrogen in industries such as the chemical (i.e. ethanol<br />
and fertilizer production) and refineries (hydrogen use for<br />
desulphiration of traditional fuels) sectors.<br />
Power-to-gas can take many forms, mainly using hydrogen<br />
as an energy vector to couple power, transport and<br />
heating sectors, providing for a long-term and seasonal<br />
storage solution.<br />
The power-to-gas system could alleviate issues linked to<br />
renewables integration too. Combining it with demand<br />
management could transform renewable power into<br />
hydrogen at times where generation is higher than<br />
demand and no cross-border trading is taking place,<br />
thereby reducing wind curtailment.<br />
FIGURE 19<br />
Power to gas applications<br />
Renewable electricity<br />
Electricity infrastructure<br />
Electricity<br />
Hydrogen<br />
Gas<br />
Electricity grid<br />
Hydrogen applications<br />
G<br />
Gas turbine / CCGT<br />
Fuel cell<br />
Methanation<br />
Electrolysis<br />
Hydrogen infrastructure<br />
H2 Supply Chain<br />
H 2<br />
Underground storage<br />
Gas infrastructure<br />
H 2<br />
Refuelling stations<br />
Refineries<br />
Industry<br />
Mobility Fuels Chemicals<br />
Gas grid<br />
Source: Adaptation of Power to gas study, LBST and Hinicio, 2016<br />
43. Eurostat, Electricty prices for domestic consumers, nrg_pc_204, 2015. Average data in EU 28 for second semester 2015, 1,000 kW-<br />
2,500 kW.<br />
<strong>Making</strong> <strong>transition</strong> <strong>work</strong><br />
<strong>Wind</strong><strong>Europe</strong><br />
39
6.<br />
RECOMMENDATIONS<br />
The <strong>Europe</strong>an energy sector is undergoing a structural<br />
transformation. Renewables are rapidly replacing fossil<br />
fuels for power generation and are expected to supply<br />
60% of electricity in the EU by 2040.<br />
The wind energy industry, as an established pillar of the<br />
EU power system, is changing to fit to the new market<br />
structure and to better respond to present and future<br />
challenges. Technological and operational innovations<br />
are driving down the costs of sourcing electricity from<br />
the wind, increasing the technology’s competitiveness<br />
vis-à-vis other conventional and renewable energy<br />
technologies.<br />
However, the current uncertainties regarding the EU<br />
energy regulatory frame<strong>work</strong> could prevent <strong>Europe</strong><br />
from tapping into wind energy’s immense resources and<br />
consolidate its global technology leadership.<br />
Unstable regulatory frame<strong>work</strong>s disrupt power markets<br />
and risk dissipating the multiple benefits renewables and<br />
wind energy in particular can bring to <strong>Europe</strong> in terms of<br />
economic development and climate change mitigation.<br />
At the same time, emerging and mature economies outside<br />
<strong>Europe</strong> are creating increasingly beneficial conditions for<br />
wind energy development, moving investments away<br />
from the EU.<br />
The <strong>Europe</strong>an Commission should therefore<br />
raise its ambition to at least 30% of renewable<br />
energy in final energy consumption by 2030<br />
and put in place a clear and robust governance ensuring<br />
Member States jointly contribute to reach the EU-level<br />
2030 target.<br />
The Commission should also prevent investor confidence<br />
to be compromised by abrupt and retroactive changes to<br />
national regulatory frame<strong>work</strong>s.<br />
In parallel, the new market design will need<br />
to adapt to the increasing penetration of<br />
renewables, reflect short-term market signals<br />
and ensure long-term stability of future<br />
revenues. A well-functioning energy market will also<br />
adjust to renewable energy’s intrinsic variability, allowing<br />
a level playing field among all market participants.<br />
Policies facilitating permitting at national level<br />
should continue to 2020 and beyond. Waiting<br />
time to get construction and grid connection permissions<br />
for renewable energy power plants should be shortened<br />
and red tape considerably cut.<br />
In addition, the wind energy sector is consistently<br />
investing in technological advances. The industry calls<br />
for a more supportive environment for research<br />
and innovation investments and for EU funds to<br />
target more industrial delivery projects.<br />
Finally, going beyond the current demand of the power<br />
sector by integrating heating, cooling and transport<br />
sectors in the electricity supply, should be a priority.<br />
Policymakers should lift regulatory barriers and<br />
have a more ambitious and holistic approach on<br />
electrification.<br />
<strong>Wind</strong> energy is on a journey to make <strong>Europe</strong> a global<br />
leader in clean technologies. With clear support from<br />
<strong>Europe</strong>an and national institutions, wind energy will<br />
drive a successful energy <strong>transition</strong> and set a new global<br />
standard.<br />
40 <strong>Making</strong> <strong>transition</strong> <strong>work</strong><br />
<strong>Wind</strong><strong>Europe</strong>
<strong>Wind</strong><strong>Europe</strong> is the voice of the wind industry, actively<br />
promoting wind power in <strong>Europe</strong> and worldwide. It<br />
has over 500 members with headquarters in more<br />
than 40 countries, including the leading wind turbine<br />
manufacturers, component suppliers, research institutes,<br />
national wind energy associations, developers,<br />
contractors, electricity providers, financial institutions,<br />
insurance companies and consultants. This combined<br />
strength makes <strong>Wind</strong><strong>Europe</strong> <strong>Europe</strong>’s largest and most<br />
powerful wind energy net<strong>work</strong>.<br />
Rue d’Arlon 80, 1040 Brussels, Belgium<br />
T +32 2 213 1811 · F +32 2 213 1890<br />
windeurope.org