

Title Rail devolution business case narrative 1 Summary
rail-devolution-business-case-narrative
rail-devolution-business-case-narrative

Create successful ePaper yourself
Turn your PDF publications into a flip-book with our unique Google optimized e-Paper software.
Additional services to increase train frequencies at times of day when<br />
there is spare track capacity (for example in the evenings or on Sundays)<br />
Measures to improve ticket retailing and reduce fare evasion by four<br />
percentage points, including provisions of more and improved ticket<br />
machines and the installation of ticket gates at more stations<br />
Station deep cleans and enhancement of station facilities and rolling stock<br />
refurbishment delivering improved internal and external appearance<br />
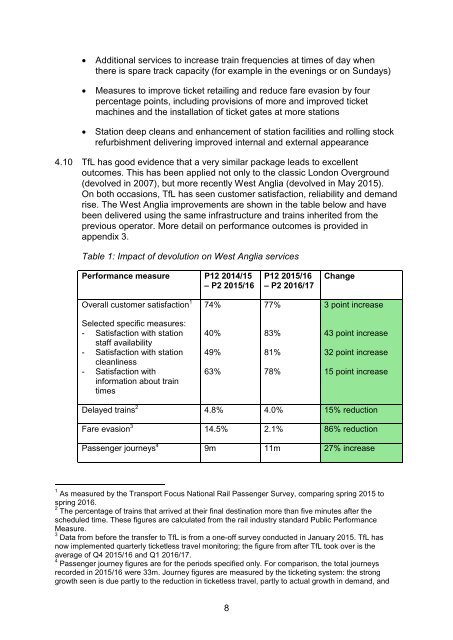
4.10 TfL has good evidence that a very similar package leads to excellent<br />
outcomes. This has been applied not only to the classic London Overground<br />
(devolved in 2007), but more recently West Anglia (devolved in May 2015).<br />
On both occasions, TfL has seen customer satisfaction, reliability and demand<br />
rise. The West Anglia improvements are shown in the table below and have<br />
been delivered using the same infrastructure and trains inherited from the<br />
previous operator. More detail on performance outcomes is provided in<br />
appendix 3.<br />
Table 1: Impact of <strong>devolution</strong> on West Anglia services<br />
Performance measure P12 2014/15<br />
– P2 2015/16<br />
P12 2015/16<br />
– P2 2016/17<br />
Change<br />
Overall customer satisfaction 1<br />
74%<br />
77%<br />
3 point increase<br />
Selected specific measures:<br />
- Satisfaction with station<br />
staff availability<br />
- Satisfaction with station<br />
cleanliness<br />
- Satisfaction with<br />
information about train<br />
times<br />
40%<br />
49%<br />
63%<br />
83%<br />
81%<br />
78%<br />
43 point increase<br />
32 point increase<br />
15 point increase<br />
Delayed trains 2 4.8% 4.0% 15% reduction<br />
Fare evasion 3 14.5% 2.1% 86% reduction<br />
Passenger journeys 4 9m 11m 27% increase<br />
1 As measured by the Transport Focus National <strong>Rail</strong> Passenger Survey, comparing spring 2015 to<br />
spring 2016.<br />
2 The percentage of trains that arrived at their final destination more than five minutes after the<br />
scheduled time. These figures are calculated from the rail industry standard Public Performance<br />
Measure.<br />
3 Data from before the transfer to TfL is from a one-off survey conducted in January 2015. TfL has<br />
now implemented quarterly ticketless travel monitoring; the figure from after TfL took over is the<br />
average of Q4 2015/16 and Q1 2016/17.<br />
4 Passenger journey figures are for the periods specified only. For comparison, the total journeys<br />
recorded in 2015/16 were 33m. Journey figures are measured by the ticketing system: the strong<br />
growth seen is due partly to the reduction in ticketless travel, partly to actual growth in demand, and<br />
8